S&P 100 Option Expiration Week StrategyThe Option Expiration Week Strategy aims to capitalize on increased volatility and trading volume that often occur during the week leading up to the expiration of options on stocks in the S&P 100 index. This period, known as the option expiration week, culminates on the third Friday of each month when stock options typically expire in the U.S. During this week, investors in this strategy take a long position in S&P 100 stocks or an equivalent ETF from the Monday preceding the third Friday, holding until Friday. The strategy capitalizes on potential upward price pressures caused by increased option-related trading activity, rebalancing, and hedging practices.
The phenomenon leveraged by this strategy is well-documented in finance literature. Studies demonstrate that options expiration dates have a significant impact on stock returns, trading volume, and volatility. This effect is driven by various market dynamics, including portfolio rebalancing, delta hedging by option market makers, and the unwinding of positions by institutional investors (Stoll & Whaley, 1987; Ni, Pearson, & Poteshman, 2005). These market activities intensify near option expiration, causing price adjustments that may create short-term profitable opportunities for those aware of these patterns (Roll, Schwartz, & Subrahmanyam, 2009).
The paper by Johnson and So (2013), Returns and Option Activity over the Option-Expiration Week for S&P 100 Stocks, provides empirical evidence supporting this strategy. The study analyzes the impact of option expiration on S&P 100 stocks, showing that these stocks tend to exhibit abnormal returns and increased volume during the expiration week. The authors attribute these patterns to intensified option trading activity, where demand for hedging and arbitrage around options expiration causes temporary price adjustments.
Scientific Explanation
Research has found that option expiration weeks are marked by predictable increases in stock returns and volatility, largely due to the role of options market makers and institutional investors. Option market makers often use delta hedging to manage exposure, which requires frequent buying or selling of the underlying stock to maintain a hedged position. As expiration approaches, their activity can amplify price fluctuations. Additionally, institutional investors often roll over or unwind positions during expiration weeks, creating further demand for underlying stocks (Stoll & Whaley, 1987). This increased demand around expiration week typically leads to temporary stock price increases, offering profitable opportunities for short-term strategies.
Key Research and Bibliography
Johnson, T. C., & So, E. C. (2013). Returns and Option Activity over the Option-Expiration Week for S&P 100 Stocks. Journal of Banking and Finance, 37(11), 4226-4240.
This study specifically examines the S&P 100 stocks and demonstrates that option expiration weeks are associated with abnormal returns and trading volume due to increased activity in the options market.
Stoll, H. R., & Whaley, R. E. (1987). Program Trading and Expiration-Day Effects. Financial Analysts Journal, 43(2), 16-28.
Stoll and Whaley analyze how program trading and portfolio insurance strategies around expiration days impact stock prices, leading to temporary volatility and increased trading volume.
Ni, S. X., Pearson, N. D., & Poteshman, A. M. (2005). Stock Price Clustering on Option Expiration Dates. Journal of Financial Economics, 78(1), 49-87.
This paper investigates how option expiration dates affect stock price clustering and volume, driven by delta hedging and other option-related trading activities.
Roll, R., Schwartz, E., & Subrahmanyam, A. (2009). Options Trading Activity and Firm Valuation. Journal of Financial Markets, 12(3), 519-534.
The authors explore how options trading activity influences firm valuation, finding that higher options volume around expiration dates can lead to temporary price movements in underlying stocks.
Cao, C., & Wei, J. (2010). Option Market Liquidity and Stock Return Volatility. Journal of Financial and Quantitative Analysis, 45(2), 481-507.
This study examines the relationship between options market liquidity and stock return volatility, finding that increased liquidity needs during expiration weeks can heighten volatility, impacting stock returns.
Summary
The Option Expiration Week Strategy utilizes well-researched financial market phenomena related to option expiration. By positioning long in S&P 100 stocks or ETFs during this period, traders can potentially capture abnormal returns driven by option market dynamics. The literature suggests that options-related activities—such as delta hedging, position rollovers, and portfolio adjustments—intensify demand for underlying assets, creating short-term profit opportunities around these key dates.
Cari dalam skrip untuk "北京地铁3号线和12号线线路图"

XAUUSD 10-Minute StrategyThis XAUUSD 10-Minute Strategy is designed for trading Gold vs. USD on a 10-minute timeframe. By combining multiple technical indicators (MACD, RSI, Bollinger Bands, and ATR), the strategy effectively captures both trend-following and reversal opportunities, with adaptive risk management for varying market volatility. This approach balances high-probability entries with robust volatility management, making it suitable for traders seeking to optimise entries during significant price movements and reversals.
Key Components and Logic:
MACD (12, 26, 9):
Generates buy signals on MACD Line crossovers above the Signal Line and sell signals on crossovers below the Signal Line, helping to capture momentum shifts.
RSI (14):
Utilizes oversold (below 35) and overbought (above 65) levels as a secondary filter to validate entries and avoid overextended price zones.
Bollinger Bands (20, 2):
Uses upper and lower Bollinger Bands to identify potential overbought and oversold conditions, aiming to enter long trades near the lower band and short trades near the upper band.
ATR-Based Stop Loss and Take Profit:
Stop Loss and Take Profit levels are dynamically set as multiples of ATR (3x for stop loss, 5x for take profit), ensuring flexibility with market volatility to optimise exit points.
Entry & Exit Conditions:
Buy Entry: T riggered when any of the following conditions are met:
MACD Line crosses above the Signal Line
RSI is oversold
Price drops below the lower Bollinger Band
Sell Entry: Triggered when any of the following conditions are met:
MACD Line crosses below the Signal Line
RSI is overbought
Price moves above the upper Bollinger Band
Exit Strategy: Trades are closed based on opposing entry signals, with adaptive spread adjustments for realistic exit points.
Backtesting Configuration & Results:
Backtesting Period: July 21, 2024, to October 30, 2024
Symbol Info: XAUUSD, 10-minute timeframe, OANDA data source
Backtesting Capital: Initial capital of $700, with each trade set to 10 contracts (equivalent to approximately 0.1 lots based on the broker’s contract size for gold).
Users should confirm their broker's contract size for gold, as this may differ. This script uses 10 contracts for backtesting purposes, aligned with 0.1 lots on brokers offering a 100-contract specification.
Key Backtesting Performance Metrics:
Net Profit: $4,733.90 USD (676.27% increase)
Total Closed Trades: 526
Win Rate: 53.99%
Profit Factor: 1.44 (1.96 for Long trades, 1.14 for Short trades)
Max Drawdown: $819.75 USD (56.33% of equity)
Sharpe Ratio: 1.726
Average Trade: $9.00 USD (0.04% of equity per trade)
This backtest reflects realistic conditions, with a spread adjustment of 38 points and no slippage or commission applied. The settings aim to simulate typical retail trading conditions. However, please adjust the initial capital, contract size, and other settings based on your account specifics for best results.
Usage:
This strategy is tuned specifically for XAUUSD on a 10-minute timeframe, ideal for both trend-following and reversal trades. The ATR-based stop loss and take profit levels adapt dynamically to market volatility, optimising entries and exits in varied conditions. To backtest this script accurately, ensure your broker’s contract specifications for gold align with the parameters used in this strategy.

Performance Summary and Shading (Offset Version)Modified "Recession and Crisis Shading" Indicator by @haribotagada (Original Link: )
The updated indicator accepts a days offset (positive or negative) to calculate performance between the offset date and the input date.
Potential uses include identifying performance one week after company earnings or an FOMC meeting.
This feature simplifies input by enabling standardized offset dates, while still allowing flexibility to adjust ranges by overriding inputs as needed.
Summary of added features and indicator notes:
Inputs both positive and negative offset.
By default, the script calculates performance from the close of the input date to the close of the date at (input date + offset) for positive offsets, and from the close of (input date - offset) to the close of the input date for negative offsets. For example, with an input date of November 1, 2024, an offset of 7 calculates performance from the close on November 1 to the close on November 8, while an offset of -7 calculates from the close on October 25 to the close on November 1.
Allows user to perform the calculation using the open price on the input date instead of close price
The input format has been modified to allow overrides for the default duration, while retaining the original capabilities of the indicator.
The calculation shows both the average change and the average annualized change. For bar-wise calculations, annualization assumes 252 trading days per year. For date-wise calculations, it assumes 365 days for annualization.
Carries over all previous inputs to retain functionality of the previous script. Changes a few small settings:
Calculates start to end date performance by default instead of peak to trough performance.
Updates visuals of label text to make it easier to read and less transparent.
Changed stat box color scheme to make the text easier to read
Updated default input data to new format of input with offsets
Changed default duration statistic to number of days instead of number of bars with an option to select number of bars.
Potential Features to Add:
Import dataset from CSV files or by plugging into TradingView calendar
Example Input Datasets:
Recessions:
2020-02-01,COVID-19,59
2007-12-01,Subprime mortgages,547
2001-03-01,Dot-com,243
1990-07-01,Oil shock,243
1981-07-01,US unemployment,788
1980-01-01,Volker,182
1973-11-01,OPEC,485
Japan Revolving Door Elections
2006-09-26, Shinzo Abe
2007-09-26, Yasuo Fukuda
2008-09-24, Taro Aso
2009-09-16, Yukio Hatoyama
2010-07-08, Naoto Kan
2011-09-02, Yoshihiko Noda
Hope you find the modified indicator useful and let me know if you would like any features to be added!
Z-Score Weighted Trend System I [InvestorUnknown]The Z-Score Weighted Trend System I is an advanced and experimental trading indicator designed to utilize a combination of slow and fast indicators for a comprehensive analysis of market trends. The system is designed to identify stable trends using slower indicators while capturing rapid market shifts through dynamically weighted fast indicators. The core of this indicator is the dynamic weighting mechanism that utilizes the Z-score of price , allowing the system to respond effectively to significant market movements.
Dynamic Z-Score-Based Weighting System
The Z-Score Weighted Trend System I utilizes the Z-score of price to assign weights dynamically to fast indicators. This mechanism is designed to capture rapid market shifts at potential turning points, providing timely entry and exit signals.
Traders can choose from two primary weighting mechanisms:
Threshold-Based Weighting: The fast indicators are given weight only when the absolute Z-score exceeds a user-defined threshold. Below this threshold, fast indicators have no impact on the final signal.
Continuous Weighting: By setting the threshold to zero, fast indicators always contribute to the final signal, regardless of Z-score levels. However, this increases the likelihood of false signals during ranging or low-volatility markets
// Calculate weight for Fast Indicators based on Z-Score (Slow Indicator weight is kept to 1 for simplicity)
f_zscore_weights(series float z, simple float weight_thre) =>
float fast_weight = na
float slow_weight = na
if weight_thre > 0
if math.abs(z) <= weight_thre
fast_weight := 0
slow_weight := 1
else
fast_weight := 0 + math.sqrt(math.abs(z))
slow_weight := 1
else
fast_weight := 0 + math.sqrt(math.abs(z))
slow_weight := 1
Choice of Z-Score Normalization
Traders have the flexibility to select different Z-score processing methods to better suit their trading preferences:
Raw Z-Score or Moving Average: Traders can opt for either the raw Z-score or a moving average of the Z-score to smooth out fluctuations.
Normalized Z-Score (ranging from -1 to 1) or Z-Score Percentile: The normalized Z-score is simply the raw Z-score divided by 3, while the Z-score percentile utilizes a normal distribution for transformation.
f_zscore_perc(series float zscore_src, simple int zscore_len, simple string zscore_a, simple string zscore_b, simple string ma_type, simple int ma_len) =>
z = (zscore_src - ta.sma(zscore_src, zscore_len)) / ta.stdev(zscore_src, zscore_len)
zscore = switch zscore_a
"Z-Score" => z
"Z-Score MA" => ma_type == "EMA" ? (ta.ema(z, ma_len)) : (ta.sma(z, ma_len))
output = switch zscore_b
"Normalized Z-Score" => (zscore / 3) > 1 ? 1 : (zscore / 3) < -1 ? -1 : (zscore / 3)
"Z-Score Percentile" => (f_percentileFromZScore(zscore) - 0.5) * 2
output
Slow and Fast Indicators
The indicator uses a combination of slow and fast indicators:
Slow Indicators (constant weight) for stable trend identification: DMI (Directional Movement Index), CCI (Commodity Channel Index), Aroon
Fast Indicators (dynamic weight) to identify rapid trend shifts: ZLEMA (Zero-Lag Exponential Moving Average), IIRF (Infinite Impulse Response Filter)
Each indicator is calculated using for-loop methods to provide a smoothed and averaged view of price data over varying lengths, ensuring stability for slow indicators and responsiveness for fast indicators.
Signal Calculation
The final trading signal is determined by a weighted combination of both slow and fast indicators. The slow indicators provide a stable view of the trend, while the fast indicators offer agile responses to rapid market movements. The signal calculation takes into account the dynamic weighting of fast indicators based on the Z-score:
// Calculate Signal (as weighted average)
float sig = math.round(((DMI*slow_w) + (CCI*slow_w) + (Aroon*slow_w) + (ZLEMA*fast_w) + (IIRF*fast_w)) / (3*slow_w + 2*fast_w), 2)
Backtest Mode and Performance Metrics
The indicator features a detailed backtesting mode, allowing traders to compare the effectiveness of their selected settings against a traditional Buy & Hold strategy. The backtesting provides:
Equity calculation based on signals generated by the indicator.
Performance metrics comparing Buy & Hold metrics with the system’s signals, including: Mean, positive, and negative return percentages, Standard deviations, Sharpe, Sortino, and Omega Ratios
// Calculate Performance Metrics
f_PerformanceMetrics(series float base, int Lookback, simple float startDate, bool Annualize = true) =>
// Initialize variables for positive and negative returns
pos_sum = 0.0
neg_sum = 0.0
pos_count = 0
neg_count = 0
returns_sum = 0.0
returns_squared_sum = 0.0
pos_returns_squared_sum = 0.0
neg_returns_squared_sum = 0.0
// Loop through the past 'Lookback' bars to calculate sums and counts
if (time >= startDate)
for i = 0 to Lookback - 1
r = (base - base ) / base
returns_sum += r
returns_squared_sum += r * r
if r > 0
pos_sum += r
pos_count += 1
pos_returns_squared_sum += r * r
if r < 0
neg_sum += r
neg_count += 1
neg_returns_squared_sum += r * r
float export_array = array.new_float(12)
// Calculate means
mean_all = math.round((returns_sum / Lookback), 4)
mean_pos = math.round((pos_count != 0 ? pos_sum / pos_count : na), 4)
mean_neg = math.round((neg_count != 0 ? neg_sum / neg_count : na), 4)
// Calculate standard deviations
stddev_all = math.round((math.sqrt((returns_squared_sum - (returns_sum * returns_sum) / Lookback) / Lookback)) * 100, 2)
stddev_pos = math.round((pos_count != 0 ? math.sqrt((pos_returns_squared_sum - (pos_sum * pos_sum) / pos_count) / pos_count) : na) * 100, 2)
stddev_neg = math.round((neg_count != 0 ? math.sqrt((neg_returns_squared_sum - (neg_sum * neg_sum) / neg_count) / neg_count) : na) * 100, 2)
// Calculate probabilities
prob_pos = math.round((pos_count / Lookback) * 100, 2)
prob_neg = math.round((neg_count / Lookback) * 100, 2)
prob_neu = math.round(((Lookback - pos_count - neg_count) / Lookback) * 100, 2)
// Calculate ratios
sharpe_ratio = math.round((mean_all / stddev_all * (Annualize ? math.sqrt(Lookback) : 1))* 100, 2)
sortino_ratio = math.round((mean_all / stddev_neg * (Annualize ? math.sqrt(Lookback) : 1))* 100, 2)
omega_ratio = math.round(pos_sum / math.abs(neg_sum), 2)
// Set values in the array
array.set(export_array, 0, mean_all), array.set(export_array, 1, mean_pos), array.set(export_array, 2, mean_neg),
array.set(export_array, 3, stddev_all), array.set(export_array, 4, stddev_pos), array.set(export_array, 5, stddev_neg),
array.set(export_array, 6, prob_pos), array.set(export_array, 7, prob_neu), array.set(export_array, 8, prob_neg),
array.set(export_array, 9, sharpe_ratio), array.set(export_array, 10, sortino_ratio), array.set(export_array, 11, omega_ratio)
// Export the array
export_array
//}
Calibration Mode
A Calibration Mode is included for traders to focus on individual indicators, helping them fine-tune their settings without the influence of other components. In Calibration Mode, the user can visualize each indicator separately, making it easier to adjust parameters.
Alerts
The indicator includes alerts for long and short signals when the indicator changes direction, allowing traders to set automated notifications for key market events.
// Alert Conditions
alertcondition(long_alert, "LONG (Z-Score Weighted Trend System)", "Z-Score Weighted Trend System flipped ⬆LONG⬆")
alertcondition(short_alert, "SHORT (Z-Score Weighted Trend System)", "Z-Score Weighted Trend System flipped ⬇Short⬇")
Important Note:
The default settings of this indicator are not optimized for any particular market condition. They are generic starting points for experimentation. Traders are encouraged to use the calibration tools and backtesting features to adjust the system to their specific trading needs.
The results generated from the backtest are purely historical and are not indicative of future results. Market conditions can change, and the performance of this system may differ under different circumstances. Traders and investors should exercise caution and conduct their own research before using this indicator for any trading decisions.
Supertrend StrategyThe Supertrend Strategy was created based on the Supertrend and Relative Strength Index (RSI) indicators, widely respected tools in technical analysis. This strategy combines these two indicators to capture market trends with precision and reliability, looking for optimizing exit levels at oversold or overbought price levels.
The Supertrend indicator identifies trend direction based on price and volatility by using the Average True Range (ATR). The ATR measures market volatility by calculating the average range between an asset’s high and low prices over a set period. It provides insight into price fluctuations, with higher ATR values indicating increased volatility and lower values suggesting stability. The Supertrend Indicator plots a line above or below the price, signaling potential buy or sell opportunities: when the price closes above the Supertrend line, an uptrend is indicated, while a close below the line suggests a downtrend. This line shifts as price movements and volatility levels change, acting as both a trailing stop loss and trend confirmation.
To enhance the Supertrend strategy, the Relative Strength Index (RSI) has been added as an exit criterion. As a momentum oscillator, the RSI indicates overbought (usually above 70) or oversold (usually below 30) conditions. This integration allows trades to close when the asset is overbought or oversold, capturing gains before a possible reversal, even if the percentage take profit level has not been reached. This mechanism aims to prevent losses due to market reversals before the Supertrend signal changes.
### Key Features
1. **Entry criteria**:
- The strategy uses the Supertrend indicator calculated by adding or subtracting a multiple of the ATR from the closing price, depending on the trend direction.
- When the price crosses above the Supertrend line, the strategy signals a long (buy) entry. Conversely, when the price crosses below, it signals a short (sell) entry.
- The strategy performs a reversal if there is an open position and a change in the direction of the supertrend occurs
2. **Exit criteria**:
- Take profit of 30% (default) on the average position price.
- Oversold (≤ 5) or overbought (≥ 95) RSI
- Reversal when there is a change in direction of the Supertrend
3. **No Repainting**:
- This strategy is not subject to repainting, as long as the timeframe configured on your chart is the same as the supertrend timeframe .
4. **Position Sizing by Equity and risk management**:
- This strategy has a default configuration to operate with 35% of the equity. At the time of opening the position, the supertrend line is typically positioned at about 12 to 16% of the entry price. This way, the strategy is putting at risk about 16% of 35% of equity, that is, around 5.6% of equity for each trade. The percentage of equity can be adjusted by the user according to their risk management.
5. **Backtest results**:
- This strategy was subjected to deep backtesting and operations in replay mode, including transaction fees of 0.12%, and slippage of 5 ticks.
- The past results in deep backtest and replay mode were compatible and profitable (Variable results depending on the take profit used, supertrend and RSI parameters). However, it should be noted that few operations were evaluated, since the currency in question has been created for a short time and the frequency of operations is relatively small.
- Past results are no guarantee of future results. The strategy's backtest results may even be due to overfitting with past data.
Default Settings
Chart timeframe: 2h
Supertrend Factor: 3.42
ATR period: 14
Supertrend timeframe: 2 h
RSI timeframe: 15 min
RSI Lenght: 5 min
RSI Upper limit: 95
RSI Lower Limit: 5
Take Profit: 30%
BYBIT:1000000MOGUSDT.P

Market Bias IndicatorOverview
This Pine Script™ code generates a "Market Sentiment Dashboard" on TradingView, providing a visual summary of market sentiment across multiple timeframes. This tool aids traders in making informed decisions by displaying real-time sentiment analysis based on Exponential Moving Averages (EMA).
Key Features
Panel Positioning:
Custom Placement: Traders can position the dashboard at the top, middle, or bottom of the chart and align it to the left, centre, or right, ensuring optimal integration with other chart elements.
Customizable Colours:
Sentiment Colours: Users can define colours for bullish, bearish, and neutral market conditions, enhancing the dashboard's readability.
Text Colour: Customizable text colour ensures clarity against various background colours.
Label Size:
Scalable Labels: Adjustable label sizes (from very small to very large) ensure readability across different screen sizes and resolutions.
Market Sentiment Calculation:
EMA-Based Sentiment: The dashboard calculates sentiment using a 9-period EMA. If the EMA is higher than two bars ago, the sentiment is bullish; if lower, it's bearish; otherwise, it's neutral.
Multiple Timeframes: Sentiment is calculated for several timeframes: 30 minute, 1 hour, 4 hour, 6 hour, 8 hour, 12 hour, 1 day, and 1 week. This broad analysis provides a comprehensive view of market conditions.
Dynamic Table:
Structured Display: The dashboard uses a table to organize and display sentiment data clearly.
Real-Time Updates: The table updates in real-time, providing traders with up-to-date market information.
How It Works
EMA Calculation: The script requests EMA(9) values for each specified timeframe and compares the current EMA with the EMA from two bars ago to determine market sentiment.
Colour Coding: Depending on the sentiment (Bullish, Bearish, or Neutral), the corresponding cell in the table is color-coded using predefined colours.
Table Display: The table displays the timeframe and corresponding sentiment, allowing traders to quickly assess market trends.
Benefits to Traders
Quick Assessment: Traders can quickly evaluate market sentiment across multiple timeframes without switching charts or manually calculating indicators.
Enhanced Visualization: The color-coded sentiment display makes it easy to identify trends at a glance.
Multi-Timeframe Analysis: Provides a broad view of short-term and long-term market trends, helping traders confirm trends and avoid false signals.
This dashboard enhances the overall trading experience by providing a comprehensive, customizable, and easy-to-read summary of market sentiment.
Usage Instructions
Add the Script to Your Chart: Apply the "Market Sentiment Dashboard" indicator to your TradingView chart.
Customize Settings: Adjust the panel position, colours, and label sizes to fit your preferences.
Interpret Sentiment: Use the color-coded table to quickly understand the market sentiment across different timeframes and make informed trading decisions.
RSI Weighted Trend System I [InvestorUnknown]The RSI Weighted Trend System I is an experimental indicator designed to combine both slow-moving trend indicators for stable trend identification and fast-moving indicators to capture potential major turning points in the market. The novelty of this system lies in the dynamic weighting mechanism, where fast indicators receive weight based on the current Relative Strength Index (RSI) value, thus providing a flexible tool for traders seeking to adapt their strategies to varying market conditions.
Dynamic RSI-Based Weighting System
The core of the indicator is the dynamic weighting of fast indicators based on the value of the RSI. In essence, the higher the absolute value of the RSI (whether positive or negative), the higher the weight assigned to the fast indicators. This enables the system to capture rapid price movements around potential turning points.
Users can choose between a threshold-based or continuous weight system:
Threshold-Based Weighting: Fast indicators are activated only when the absolute RSI value exceeds a user-defined threshold. Below this threshold, fast indicators receive no weight.
Continuous Weighting: By setting the weight threshold to zero, the fast indicators always receive some weight, although this can result in more false signals in ranging markets.
// Calculate weight for Fast Indicators based on RSI (Slow Indicator weight is kept to 1 for simplicity)
f_RSI_Weight_System(series float rsi, simple float weight_thre) =>
float fast_weight = na
float slow_weight = na
if weight_thre > 0
if math.abs(rsi) <= weight_thre
fast_weight := 0
slow_weight := 1
else
fast_weight := 0 + math.sqrt(math.abs(rsi))
slow_weight := 1
else
fast_weight := 0 + math.sqrt(math.abs(rsi))
slow_weight := 1
Slow and Fast Indicators
Slow Indicators are designed to identify stable trends, remaining constant in weight. These include:
DMI (Directional Movement Index) For Loop
CCI (Commodity Channel Index) For Loop
Aroon For Loop
Fast Indicators are more responsive and designed to spot rapid trend shifts:
ZLEMA (Zero-Lag Exponential Moving Average) For Loop
IIRF (Infinite Impulse Response Filter) For Loop
Each of these indicators is calculated using a for-loop method to generate a moving average, which captures the trend of a given length range.
RSI Normalization
To facilitate the weighting system, the RSI is normalized from its usual 0-100 range to a -1 to 1 range. This allows for easy scaling when calculating weights and helps the system adjust to rapidly changing market conditions.
// Normalize RSI (1 to -1)
f_RSI(series float rsi_src, simple int rsi_len, simple string rsi_wb, simple string ma_type, simple int ma_len) =>
output = switch rsi_wb
"RAW RSI" => ta.rsi(rsi_src, rsi_len)
"RSI MA" => ma_type == "EMA" ? (ta.ema(ta.rsi(rsi_src, rsi_len), ma_len)) : (ta.sma(ta.rsi(rsi_src, rsi_len), ma_len))
Signal Calculation
The final trading signal is a weighted average of both the slow and fast indicators, depending on the calculated weights from the RSI. This ensures a balanced approach, where slow indicators maintain overall trend guidance, while fast indicators provide timely entries and exits.
// Calculate Signal (as weighted average)
sig = math.round(((DMI*slow_w) + (CCI*slow_w) + (Aroon*slow_w) + (ZLEMA*fast_w) + (IIRF*fast_w)) / (3*slow_w + 2*fast_w), 2)
Backtest Mode and Performance Metrics
This version of the RSI Weighted Trend System includes a comprehensive backtesting mode, allowing users to evaluate the performance of their selected settings against a Buy & Hold strategy. The backtesting includes:
Equity calculation based on the signals generated by the indicator.
Performance metrics table comparing Buy & Hold strategy metrics with the system’s signals, including: Mean, positive, and negative return percentages, Standard deviations (of all, positive and negative returns), Sharpe Ratio, Sortino Ratio, and Omega Ratio
f_PerformanceMetrics(series float base, int Lookback, simple float startDate, bool Annualize = true) =>
// Initialize variables for positive and negative returns
pos_sum = 0.0
neg_sum = 0.0
pos_count = 0
neg_count = 0
returns_sum = 0.0
returns_squared_sum = 0.0
pos_returns_squared_sum = 0.0
neg_returns_squared_sum = 0.0
// Loop through the past 'Lookback' bars to calculate sums and counts
if (time >= startDate)
for i = 0 to Lookback - 1
r = (base - base ) / base
returns_sum += r
returns_squared_sum += r * r
if r > 0
pos_sum += r
pos_count += 1
pos_returns_squared_sum += r * r
if r < 0
neg_sum += r
neg_count += 1
neg_returns_squared_sum += r * r
float export_array = array.new_float(12)
// Calculate means
mean_all = math.round((returns_sum / Lookback) * 100, 2)
mean_pos = math.round((pos_count != 0 ? pos_sum / pos_count : na) * 100, 2)
mean_neg = math.round((neg_count != 0 ? neg_sum / neg_count : na) * 100, 2)
// Calculate standard deviations
stddev_all = math.round((math.sqrt((returns_squared_sum - (returns_sum * returns_sum) / Lookback) / Lookback)) * 100, 2)
stddev_pos = math.round((pos_count != 0 ? math.sqrt((pos_returns_squared_sum - (pos_sum * pos_sum) / pos_count) / pos_count) : na) * 100, 2)
stddev_neg = math.round((neg_count != 0 ? math.sqrt((neg_returns_squared_sum - (neg_sum * neg_sum) / neg_count) / neg_count) : na) * 100, 2)
// Calculate probabilities
prob_pos = math.round((pos_count / Lookback) * 100, 2)
prob_neg = math.round((neg_count / Lookback) * 100, 2)
prob_neu = math.round(((Lookback - pos_count - neg_count) / Lookback) * 100, 2)
// Calculate ratios
sharpe_ratio = math.round(mean_all / stddev_all * (Annualize ? math.sqrt(Lookback) : 1), 2)
sortino_ratio = math.round(mean_all / stddev_neg * (Annualize ? math.sqrt(Lookback) : 1), 2)
omega_ratio = math.round(pos_sum / math.abs(neg_sum), 2)
// Set values in the array
array.set(export_array, 0, mean_all), array.set(export_array, 1, mean_pos), array.set(export_array, 2, mean_neg),
array.set(export_array, 3, stddev_all), array.set(export_array, 4, stddev_pos), array.set(export_array, 5, stddev_neg),
array.set(export_array, 6, prob_pos), array.set(export_array, 7, prob_neu), array.set(export_array, 8, prob_neg),
array.set(export_array, 9, sharpe_ratio), array.set(export_array, 10, sortino_ratio), array.set(export_array, 11, omega_ratio)
// Export the array
export_array
The metrics help traders assess the effectiveness of their strategy over time and can be used to optimize their settings.
Calibration Mode
A calibration mode is included to assist users in tuning the indicator to their specific needs. In this mode, traders can focus on a specific indicator (e.g., DMI, CCI, Aroon, ZLEMA, IIRF, or RSI) and fine-tune it without interference from other signals.
The calibration plot visualizes the chosen indicator's performance against a zero line, making it easy to see how changes in the indicator’s settings affect its trend detection.
Customization and Default Settings
Important Note: The default settings provided are not optimized for any particular market or asset. They serve as a starting point for experimentation. Traders are encouraged to calibrate the system to suit their own trading strategies and preferences.
The indicator allows deep customization, from selecting which indicators to use, adjusting the lengths of each indicator, smoothing parameters, and the RSI weight system.
Alerts
Traders can set alerts for both long and short signals when the indicator flips, allowing for automated monitoring of potential trading opportunities.

Normalized Linear Regression (LSMA) OscillatorNormalized Linear Regression (LSMA) Oscillator
By Nathan Farmer
The Normalized LSMA Oscillator is a trend-following indicator that enhances the classic Linear Regression (LSMA) by applying a range of normalization techniques. This indicator allows traders to smooth out and normalize LSMA signals for better trend detection and dynamic market adaptation.
Key Features:
Configurable Normalization Methods:
This indicator offers several normalization techniques, such as Z-Score, Min-Max, Mean Normalization, Robust Scaler, Logistic Function, and Quantile Transformation. Each method helps in refining LSMA outputs to improve clarity in both trending and ranging market conditions.
Smoothing Options:
Smoothing can be applied after normalization, helping to reduce noise in the signals, thus making trend-following strategies that use this indicator more effective.
Recommended Settings:
Logistic Function Normalization: Recommended length of around 12, based on my preferred signal frequency.
Z-Score Normalization: Medium period (close to the default of 50), based on my preferred signal frequency.
Min-Max Normalization: Medium period, based on my preferred signal frequency.
Mean Normalization: Medium period, based on my preferred signal frequency.
Robust Scaler: Medium period, based on my preferred signal frequency.
Quantile Transformation: Medium period, based on my preferred signal frequency.
Usage:
Designed primarily for trend-following strategies, this indicator adapts well to varying market conditions. Traders can experiment with the various normalization and smoothing settings to match the indicator to their specific needs and market preferences.
Recommendation before usage:
Always backtest the indicator for yourself with respect to how you intend to use it. Modify the parameters to suit your needs, over your preferred time frame, on your preferred asset. My preferences are for the assets I happened to be looking at when I made this indicator. Odds are, you're looking at something else, over a different time frame, in a different market environment than what my settings are tailored for.

[3Commas] Signal BuilderSignal Builder is a tool designed to help traders create custom buy and sell signals by combining multiple technical indicators. Its flexibility allows traders to set conditions based on their specific strategy, whether they’re into scalping, swing trading, or long-term investing. Additionally, its integration with 3Commas bots makes it a powerful choice for those looking to automate their trades, though it’s also ideal for traders who prefer receiving alerts and making manual decisions.
🔵 How does Signal Builder work?
Signal Builder allows users to define custom conditions using popular technical indicators, which, when met, generate clear buy or sell signals. These signals can be used to trigger TradingView alerts, ensuring that you never miss a market opportunity. Additionally, all conditions are evaluated using "AND" logic, meaning signals are only activated when all user-defined conditions are met. This increases precision and helps avoid false signals.
🔵 Available indicators and recommended settings:
Signal Builder provides access to a wide range of technical indicators, each customizable to popular settings that maximize effectiveness:
RSI (Relative Strength Index): An oscillator that measures the relative strength of price over a specific period. Traders typically configure it with 14 periods, using levels of 30 (oversold) and 70 (overbought) to identify potential reversals.
MACD (Moving Average Convergence Divergence): A key indicator tracking the crossover between two moving averages. Common settings include 12 and 26 periods for the moving averages, with a 9-period signal line to detect trend changes.
Ultimate Oscillator: Combines three different time frames to offer a comprehensive view of buying and selling pressure. Popular settings are 7, 14, and 28 periods.
Bollinger Bands %B: Provides insight into where the price is relative to its upper and lower bands. Standard settings include a 20-period moving average and a standard deviation of 2.
ADX (Average Directional Index): Measures the strength of a trend. Values above 25 typically indicate a strong trend, while values below suggest weak or sideways movement.
Stochastic Oscillator: A momentum indicator comparing the closing price to its range over a defined period. Popular configurations include 14 periods for %K and 3 for %D smoothing.
Parabolic SAR: Ideal for identifying trend reversals and entry/exit points. Commonly configured with a 0.02 step and a 0.2 maximum.
Money Flow Index (MFI): Similar to RSI but incorporates volume into the calculation. Standard settings use 14 periods, with levels of 20 and 80 as oversold and overbought thresholds.
Commodity Channel Index (CCI): Measures the deviation of price from its average. Traders often use a 20-period setting with levels of +100 and -100 to identify extreme overbought or oversold conditions.
Heikin Ashi Candles: These candles smooth out price fluctuations to show clearer trends. Commonly used in trend-following strategies to filter market noise.
🔵 How to use Signal Builder:
Configure indicators: Select the indicators that best fit your strategy and adjust their settings as needed. You can combine multiple indicators to define precise entry and exit conditions.
Define custom signals: Create buy or sell conditions that trigger when your selected indicators meet the criteria you’ve set. For example, configure a buy signal when RSI crosses above 30 and MACD confirms with a bullish crossover.
TradingView alerts: Set up alerts in TradingView to receive real-time notifications when the conditions you’ve defined are met, allowing you to react quickly to market opportunities without constantly monitoring charts.
Monitor with the panel: Signal Builder includes a visual panel that shows active conditions for each indicator in real time, helping you keep track of signals without manually checking each indicator.
🔵 3Commas integration:
In addition to being a valuable tool for any trader, Signal Builder is optimized to work seamlessly with 3Commas bots through Webhooks. This allows you to automate your trades based on the signals you’ve configured, ensuring that no opportunity is missed when your defined conditions are met. If you prefer automation, Signal Builder can send buy or sell signals to your 3Commas bots, enhancing your trading process and helping you manage multiple trades more efficiently.
🔵 Example of use:
Imagine you trade in volatile markets and want to trigger a sell signal when:
Stochastic Oscillator indicates overbought conditions with the %K value crossing below 80.
Bollinger Bands %B shows the price has surpassed the upper band, suggesting a potential reversal.
ADX is below 20, indicating that the trend is weak and could be about to change.
With Signal Builder , you can configure these conditions to trigger a sell signal only when all are met simultaneously. Then, you can set up a TradingView alert to notify you as soon as the signal is activated, giving you the opportunity to react quickly and adjust your strategy accordingly.
👨🏻💻💭 If this tool helps your trading strategy, don’t forget to give it a boost! Feel free to share in the comments how you're using it or if you have any questions.
_________________________________________________________________
The information and publications within the 3Commas TradingView account are not meant to be and do not constitute financial, investment, trading, or other types of advice or recommendations supplied or endorsed by 3Commas and any of the parties acting on behalf of 3Commas, including its employees, contractors, ambassadors, etc.

Volume Performance Table (Weekdays Only)This is a volume performance table that compares the volume from the previous trading day to the average daily volume from the previous week, month, 3-month, 6-month, and 12-month period in order to show where the rate of change of volume is contributing to the price trend.
For example, if the price trend is bullish and volume is accelerating, that is a bullish confirmation.
If the price is bearish and volume is accelerating, that is a bearish confirmation.
If the price is bullish and volume is decelerating, that is a bearish divergence.
If the price is bearish and volume is decelerating, that is a bullish divergence.
This does not include weekend trading when applied to digital assets such as cryptocurrencies.

Trend Following Moron TFM 10% System
Trend Following Moron TFM 10% System
The TFM 10% Market Timing System
The Trend Following Moron TFM 10% System is a powerful trading tool designed using Pine Script™, following the principles outlined by Dave S. Landry. This script helps traders identify optimal entry and exit points based on moving averages and market trends.
What the Script Does:
Visual representation of trend strength.
As long as it is trending in green band, trend is very strong and price is contained within 5% of the high.
As price drops to yellow band, strength is weakening and caution is advised. Price is between 5% to 10% away from52 week high.
As price drops in red band, it is to be avoided as trend is rolling over. Price is more than 10% way from 52 week high.
Moving Averages Calculation:
Users can choose between Simple Moving Average (SMA) and Exponential Moving Average (EMA) for daily, weekly, and monthly periods. The script calculates the moving averages to provide trend direction.
Trend Color Coding:
Moving averages are displayed in different colors based on market conditions: green indicates an uptrend, red for a downtrend, and gray for neutral conditions.
Highs Calculation:
The script calculates the 52-week and 12-month closing highs, which are crucial for identifying potential breakout points.
Level Definition:
Traders can set levels based on either Average True Range (ATR) or percentage changes from these highs, allowing for flexible risk management strategies.
Buy and Sell Conditions:
The script defines specific buy conditions: when the price is within 10% of the highest close and trading above the moving averages, and sell conditions: when the price falls below these thresholds.
Visual Indicators:
Buy and sell signals are visually represented on the chart with arrows, making it easy for traders to see potential trading opportunities at a glance.
Performance Labels:
The script includes performance labels that track the number of bars above or below the moving averages and the percentage change from the moving average, providing users with key metrics to evaluate their trades.
Interactive Table:
A table summarizing the buy and sell rules is displayed on the chart, ensuring that traders have quick access to the system’s trading logic.
Benefits of Using the TFM 10% System:
Streamlined Decision Making:
The script simplifies the trading process by clearly outlining buy and sell signals, making it accessible even for novice traders.
Customizable Parameters:
Users can tailor the script to their preferences by adjusting moving average types and lengths, ATR levels, and percentage thresholds. Bands are interchange able for ATR and Percent below 52 week high for volatility looks. But buy and sell are fixed in 10% threshold.
Risk Management:
By utilizing ATR and percentage levels, traders can effectively manage their risk, making the trading process more systematic.
Comprehensive Market Analysis:
The combination of multiple time frames (daily, weekly, monthly) allows for a well-rounded analysis of market trends, enhancing trading accuracy.
M & W Checklistindicator to Validate & Grade M & W Patterns.
Indicator Inputs
Table Color Palette
• Position Valid : Positions the Valid Trade table on the chart.
• Position Grade : Positions the Grade table on the chart, hover over the Column 1 Row 1 for a description of the bands.
• Size: Text size for all tables.
• Text Color : Sets text color.
• Border Color : Sets the table border color for all tables.
• Background Color : Sets table backgroud color for all tables.
Valid Trade Table
Checkboxes to indicate if the trade is valid. Fail is displayed if unchecked, Pass if checked.
Grade Table
• S/R Level 1: distance between neckline and 1st resistance area in % of the total distance between neckline and take profit. This is not for road blocks but pivot points etc before the initial run up/down in price. I have this set to 30% , this means that if there is a pivot point between the neckline and 30% of the TP level I weight it negatively.
• S/R Level 2: distance between neckline and 1st resistance area in % of the total distance between neckline and take profit. This is not for road blocks but pivot points etc before the initial run up/down in price. I have this set to 50% , this means that if there is a pivot point between the neckline and 50% of the TP level 2 weight it negatively but less so than level 1.
• S/R Level 3: distance between neckline and 1st resistance area in % of the total distance between neckline and take profit. This is not for road blocks but pivot points etc before the initial run up/down in price. I have this set to 70% , this means that if there is a pivot point between the neckline and 70% of the TP level 3 weight it negatively but less so than level 1 & level 2.
• Checkboxes are self explanatory, they are binary options, all are weighted negatively if checked and are weighted positively if unchecked. Divergence values for weighting are neutral if unckecked & weighted positively if checked.
• The select options are neutral weighting if set to neutral , if set to For its weighted positive and set to Against weighted negatively.
Technical Specification of the Scoring and Band System
Overview
The scoring system is designed to evaluate a set of technical trade conditions, assigning weights to various criteria that influence the quality of the trade. The system calculates a total score based on both positive and negative conditions. Based on the final score, the system assigns a grade or band (A, B, or C) for positive scores, and a "Negative" label for negative scores.
Scoring System
The system calculates the score by evaluating a set of 12 conditions (gradeCondition1 to gradeCondition12). These conditions are manually input by the user via checkboxes or dropdowns in a technical indicator (written in Pine Script for TradingView). The score weights vary according to the relative importance of each condition.
Condition Breakdown and Weighting:
1. Divergences (GradeCondition1 & GradeCondition2):
◦ 1H Divergence: +5 points if condition is true.
◦ 4H Divergence: +10 points if condition is true (stronger weight than 1H).
2. Support/Resistance at Neckline (GradeCondition3):
◦ Negative if present: -15 points if true (carries significant negative weight).
3. RB near Entry (GradeCondition4):
◦ Very Negative: -20 points if true (this is a critical negative condition).
4. RB can Manage (GradeCondition5):
◦ Slightly Negative: -5 points if true.
5. Institutional Value Zones (GradeCondition6 to GradeCondition8):
◦ For the trade: +5 points.
◦ Against the trade: -5 points.
◦ Neutral: 0 points.
6. S/R between Neckline & Targets (GradeCondition9 to GradeCondition11):
◦ Level 1: -10 points if true, +7 points if false.
◦ Level 2: -7 points if true, +7 points if false.
◦ Level 3: -5 points if true, +7 points if false.
◦ Use fib tool or Gann Box to measure any S/R levels setup according to your preferences.
7. News Timing (GradeCondition12):
◦ News within 3 hours: -20 points if true (strong negative factor).
◦ No upcoming news: +10 points if false.
Scoring Calculation Formula:
totalScore = score1 + score2 + score3 + score4 + score5 + score6 + score7 + score8 + score9 + score10 + score11 + score12
Where:
• score1 to score12 represent the points derived from the conditions described above.
Coloring and Visual Feedback:
• Positive Scores: Displayed in green.
• Negative Scores: Displayed in red.
Band System
The Band System classifies the total score into different grades, depending on the final value of totalScore. This classification provides an intuitive ranking for trades, helping users quickly assess trade quality.
Band Classification:
• Band A: If the totalScore is 41 or more.
◦ Represents a highly favorable trade setup.
• Band B: If the totalScore is between 21 and 40.
◦ Represents a favorable trade setup with good potential.
• Band C: If the totalScore is between 1 and 20.
◦ Represents a trade setup that is acceptable but may have risks.
• Negative: If the totalScore is 0 or less.
◦ Represents a poor trade setup with significant risks or unfavorable conditions.
Band Calculation Logic (in Pine Script):
var string grade = ""
if (totalScore >= 41)
grade := "Band A"
else if (totalScore >= 21)
grade := "Band B"
else if (totalScore >= 1)
grade := "Band C"
else
grade := "Negative"
Technical Key Points:
• Highly Negative Conditions:
◦ The system penalizes certain conditions more heavily, especially those that suggest significant risks (e.g., News in less than 3 hours, RB near Entry).
• Positive Trade Conditions:
◦ Divergences, Institutional Value Zones in favor of the trade, and lack of significant nearby resistance all contribute positively to the score.
• Flexible System:
◦ The system can be adapted or fine-tuned by adjusting the weights of individual conditions according to trading preferences.
Use Case Example:
• If a trade has 1H and 4H Divergence, RB near Entry (negative), and no upcoming news:
◦ 1H Divergence: +5 points.
◦ 4H Divergence: +10 points.
◦ RB near Entry: -20 points.
◦ No news: +10 points.
◦ Total Score: 5 + 10 - 20 + 10 = 5 → Band C.
This modular and flexible scoring system allows traders to systematically evaluate trades and quickly gauge the trade's potential based on technical indicators
Summary:
Maximum Score: 61
Minimum Score: -97
These are the bounds of the score range based on the current logic of the script.

Custom Moving Average Ribbon with EMA Table & Text ColorComprehensive Description of the Custom Moving Average Ribbon with EMA Table & Text Color
The Custom Moving Average Ribbon with EMA Table & Text Color is a highly flexible and customizable indicator designed for traders who use multiple moving averages to assess trends, strength, and potential market reversals. It plots up to 8 moving averages (either SMA, EMA, WMA, or VWMA) on the price chart and displays a table summarizing the moving averages’ values, periods, and colors. The table also allows for the customization of the text color, making it easier to align with your chart’s theme or preference.
Key Features:
Multiple Moving Averages: You can display up to 8 moving averages (MA), each of which can be customized in terms of:
Type: SMA (Simple Moving Average), EMA (Exponential Moving Average), WMA (Weighted Moving Average), or VWMA (Volume-Weighted Moving Average).
Period: Each moving average has a user-defined period, which allows for flexibility depending on your trading style (short-term, medium-term, or long-term).
Enable/Disable: Each moving average can be independently enabled or disabled based on your preference.
Moving Average Ribbon: The indicator visualizes multiple moving averages as a ribbon, giving traders insight into the market's underlying trend. The interaction between these moving averages provides essential signals:
Uptrend: Shorter-term MAs above longer-term MAs, all sloping upward.
Downtrend: Shorter-term MAs below longer-term MAs, sloping downward.
Consolidation: MAs tightly packed, indicating low volatility or a sideways market.
Customizable Table: The indicator includes a table that displays:
The Name of each moving average (e.g., MA 1, MA 2, etc.).
The Period used for each moving average.
The Current Value of each moving average.
Color Coding for easier visual identification on the chart.
Text Color Customization: You can change the text color in the table to match your chart style or to ensure high visibility.
Responsive Design: This indicator works on any time frame, whether you're a day trader, swing trader, or long-term investor, and the table adjusts dynamically as new data comes in.
How to Use the Indicator
a) Trend Identification
The Custom Moving Average Ribbon helps in identifying trends and their strength. Here’s how you can interpret the plotted moving averages:
Uptrend (Bullish):
If the shorter-term moving averages (e.g., 5-period, 10-period) are above the longer-term moving averages (e.g., 50-period, 200-period), and all the MAs are sloping upward, it suggests a strong bullish trend.
The greater the separation between the moving averages, the stronger the uptrend.
Use the table to quickly verify the current value of each MA and confirm that the price is staying above most or all of the MAs.
Downtrend (Bearish):
When shorter-term moving averages are below the longer-term moving averages and all MAs are sloping downward, this indicates a bearish trend.
Greater separation between MAs indicates a stronger downtrend.
Neutral/Consolidating Market:
If the MAs are tightly packed and frequently crossing each other, the market is likely consolidating, and a strong trend is not in play.
In these situations, it’s better to wait for a clearer signal before taking any positions.
b) Reversal Signals
Golden Cross: When a short-term moving average (e.g., 50-period) crosses above a long-term moving average (e.g., 200-period), this is considered a bullish signal, suggesting a possible upward trend.
Death Cross: When a short-term moving average crosses below a long-term moving average, it’s considered a bearish signal, indicating a potential downward trend.
c) Using the Table for Quick Reference
The table allows you to monitor:
The current price value relative to each moving average. If the price is above most MAs, the market is likely in an uptrend, and if below, in a downtrend.
Changes in MA values: If you see values of shorter-term MAs moving closer to or crossing longer-term MAs, this could indicate a weakening trend or a potential reversal.
How to Combine this Indicator with Other Indicators for a Solid Strategy
The Custom Moving Average Ribbon is powerful on its own but can be enhanced when combined with other technical indicators to form a comprehensive trading strategy.
1. Combining with RSI (Relative Strength Index)
How It Works: RSI is a momentum oscillator that measures the speed and change of price movements, typically over 14 periods. It ranges from 0 to 100, with readings above 70 considered overbought and below 30 considered oversold.
Strategy:
Overbought in an Uptrend: If the moving average ribbon indicates an uptrend but the RSI shows the market is overbought (RSI > 70), it could signal a pullback or correction is imminent.
Oversold in a Downtrend: If the moving average ribbon indicates a downtrend but the RSI shows oversold conditions (RSI < 30), a bounce or reversal may be on the horizon.
2. Combining with MACD (Moving Average Convergence Divergence)
How It Works: MACD tracks the difference between two exponential moving averages, typically the 12-period and 26-period EMAs. It generates buy and sell signals based on crossovers and divergences.
Strategy:
Trend Confirmation: Use the MACD to confirm the direction and momentum of the trend indicated by the moving average ribbon. For example, if the MACD line crosses above the signal line while the shorter-term MAs are above the longer-term MAs, it confirms strong bullish momentum.
Divergences: Watch for divergences between price action and MACD. If price is making higher highs but MACD is making lower highs, it could signal a weakening trend, which you can verify using the moving averages.
3. Combining with Bollinger Bands
How It Works: Bollinger Bands plot two standard deviations above and below a moving average, typically the 20-period SMA. The bands widen during periods of high volatility and contract during periods of low volatility.
Strategy:
Breakout or Reversal: If price action moves above the upper Bollinger Band while the shorter-term MAs are crossing above the longer-term MAs, it confirms a strong breakout. Conversely, if price touches or falls below the lower Bollinger Band and the shorter MAs start crossing below the longer-term MAs, it indicates a potential breakdown.
Mean Reversion: In sideways markets, when the moving averages are tightly packed, Bollinger Bands can help spot mean reversion opportunities (buy near the lower band, sell near the upper band).
4. Combining with Volume Indicators
How It Works: Volume is a crucial confirmation indicator for any trend or breakout. Combining volume with the moving average ribbon can enhance your strategy.
Strategy:
Trend Confirmation: If the price breaks above the moving averages and is accompanied by high volume, it confirms a strong breakout. Similarly, if price breaks below the moving averages on high volume, it signals a strong downtrend.
Divergence: If price continues to trend in one direction but volume decreases, it could indicate a weakening trend, helping you prepare for a reversal.
Example Strategies Using the Indicator
Trend-Following Strategy:
Use the moving average ribbon to identify the main trend.
Combine with MACD or RSI for confirmation of momentum.
Enter trades when the shorter-term MAs confirm the trend and the confirmation indicator (MACD or RSI) aligns with the trend.
Exit trades when the moving averages start converging or when your confirmation indicator shows signs of reversal.
Reversal Strategy:
Wait for significant crossovers in the moving averages (Golden Cross or Death Cross).
Confirm the reversal with divergence in MACD or RSI.
Use Bollinger Bands to fine-tune your entry and exit points based on overbought/oversold conditions.
Conclusion
The Custom Moving Average Ribbon with EMA Table & Text Color indicator provides a robust framework for traders looking to use multiple moving averages to gauge trend direction, strength, and potential reversals. By combining it with other technical indicators like RSI, MACD, Bollinger Bands, and volume, you can develop a solid trading strategy that enhances accuracy, reduces false signals, and maximizes profit potential in various market conditions.
This indicator offers high flexibility with customization options, making it suitable for traders of all levels and strategies. Whether you're trend-following, scalping, or swing trading, this tool provides invaluable insights into market movements.

Day & Swing Trading EMA Clouds with Adaptive LevelsDay & Swing Trading EMA Clouds with Adaptive Levels is a tool designed for traders who need a flexible indicator that adapts to both short-term (day trading) and long-term (swing trading) strategies. The indicator blends EMA clouds and adaptive support/resistance levels, making it suitable for analyzing trend strength and key price zones.
How It Works:
EMA Clouds for Trend Detection:
This indicator uses three EMAs (Fast, Intermediate, Slow) to create two clouds:
Fast Cloud: The area between the fast and Intermediate EMAs.
Slow Cloud: The area between the Intermediate and slow EMAs.
The cloud colors change based on trend direction:
Positive (uptrend): When the fast EMA is above the Intermediate EMA (turquoise) or the Intermediate EMA is above the slow EMA (teal).
Negative (downtrend): When the fast EMA is below the Intermediate EMA (pink) or the Intermediate EMA is below the slow EMA (magenta).
Traders can use these clouds to visually gauge market momentum and trend reversals.
Adaptive EMA Settings Based on Trading Mode:
The EMA lengths adjust automatically depending on whether you're in Day Trading or Swing Trading mode:
Day Trading Mode uses shorter periods to capture quick price movements:
Fast EMA: 5-period
Mid EMA: 13-period
Slow EMA: 21-period
Swing Trading Mode uses longer periods to capture broader trends:
Fast EMA: 12-period
Mid EMA: 26-period
Slow EMA: 50-period
This dynamic adjustment allows you to switch between trading styles seamlessly, with the EMAs reflecting the most relevant timeframes for each strategy.
Adaptive Support and Resistance Levels:
Depending on the selected trading mode, the indicator dynamically plots key levels:
Day Trading Mode: Previous day’s high, low, and midpoint, as well as 2-day levels.
Swing Trading Mode: Previous month’s high, low, and midpoint, as well as 2-month levels.
These levels act as dynamic support and resistance zones, giving traders critical areas to monitor for potential reversals or breakouts.
Buy & Sell Signals:
Visual buy/sell signals are generated when the fast EMA crosses above or below the slow EMA. These signals can help traders identify potential trend reversals.
Customization:
You can fully adjust the transparency and colors of the clouds to fit your personal preferences and trading style.
Why This Combination?
Combining EMA clouds with adaptive levels provides traders with a complete picture. The clouds highlight the underlying market momentum and trend strength, while the adaptive levels offer potential entry/exit points based on historical price action. This unique mashup allows traders to follow trends and plan trades around key support and resistance zones.

High/Low Breakout Statistical Analysis StrategyThis Pine Script strategy is designed to assist in the statistical analysis of breakout systems on a monthly, weekly, or daily timeframe. It allows the user to select whether to open a long or short position when the price breaks above or below the respective high or low for the chosen timeframe. The user can also define the holding period for each position in terms of bars.
Core Functionality:
Breakout Logic:
The strategy triggers trades based on price crossing over (for long positions) or crossing under (for short positions) the high or low of the selected period (daily, weekly, or monthly).
Timeframe Selection:
A dropdown menu enables the user to switch between the desired timeframe (monthly, weekly, or daily).
Trade Direction:
Another dropdown allows the user to select the type of trade (long or short) depending on whether the breakout occurs at the high or low of the timeframe.
Holding Period:
Once a trade is opened, it is automatically closed after a user-defined number of bars, making it useful for analyzing how breakout signals perform over short-term periods.
This strategy is intended exclusively for research and statistical purposes rather than real-time trading, helping users to assess the behavior of breakouts over different timeframes.
Relevance of Breakout Systems:
Breakout trading systems, where trades are executed when the price moves beyond a significant price level such as the high or low of a given period, have been extensively studied in financial literature for their potential predictive power.
Momentum and Trend Following:
Breakout strategies are a form of momentum-based trading, exploiting the tendency of prices to continue moving in the direction of a strong initial movement after breaching a critical support or resistance level. According to academic research, momentum strategies, including breakouts, can produce returns above average market returns when applied consistently. For example, Jegadeesh and Titman (1993) demonstrated that stocks that performed well in the past 3-12 months continued to outperform in the subsequent months, suggesting that price continuation patterns, like breakouts, hold value .
Market Efficiency Hypothesis:
While the Efficient Market Hypothesis (EMH) posits that markets are generally efficient, and it is difficult to outperform the market through technical strategies, some studies show that in less liquid markets or during specific times of market stress, breakout systems can capitalize on temporary inefficiencies. Taylor (2005) and other researchers have found instances where breakout systems can outperform the market under certain conditions.
Volatility and Breakouts:
Breakouts are often linked to periods of increased volatility, which can generate trading opportunities. Coval and Shumway (2001) found that periods of heightened volatility can make breakouts more significant, increasing the likelihood that price trends will follow the breakout direction. This correlation between volatility and breakout reliability makes it essential to study breakouts across different timeframes to assess their potential profitability .
In summary, this breakout strategy offers an empirical way to study price behavior around key support and resistance levels. It is useful for researchers and traders aiming to statistically evaluate the effectiveness and consistency of breakout signals across different timeframes, contributing to broader research on momentum and market behavior.
References:
Jegadeesh, N., & Titman, S. (1993). Returns to Buying Winners and Selling Losers: Implications for Stock Market Efficiency. Journal of Finance, 48(1), 65-91.
Fama, E. F., & French, K. R. (1996). Multifactor Explanations of Asset Pricing Anomalies. Journal of Finance, 51(1), 55-84.
Taylor, S. J. (2005). Asset Price Dynamics, Volatility, and Prediction. Princeton University Press.
Coval, J. D., & Shumway, T. (2001). Expected Option Returns. Journal of Finance, 56(3), 983-1009.

Pivot Points LIVE [CHE]Title:
Pivot Points LIVE Indicator
Subtitle:
Advanced Pivot Point Analysis for Real-Time Trading
Presented by:
Chervolino
Date:
September 24, 2024
Introduction
What are Pivot Points?
Definition:
Pivot Points are technical analysis indicators used to determine potential support and resistance levels in financial markets.
Purpose:
They help traders identify possible price reversal points and make informed trading decisions.
Overview of Pivot Points LIVE :
A comprehensive indicator designed for real-time pivot point analysis.
Offers advanced features for enhanced trading strategies.
Key Features
Pivot Points LIVE Includes:
Dynamic Pivot Highs and Lows:
Automatically detects and plots pivot high (HH, LH) and pivot low (HL, LL) points.
Customizable Visualization:
Multiple options to display markers, price labels, and support/resistance levels.
Fractal Breakouts:
Identifies and marks breakout and breakdown events with symbols.
Line Connection Modes:
Choose between "All Separate" or "Sequential" modes for connecting pivot points.
Pivot Extension Lines:
Extends lines from the latest pivot point to the current bar for trend analysis.
Alerts:
Configurable alerts for breakout and breakdown events.
Inputs and Configuration
Grouping Inputs for Easy Customization:
Source / Length Left / Length Right:
Pivot High Source: High price by default.
Pivot Low Source: Low price by default.
Left and Right Lengths: Define the number of bars to the left and right for pivot detection.
Colors: Customizable colors for pivot high and low markers.
Options:
Display Settings:
Show HH, LL, LH, HL markers and price labels.
Display support/resistance level extensions.
Option to show levels as a fractal chaos channel.
Enable fractal breakout/down symbols.
Line Connection Mode:
Choose between "All Separate" or "Sequential" for connecting lines.
Line Management:
Set maximum number of lines to display.
Customize line colors, widths, and styles.
Pivot Extension Line:
Visibility: Toggle the display of the last pivot extension line.
Customization: Colors, styles, and width for extension lines.
How It Works - Calculating Pivot Points
Pivot High and Pivot Low Detection:
Pivot High (PH):
Identified when a high price is higher than a specified number of bars to its left and right.
Pivot Low (PL):
Identified when a low price is lower than a specified number of bars to its left and right.
Higher Highs, Lower Highs, Higher Lows, Lower Lows:
Higher High (HH): Current PH is higher than the previous PH.
Lower High (LH): Current PH is lower than the previous PH.
Higher Low (HL): Current PL is higher than the previous PL.
Lower Low (LL): Current PL is lower than the previous PL.
Visual Elements
Markers and Labels:
Shapes:
HH and LH: Downward triangles above the bar.
HL and LL: Upward triangles below the bar.
Labels:
Optionally display the price levels of HH, LH, HL, and LL on the chart.
Support and Resistance Levels:
Extensions:
Lines extending from pivot points to indicate potential support and resistance zones.
Chaos Channels:
Display levels as a fractal chaos channel for enhanced trend analysis.
Fractal Breakout Symbols:
Buy Signals: Upward triangles below the bar.
Sell Signals: Downward triangles above the bar.
Slide 7: Line Connection Modes
All Separate Mode:
Description:
Connects pivot highs with pivot highs and pivot lows with pivot lows separately.
Use Case:
Ideal for traders who want to analyze highs and lows independently.
Sequential Mode:
Description:
Connects all pivot points in the order they occur, regardless of being high or low.
Use Case:
Suitable for identifying overall trend direction and momentum.
Pivot Extension Lines
Purpose:
Trend Continuation:
Visualize the continuation of the latest pivot point's price level.
Customization:
Colors:
Differentiate between bullish and bearish extensions.
Styles:
Solid, dashed, or dotted lines based on user preference.
Width:
Adjustable line thickness for better visibility.
Dynamic Updates:
The extension line updates in real-time as new bars form, providing ongoing trend insights.
Alerts and Notifications
Configurable Alerts:
Fractal Break Arrow:
Triggered when a breakout or breakdown occurs.
Long and Short Signals:
Specific alerts for bullish breakouts (Long) and bearish breakdowns (Short).
Benefits:
Timely Notifications:
Stay informed of critical market movements without constant monitoring.
Automated Trading Strategies:
Integrate with trading bots or automated systems for executing trades based on alerts.
Customization and Optimization
User-Friendly Inputs:
Adjustable Parameters:
Tailor pivot detection sensitivity with left and right lengths.
Color and Style Settings:
Match the indicator aesthetics to personal or platform preferences.
Line Management:
Maximum Lines Displayed:
Prevent chart clutter by limiting the number of lines.
Dynamic Line Handling:
Automatically manage and delete old lines to maintain chart clarity.
Flexibility:
Adapt to Different Markets:
Suitable for various financial instruments including stocks, forex, and cryptocurrencies.
Scalability:
Efficiently handles up to 500 labels and 100 lines for comprehensive analysis.
Practical Use Cases
Identifying Key Support and Resistance:
Entry and Exit Points:
Use pivot levels to determine optimal trade entry and exit points.
Trend Confirmation:
Validate market trends through the connection of pivot points.
Breakout and Breakdown Strategies:
Trading Breakouts:
Enter long positions when price breaks above pivot highs.
Trading Breakdowns:
Enter short positions when price breaks below pivot lows.
Risk Management:
Setting Stop-Loss and Take-Profit Levels:
Utilize pivot levels to place strategic stop-loss and take-profit orders.
Slide 12: Benefits for Traders
Real-Time Analysis:
Provides up-to-date pivot points for timely decision-making.
Enhanced Visualization:
Clear markers and lines improve chart readability and analysis efficiency.
Customizable and Flexible:
Adapt the indicator to fit various trading styles and strategies.
Automated Alerts:
Stay ahead with instant notifications on key market events.
Comprehensive Toolset:
Combines pivot points with fractal analysis for deeper market insights.
Conclusion
Pivot Points LIVE is a robust and versatile indicator designed to enhance your trading strategy through real-time pivot point analysis. With its advanced features, customizable settings, and automated alerts, it equips traders with the tools needed to identify key market levels, execute timely trades, and manage risks effectively.
Ready to Elevate Your Trading?
Explore Pivot Points LIVE and integrate it into your trading toolkit today!
Q&A
Questions?
Feel free to ask any questions or request further demonstrations of the Pivot Points LIVE indicator.

High Yield Spread Strategy with SMA FilterThis Pine Script strategy is designed for statistical analysis and research purposes only, not for live trading or financial decision-making. The script evaluates the relationship between financial volatility (measured by either the VIX or the High Yield Spread) and market positioning strategies (long or short) based on user-defined conditions. Specifically, it allows users to test the assumption that elevated levels of VIX or the High Yield Spread may justify short positions in the market—a widely held belief in financial circles—but this script demonstrates that shorting is not always the optimal choice, even under these conditions.
Key Components:
1. High Yield Spread and VIX:
• High Yield Spread is the difference between the yields of corporate high-yield (or “junk”) bonds and U.S. Treasury securities. A rising spread often reflects increased market risk perception.
• VIX (Volatility Index) is often referred to as the market’s “fear gauge.” Higher VIX levels usually indicate heightened market uncertainty or expected volatility.
2. Strategy Logic:
• The script allows users to specify a threshold for the VIX or High Yield Spread, and it automatically evaluates if the spread exceeds this level, which traditionally would suggest an environment for higher market risk and thus potentially favoring short trades.
• However, the strategy provides flexibility to enter long or short positions, even in a high-risk environment, emphasizing that a high VIX or High Yield Spread does not always warrant shorting.
3. SMA Filter:
• A Simple Moving Average (SMA) filter can be applied to the price data, where positions are only entered if the price is above or below the SMA (depending on the trade direction). This adds a technical component to the strategy, incorporating price trends into decision-making.
4. Hold Duration:
• The script also allows users to define how long to hold a position after entering, enabling an analysis of different timeframes.
Theoretical Background:
The traditional belief that high VIX or High Yield Spreads favor short positions is not universally supported by research. While a spike in the VIX or credit spreads is often associated with increased market risk, research suggests that excessive volatility does not always lead to negative returns. In fact, high volatility can sometimes signal an approaching market rebound.
For example:
• Studies have shown that long-term investments during periods of heightened volatility can yield favorable returns due to mean reversion. Whaley (2000) notes that VIX spikes are often followed by market recoveries as volatility tends to revert to its mean over time .
• Research by Blitz and Vliet (2007) highlights that low-volatility stocks have historically outperformed high-volatility stocks, suggesting that volatility may not always predict negative returns .
• Furthermore, credit spreads can widen in response to broader market stress, but these may overshoot the actual credit risk, presenting opportunities for long positions when spreads are high and risk premiums are mispriced .
Educational Purpose:
The goal of this script is to challenge assumptions about shorting during volatile periods, showing that long positions can be equally, if not more, effective during market stress. By incorporating an SMA filter and customizable logic for entering trades, users can test different hypotheses regarding the effectiveness of both long and short positions under varying market conditions.
Note: This strategy is not intended for live trading and should be used solely for educational and statistical exploration. Misinterpreting financial indicators can lead to incorrect investment decisions, and it is crucial to conduct comprehensive research before trading.
References:
1. Whaley, R. E. (2000). “The Investor Fear Gauge”. The Journal of Portfolio Management, 26(3), 12-17.
2. Blitz, D., & van Vliet, P. (2007). “The Volatility Effect: Lower Risk Without Lower Return”. Journal of Portfolio Management, 34(1), 102-113.
3. Bhamra, H. S., & Kuehn, L. A. (2010). “The Determinants of Credit Spreads: An Empirical Analysis”. Journal of Finance, 65(3), 1041-1072.
This explanation highlights the academic and research-backed foundation of the strategy and the nuances of volatility, while cautioning against the assumption that high VIX or High Yield Spread always calls for shorting.
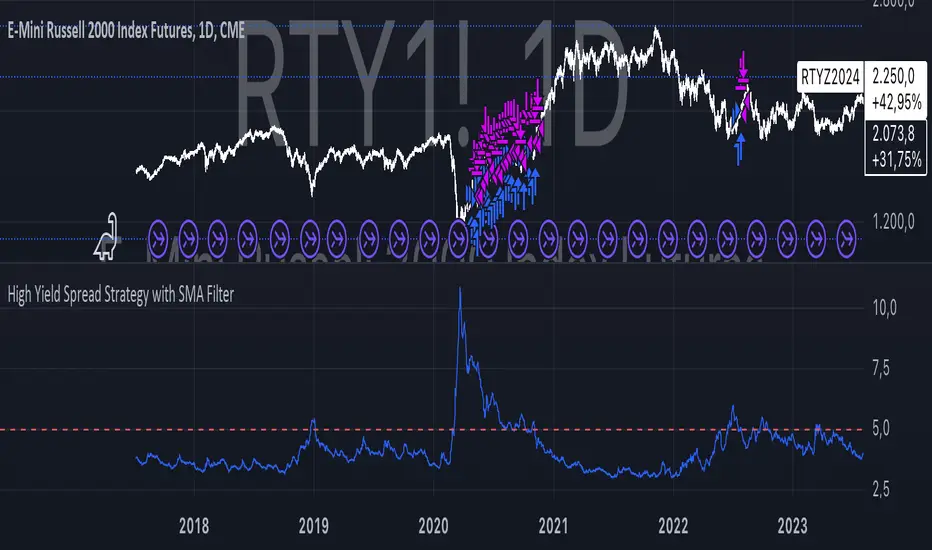
Optimized Heikin Ashi Strategy with Buy/Sell OptionsStrategy Name:
Optimized Heikin Ashi Strategy with Buy/Sell Options
Description:
The Optimized Heikin Ashi Strategy is a trend-following strategy designed to capitalize on market trends by utilizing the smoothness of Heikin Ashi candles. This strategy provides flexible options for trading, allowing users to choose between Buy Only (long-only), Sell Only (short-only), or using both in alternating conditions based on the Heikin Ashi candle signals. The strategy works on any market, but it performs especially well in markets where trends are prevalent, such as cryptocurrency or Forex.
This script offers customizable parameters for the backtest period, Heikin Ashi timeframe, stop loss, and take profit levels, allowing traders to optimize the strategy for their preferred markets or assets.
Key Features:
Trade Type Options:
Buy Only: Enter a long position when a green Heikin Ashi candle appears and exit when a red candle appears.
Sell Only: Enter a short position when a red Heikin Ashi candle appears and exit when a green candle appears.
Stop Loss and Take Profit:
Customizable stop loss and take profit percentages allow for flexible risk management.
The default stop loss is set to 2%, and the default take profit is set to 4%, maintaining a favorable risk/reward ratio.
Heikin Ashi Timeframe:
Traders can select the desired timeframe for Heikin Ashi candle calculation (e.g., 4-hour Heikin Ashi candles for a 1-hour chart).
The strategy smooths out price action and reduces noise, providing clearer signals for entry and exit.
Inputs:
Backtest Start Date / End Date: Specify the period for testing the strategy’s performance.
Heikin Ashi Timeframe: Select the timeframe for Heikin Ashi candle generation. A higher timeframe helps smooth the trend, which is beneficial for trading lower timeframes.
Stop Loss (in %) and Take Profit (in %): Enable or disable stop loss and take profit, and adjust the levels based on market conditions.
Trade Type: Choose between Buy Only or Sell Only based on your market outlook and strategy preference.
Strategy Performance:
In testing with BTC/USD, this strategy performed well in a 4-hour Heikin Ashi timeframe applied on a 1-hour chart over a period from January 1, 2024, to September 12, 2024. The results were as follows:
Initial Capital: 1 USD
Order Size: 100% of equity
Net Profit: +30.74 USD (3,073.52% return)
Percent Profitable: 78.28% of trades were winners.
Profit Factor: 15.825, indicating that the strategy's profitable trades far outweighed its losses.
Max Drawdown: 4.21%, showing low risk exposure relative to the large profit potential.
This strategy is ideal for both beginner and advanced traders who are looking to follow trends and avoid market noise by using Heikin Ashi candles. It is also well-suited for traders who prefer automated risk management through the use of stop loss and take profit levels.
Recommended Use:
Best Markets: This strategy works well on trending markets like cryptocurrency, Forex, or indices.
Timeframes: Works best when applied to lower timeframes (e.g., 1-hour chart) with a higher Heikin Ashi timeframe (e.g., 4-hour candles) to smooth out price action.
Leverage: The strategy performs well with leverage, but users should consider using 2x to 3x leverage to avoid excessive risk and potential liquidation. The strategy's low drawdown allows for moderate leverage use while maintaining risk control.
Customization: Traders can adjust the stop loss and take profit percentages based on their risk appetite and market conditions. A default setting of a 2% stop loss and 4% take profit provides a balanced risk/reward ratio.
Notes:
Risk Management: Traders should enable stop loss and take profit settings to maintain effective risk management and prevent large drawdowns during volatile market conditions.
Optimization: This strategy can be further optimized by adjusting the Heikin Ashi timeframe and risk parameters based on specific market conditions and assets.
Backtesting: The built-in backtesting functionality allows traders to test the strategy across different market conditions and historical data to ensure robustness before applying it to live trading.
How to Apply:
Select your preferred market and chart.
Choose the appropriate Heikin Ashi timeframe based on the chart's timeframe. (e.g., use 4-hour Heikin Ashi candles for 1-hour chart trends).
Adjust stop loss and take profit based on your risk management preference.
Run backtesting to evaluate its performance before applying it in live trading.
This strategy can be further modified and optimized based on personal trading style and market conditions. It’s important to monitor performance regularly and adjust settings as needed to align with market behavior.

Solar System in 3D [Astro Tool w/ Zodiac]Hello Traders and Developers,
I am excited to announce my latest Open Source indicator. At the core, this is a demonstration of PineScript’s capabilities in Rendering 3D Animations, while at the same time being a practical tool for Financial Astrologists.
This 3D Engine dynamically renders all the major celestial bodies with their individual orbits, rotation speeds, polar inclinations and astrological aspects, all while maintaining accurate spatial relationships and perspective.
This is a Geocentric model of the solar system (viewed from the perspective of Earth), since that is what most Astrologists use. Thanks to the AstroLib Library created by @BarefootJoey, this model uses the real coordinates of cosmic bodies for every timestamp.
This script truly comes to life when using the “Bar Replay” mode in TradingView, as you can observe the relationships between planets and price action as time progresses, with the full animation capabilities as mentioned above.
In addition to what I have described, this indicator also displays the orbital trajectories for each cosmic body, and has labels for everything. I have also added the ability to hover on all the labels, and see a short description of what they imply in Astrology.
Optional Planetary Aspect Computation
This indicator supports all the Major Planetary Aspects, with an accuracy defined by the user (1° by default).
Conjunction: 0° Alignment. This draws a RED line starting from the center, and going through both planets.
Sextile: 60° Alignment. This draws three YELLOW lines, connecting the planets to each other and to the center.
Square: 90° Alignment. This draws three BLUE lines, connecting the planets to each other and to the center.
Trine: 120° Alignment. This draws three PURPLE lines, connecting the planets to each other and to the center.
Opposition: 180° Alignment. This draws a GREEN line starting from one planet, passing through the center and ending on the second planet.
The below image depicts a Top-Down view of the system, with the Moon in Opposition to Venus and with Mars in Square with Neptune .
Retrograde Computation
This indicator also displays when a planet enters Retrograde (Apparent Backward Motion) by making its orbital trajectory dashed and the planet name getting a red background.
The image below displays an example of Jupiter, Saturn, Neptune and Pluto in Retrograde Motion, from the camera perspective of a 65 degree inclination.
Optional Zodiac Computation (Tropical and Sidereal)
Zodiac represents the relatively stationary star formations that rest along the ecliptic plane, with planets transitioning from one to the next, each with a 30° separation (making 12 in total). I have implemented the option to switch between Tropical mode (where these stars were 2,000 years ago) and Sidereal (where these stars are today).
The image below displays the Zodiac labels with clear lines denoting where each planet falls into.
While this indicator is deployed in a separate pane, it is trivial to transfer it onto your price chart, just by clicking and dragging the graphics. After that, you can adjust the visuals by dragging the scale on the side, or optimizing model settings. You can also drag the model above or below the price, as shown in the following image:
Of course, there are a lot of options to customize this planetary model to your tastes and analytical needs. Aside from visual changes for the labels, colors or resolution you can also disable certain planets that don’t meet your needs as shown below:
Once can also infer the current lunar phases using the Aspects between the Sun and Moon. When the Moon is Opposite the Sun that is a Full Moon, while when they are Conjunct that is a New Moon (and sometimes Eclipse).
—---------------------------------------------------------------------------
I have made this indicator open source to help PineScript programmers understand how to approach 3D graphics rendering, enabling them to develop ever more capable scripts and continuously push the boundaries of what's possible on TradingView.
The code is well documented with comments and has a clear naming convention for functions and variables, to aid developers understand how everything operates.
For financial astrologists, this indicator offers a new way to visualize and correlate planetary movements, adding depth and ease to astrological market analysis.
Regards,
Hawk

Password Generator by Chervolino [CHE]Enhancing Password Security with Pine Script: A Deep Dive into Brute-Force Attack Prevention
1. Introduction: The Importance of Password Security
Why Password Security Matters:
In today’s digital age, protecting sensitive information through strong passwords is vital. Weak passwords are vulnerable to brute-force attacks, where attackers try every possible character combination until they guess the correct one.
What is Pine Script?
Pine Script is a scripting language developed by TradingView. While mainly used for financial analysis and strategy creation, its versatility allows us to explore other domains, such as password generation and security analysis.
2. Understanding Brute-Force Attacks
What is a Brute-Force Attack?
A brute-force attack systematically tries every possible combination of characters until the correct password is found. The longer and more complex the password, the more secure it is.
Types of Characters in Passwords:
Lowercase Letters (26 characters): Examples include 'a' to 'z'.
Uppercase Letters (26 characters): Examples include 'A' to 'Z'.
Digits (10 characters): Examples include '0' to '9'.
Special Characters: Characters such as '!@#$%^&*' add further complexity to a password.
3. The Role of Password Length in Security
Why Does Password Length Matter?
The number of possible combinations grows exponentially as the length of the password increases.
For example, a password made of only lowercase letters has 26 possible characters. A 7-character password in this case has 26 raised to the power of 7 possible combinations, which equals about 8 billion possibilities.
In comparison, if uppercase letters are included, the possible combinations jump to 52 raised to the power of 7, resulting in over 1 trillion combinations.
Time to Crack a Password:
Assuming a computer can test 2.15 billion passwords per second:
A 7-character password with only lowercase letters can be cracked in about 3.74 seconds.
If uppercase letters are added, it takes approximately 8 minutes.
Adding numbers and special characters makes the cracking time increase further to hours or even days.
4. Password Strength Analysis Using Pine Script
How Pine Script Helps in Password Analysis:
Pine Script can simulate password strength by generating random passwords and calculating how long it would take for a brute-force attack to crack them based on different character combinations and lengths.
We can experiment with using different types of characters (uppercase, lowercase, digits, special characters) and varying the length of the password to estimate the security.
For example:
A password consisting only of lowercase letters would take just a few seconds to crack.
By adding uppercase letters, the time increases to several minutes.
Including digits and special characters can make a password secure for many hours, or even days, depending on the length.
5. Results: Time to Crack Passwords
Here’s a textual summary of how different passwords can be cracked based on their composition and length:
Password with Lowercase Letters Only:
Length: 8 characters
Time to Crack: Less than 1 second.
Password with Uppercase and Lowercase Letters:
Length: 8 characters
Time to Crack: Approximately 24 hours.
Password with Uppercase, Lowercase, and Digits:
Length: 8 characters
Time to Crack: Around 27 minutes.
Password with Uppercase, Lowercase, Digits, and Special Characters:
Length: 12 characters
Time to Crack: Several hundred years.
From these examples, you can see that adding complexity to a password by using a variety of character types and increasing its length exponentially increases the time required to crack it.
6. Best Practices for Password Security
Use a mix of character types: Include lowercase and uppercase letters, digits, and special characters to increase complexity.
Increase the password length: The longer the password, the more difficult it is to crack.
Avoid predictable patterns: Refrain from using common words, dates, or sequential characters like "123456" or "password123".
Use a password manager: Tools like 1Password or LastPass can help store and manage complex passwords securely, so you only need to remember one master password.
7. Conclusion
Password length and complexity are the two most important factors in protecting against brute-force attacks.
Pine Script offers a powerful way to simulate password generation and security analysis, giving you insights into how secure your password is and how long it would take to crack it.
By applying these techniques, you can ensure that your passwords are strong and secure, making brute-force attacks infeasible.

MACD with DPO Strategy by NGExplanation of the MACD with DPO Strategy:
MACD (Moving Average Convergence Divergence):
The MACD is a trend-following indicator that shows the relationship between two moving averages of a price.
In this script:
We calculate the MACD line by subtracting the slow moving average (typically 26-period EMA) from the fast moving average (typically 12-period EMA).
The Signal line is calculated as a 9-period EMA of the MACD line.
The Histogram is the difference between the MACD line and the Signal line, indicating the momentum of the price trend.
Buy Condition: The script generates a buy signal when the MACD histogram crosses from negative to positive (indicating a bullish momentum) and DPO is also positive.
Sell Condition: The script generates a sell signal when the MACD histogram crosses from positive to negative (indicating a bearish momentum) and DPO is also negative.
DPO (Detrended Price Oscillator):
The DPO removes long-term trends from prices, making it easier to identify shorter-term cycles or oscillations.
In this script:
We calculate the DPO by subtracting a shifted simple moving average (SMA) from the close price. The shifting period depends on half the specified period.
We also calculate the DPO SMA as a 30-period EMA of the DPO values.
DPO Color: The DPO line is colored green when the DPO is above zero (indicating upward momentum) and red when it is below zero (indicating downward momentum). The histogram is also colored based on whether the DPO is positive or negative.
Plotting and Alerts:
The script plots the MACD, Signal, and Histogram on the chart.
Additionally, it plots the DPO and its SMA with different colors depending on whether the DPO is above or below zero.
Buy Signal: A green arrow labeled "BUY" is plotted below the bar when both MACD and DPO indicate a bullish condition.
Sell Signal: A red arrow labeled "SELL" is plotted above the bar when both MACD and DPO indicate a bearish condition.
Background colors are used to highlight the chart whenever a buy or sell condition occurs.
The script also includes alerts for both buy and sell signals, allowing users to set notifications when conditions are met.
How to Use:
Identify Buy and Sell Signals:
The script generates a Buy signal when:
The MACD histogram crosses from negative to positive (bullish momentum), and
The DPO is above zero (indicating upward momentum).
The script generates a Sell signal when:
The MACD histogram crosses from positive to negative (bearish momentum), and
The DPO is below zero (indicating downward momentum).
Chart Visualization:
The MACD histogram and Signal line help visualize the momentum and potential trend reversal.
The DPO and DPO SMA help visualize the shorter-term price cycles.
The signals (Buy and Sell) will be plotted on the chart with arrows indicating entry points.
Customization:
You can adjust the MACD and DPO parameters (such as fast_length, slow_length, period_) to fit your trading style or market conditions.
The script can be used in any timeframe depending on your strategy (e.g., intraday trading or longer-term trading).
Example Scenario:
If you're looking for potential buy opportunities, wait for the script to generate a buy signal (green arrow) where the MACD histogram has shifted to positive, and DPO is also in the green (above zero). This signals that both momentum and cycle direction are aligned for a potential upward movement.
Conversely, for sell opportunities, wait for the red arrow where MACD momentum is turning negative and DPO is also negative (below zero), indicating a bearish condition.
This combination of MACD and DPO allows traders to identify stronger and more reliable entry/exit points by confirming the trend with the MACD and detecting shorter-term price cycles with the DPO.
Uptrick: Volume-Weighted EMA Signal### **Uptrick: Volume-Weighted EMA Signal (UVES) Indicator - Comprehensive Description**
#### **Overview**
The **Uptrick: Volume-Weighted EMA Signal (UVES)** is an advanced, multifaceted trading indicator meticulously designed to provide traders with a holistic view of market trends by integrating Exponential Moving Averages (EMA) with volume analysis. This indicator not only identifies the direction of market trends through dynamic EMAs but also evaluates the underlying strength of these trends using real-time volume data. UVES is a versatile tool suitable for various trading styles and markets, offering a high degree of customization to meet the specific needs of individual traders.
#### **Purpose**
The UVES indicator aims to enhance traditional trend-following strategies by incorporating a critical yet often overlooked component: volume. Volume is a powerful indicator of market strength, providing insights into the conviction behind price movements. By merging EMA-based trend signals with detailed volume analysis, UVES offers a more nuanced and reliable approach to identifying trading opportunities. This dual-layer analysis allows traders to differentiate between strong trends supported by significant volume and weaker trends that may be prone to reversals.
#### **Key Features and Functions**
1. **Dynamic Exponential Moving Average (EMA):**
- The core of the UVES indicator is its dynamic EMA, calculated over a customizable period. The EMA is a widely used technical indicator that smooths price data to identify the underlying trend. In UVES, the EMA is dynamically colored—green when the current EMA value is above the previous value, indicating an uptrend, and red when below, signaling a downtrend. This visual cue helps traders quickly assess the trend direction without manually calculating or interpreting raw data.
2. **Comprehensive Moving Average Customization:**
- While the EMA is the default moving average in UVES, traders can select from various other moving average types, including Simple Moving Average (SMA), Smoothed Moving Average (SMMA), Weighted Moving Average (WMA), and Volume-Weighted Moving Average (VWMA). Each type offers unique characteristics:
- **SMA:** Provides a simple average of prices over a specified period, suitable for identifying long-term trends.
- **EMA:** Gives more weight to recent prices, making it more responsive to recent market movements.
- **SMMA (RMA):** A slower-moving average that reduces noise, ideal for capturing smoother trends.
- **WMA:** Weighs prices based on their order in the dataset, making recent prices more influential.
- **VWMA:** Integrates volume data, emphasizing price movements that occur with higher volume, making it particularly useful in volume-sensitive markets.
3. **Signal Line for Trend Confirmation:**
- UVES includes an optional signal line, which applies a secondary moving average to the primary EMA. This signal line can be used to smooth out the EMA and confirm trend changes. The signal line’s color changes based on its slope—green for an upward slope and red for a downward slope—providing a clear visual confirmation of trend direction. Traders can adjust the length and type of this signal line, allowing them to tailor the indicator’s responsiveness to their trading strategy.
4. **Buy and Sell Signal Generation:**
- UVES generates explicit buy and sell signals based on the interaction between the EMA and the signal line. A **buy signal** is triggered when the EMA transitions from a red (downtrend) to a green (uptrend), indicating a potential entry point. Conversely, a **sell signal** is triggered when the EMA shifts from green to red, suggesting an exit or shorting opportunity. These signals are displayed directly on the chart as upward or downward arrows, making them easily identifiable even during fast market conditions.
5. **Volume Analysis with Real-Time Buy/Sell Volume Table:**
- One of the standout features of UVES is its integration of volume analysis, which calculates and displays the volume attributed to buying and selling activities. This analysis includes:
- **Buy Volume:** The portion of the total volume associated with price increases (close higher than open).
- **Sell Volume:** The portion of the total volume associated with price decreases (close lower than open).
- **Buy/Sell Ratio:** A ratio of buy volume to sell volume, providing a quick snapshot of market sentiment.
- These metrics are presented in a real-time table positioned in the top-right corner of the chart, with customizable colors and formatting. The table updates with each new bar, offering continuous feedback on the strength and direction of the market trend based on volume data.
6. **Customizable Settings and User Control:**
- **EMA Length and Source:** Traders can specify the lookback period for the EMA, adjusting its sensitivity to price changes. The source for EMA calculations can also be customized, with options such as close, open, high, low, or other custom price series.
- **Signal Line Customization:** The signal line’s length, type, and width can be adjusted to suit different trading strategies, allowing traders to optimize the balance between trend detection and noise reduction.
- **Offset Adjustment:** The offset feature allows users to shift the EMA and signal line forward or backward on the chart. This can help align the indicator with specific price action or adjust for latency in decision-making processes.
- **Volume Table Positioning and Formatting:** The position, size, and color scheme of the volume table are fully customizable, enabling traders to integrate the table seamlessly into their chart setup without cluttering the visual workspace.
7. **Versatility Across Markets and Trading Styles:**
- UVES is designed to be effective across a wide range of financial markets, including Forex, stocks, cryptocurrencies, commodities, and indices. Its adaptability to different markets is supported by its comprehensive customization options and the inclusion of volume analysis, which is particularly valuable in markets where volume plays a crucial role in price movement.
#### **How Different Traders Can Benefit from UVES**
1. **Trend Followers:**
- Trend-following traders will find UVES particularly beneficial for identifying and riding trends. The dynamic EMA and signal line provide clear visual cues for trend direction, while the volume analysis helps confirm the strength of these trends. This combination allows trend followers to stay in profitable trades longer and exit when the trend shows signs of weakening.
2. **Volume-Based Traders:**
- Traders who focus on volume as a key indicator of market strength can leverage the UVES volume table to gain insights into the buying and selling pressure behind price movements. By monitoring the buy/sell ratio, these traders can identify periods of strong conviction (high buy volume) or potential reversals (high sell volume) with greater accuracy.
3. **Scalpers and Day Traders:**
- For traders operating on shorter time frames, UVES provides quick and reliable signals that are essential for making rapid trading decisions. The ability to customize the EMA length and type allows scalpers to fine-tune the indicator for responsiveness, while the volume analysis offers an additional layer of confirmation to avoid false signals.
4. **Swing Traders:**
- Swing traders, who typically hold positions for several days to weeks, can use UVES to identify medium-term trends and potential entry and exit points. The indicator’s ability to filter out market noise through the signal line and volume analysis makes it ideal for capturing significant price movements without being misled by short-term volatility.
5. **Position Traders and Long-Term Investors:**
- Even long-term investors can benefit from UVES by using it to identify major trend reversals or confirm the strength of long-term trends. The flexibility to adjust the EMA and signal line to longer periods ensures that the indicator remains relevant for detecting shifts in market sentiment over extended time frames.
#### **Optimal Settings for Different Markets**
- **Forex Markets:**
- **EMA Length:** 9 to 14 periods.
- **Signal Line:** Use VWMA or WMA for the signal line to incorporate volume data, which is crucial in the highly liquid Forex markets.
- **Best Use:** Short-term trend following, with an emphasis on identifying rapid changes in market sentiment.
- **Stock Markets:**
- **EMA Length:** 20 to 50 periods.
- **Signal Line:** SMA or EMA with a slightly longer length (e.g., 50 periods) to capture broader market trends.
- **Best Use:** Medium to long-term trend identification, with volume analysis confirming the strength of institutional buying or selling.
- **Cryptocurrency Markets:**
- **EMA Length:** 9 to 12 periods, due to the high volatility in crypto markets.
- **Signal Line:** SMMA or EMA for smoothing out extreme price fluctuations.
- **Best Use:** Identifying entry and exit points in volatile markets, with the volume table providing insights into market manipulation or sudden shifts in trader sentiment.
- **Commodity Markets:**
- **EMA Length:** 14 to 21 periods.
- **Signal Line:** WMA or VWMA, considering the impact of trading volume on commodity prices.
- **Best Use:** Capturing medium-term price movements and confirming trend strength with volume data.
#### **Customization for Advanced Users**
- **Advanced Offset Usage:** Traders can experiment with different offset values to see how shifting the EMA and signal line impacts the timing of buy/sell signals. This can be particularly useful in markets with known latency or for strategies that require a delayed confirmation of trend changes.
- **Volume Table Integration:** The position, size, and colors of the volume table can be adjusted to fit seamlessly into any trading setup. For example, a trader might choose to position the table in the bottom-right corner and use a smaller size to keep the focus on price action while still having access to volume data.
- **Signal Filtering:** By combining the signal line with the primary EMA, traders can filter out false signals during periods of low volatility or when the market is range-bound. Adjusting the length of the signal line allows for greater control over the sensitivity of the trend detection.
#### **Conclusion**
The **Uptrick: Volume-Weighted EMA Signal (UVES)** is a powerful and adaptable indicator designed for traders who demand more from their technical analysis tools. By integrating dynamic EMA trend signals with real-time volume analysis, UVES offers a comprehensive view of market conditions, making it an invaluable resource for identifying trends, confirming signals, and understanding market sentiment. Whether you are a day trader, swing trader, or long-term investor, UVES provides the versatility, precision, and customization needed to make more informed and profitable trading decisions. With its ability to adapt to various markets and trading styles, UVES is not just an indicator but a complete trend analysis solution.

Time Zone Box & Alerts (Simplified)### Description
This Pine Script indicator is designed for TradingView and provides functionality for drawing time-based boxes on the chart, as well as generating alerts and labels. It is particularly useful for visualizing specific time ranges within each trading day and managing alerts based on those time intervals.
#### **Features:**
1. **Box Drawing for Specific Time Ranges**:
- **Time Interval Customization**: Allows users to specify the start and end times for the box using inputs (e.g., from 9:30 AM to 12:30 PM). The box will automatically adjust based on these times.
- **Historical Data**: The script calculates the high and low prices within the specified time range and draws a box accordingly. This box will be created for each trading day, capturing all relevant historical data within the defined time interval.
2. **Dynamic Alerts**:
- **Custom Alerts**: Users can define custom alert messages for specific times within the trading day (e.g., before and after the trading range). Alerts are triggered once per bar close at the specified times.
3. **Labels for Key Time Points**:
- **Customizable Labels**: Labels can be added at specific times to indicate important trading actions (e.g., "No Trade," "Open Trade," and "Close Trade"). The text, color, and size of these labels are customizable.
- **Label Display**: Labels appear on the chart at defined times to provide visual cues for trading decisions.
4. **Visual Customization**:
- **Box and Label Colors**: Users can choose colors for the box and labels to match their preferences or trading setup.
- **Box Transparency**: The box can be customized with varying levels of transparency to enhance chart visibility.
#### **Usage:**
1. **Set Up Time Intervals**: Define the start and end times for the box using the input fields. Adjust these settings to fit your trading strategy and time zones.
2. **Adjust Alerts and Labels**: Customize the alert messages and label text to fit your trading plan.
3. **Apply to Chart**: Add the script to your TradingView chart to visualize the time-based boxes, receive alerts, and see the labels.
This script helps traders visually identify significant time ranges within the trading day and receive timely alerts and labels, enhancing their decision-making process.
