Trend Pivot Retracements▶ OVERVIEW
Trend Pivot Retracements identifies market trend direction using a Donchian-style channel and dynamically highlights retracement zones during trending conditions. It calculates the percentage pullbacks from recent highs and lows, plots labeled zones with varying intensity, and visually connects key retracement pivots. The indicator also emphasizes price proximity to trend boundaries by dynamically adjusting the thickness of plotted trend bands.
▶ TREND DETECTION & BAND STRUCTURE
The indicator determines the current trend by checking for new 50-bar extremes:
Uptrend: If a new highest high is made, the trend is considered bullish.
Downtrend: If a new lowest low is made, the trend is considered bearish.
Uptrend Band: Plots the 50-bar lowest low as a trailing support level.
Downtrend Band: Plots the 50-bar highest high as a trailing resistance level.
Thickness Variation: The thickness of the band increases the further price moves from it, indicating overextension.
▶ RETRACEMENT LABELING SYSTEM
During a trend, the indicator monitors pivot points in the opposite direction to measure retracements:
Bullish Retracement:
Triggered when a pivot low forms during an uptrend.
Measures % pullback from the most recent swing high (searched up to 20 bars back).
Plots a bold horizontal line at the low and a dashed diagonal from the previous swing high.
Adds a “-%” label above the low; intensity is based on recent 50 pullbacks.
Bearish Retracement:
Triggered when a pivot high forms during a downtrend.
Measures % pullback from the previous swing low (up to 20 bars back).
Plots a bold horizontal line at the high and a dashed diagonal from the prior swing low.
Adds a “%” label below the high with gradient color based on the past 50 extremes.
▶ PIVOT CONNECTION LINES
Each retracement includes a visual connector:
A diagonal dashed line linking the swing extreme (20 bars back) to the retracement point.
This line visually traces the path of price retreat within the trend.
Helps traders understand where the retracement originated and how steep it was.
▶ TREND SWITCH SIGNALS
When trend direction changes:
A diamond marker is plotted on the new pivot confirming the trend shift.
Green diamonds signal new bullish trends at fresh lows.
Magenta diamonds signal new bearish trends at fresh highs.
▶ COLOR INTENSITY & CONTEXTUAL AWARENESS
To help interpret the magnitude of retracements:
The % labels are color-coded using a gradient scale that references the max of the last 50 pullbacks.
Stronger pullbacks result in deeper color intensity, signaling more significant corrections.
Trend bands also use standard deviation normalization to adjust line thickness based on how far price has moved from the band.
This creates a visual cue for potential exhaustion or volatility extremes.
▶ USAGE
Trend Pivot Retracements is a powerful tool for traders who want to:
Identify trend direction and contextual pullbacks within those trends.
Spot key retracement points that may serve as entry opportunities or reversal signals.
Use visual retracement angles to understand market pressure and trend maturity.
Read dynamic band thickness as an alert for price stretch, potential mean reversion, or breakout setups.
▶ CONCLUSION
Trend Pivot Retracements gives traders a clean, visually expressive way to monitor trending markets, while capturing and labeling meaningful retracements. With adaptive color intensity, diagonal connectors, and smart trend switching, it enhances situational awareness and provides immediate clarity on trend health and pullback strength.
Cari dalam skrip untuk "北证50+股票+新浪财经"

USDJPY Fair Value Gap + Session Strategy🎯 Overview
This strategy combines Fair Value Gaps (FVGs) with session-based order flow analysis, specifically optimized for USDJPY. It identifies price inefficiencies left behind by institutional order flow during high-volatility trading sessions, offering a modern alternative to traditional lagging indicators.
🔬 What Are Fair Value Gaps?
Fair Value Gaps represent areas where aggressive institutional buying or selling created "gaps" in the market structure:
Bullish FVG: Price moves up so aggressively that it leaves unfilled buy orders behind
Bearish FVG: Price moves down so quickly that it leaves unfilled sell orders behind
Research shows approximately 80% of FVGs get "filled" (price returns to the gap) within 20-60 bars, making them highly predictable trading zones.
(see the generated image above)
(see the generated image above)
FVG Detection Logic:
text
// Bullish FVG: Gap between high and current low
bullishFVG = low > high and high > high
// Bearish FVG: Gap between low and current high
bearishFVG = high < low and low < low
🌏 Session-Based Trading
Why Sessions Matter for USDJPY
(see the generated image above)
Tokyo Session (00:00-09:00 UTC)
Highest volatility during first hour (00:00-01:00 UTC)
Average movement: 51-60 pips
Best for breakout strategies
London/NY Overlap (13:00-16:00 UTC)
Maximum liquidity and institutional participation
Tightest spreads and most reliable FVG formations
Optimal for continuation trades
Monday Premium Effect
USDJPY moves 120+ pips on Mondays due to weekend positioning
Enhanced FVG formation during session opens
📊 Strategy Components
(see the generated image above)
1. Fair Value Gap Detection
Identifies bullish and bearish FVGs automatically
Age limit: FVGs expire after 20 bars to avoid stale setups
Size filter: Minimum gap size to filter out noise
2. Session Filtering
Tokyo Open focus: Trades during first hour of Asian session
London/NY Overlap: Captures high-liquidity institutional flows
Weekend gap strategy: Enhanced signals on Monday opens
3. Volume Confirmation
Requires 1.5x average volume spike
Confirms institutional participation
Reduces false signals
4. Trend Alignment
50 EMA filter ensures trades align with higher timeframe trend
Long trades above EMA, short trades below
Prevents costly counter-trend trades
5. Risk Management
2:1 Risk/Reward minimum ensures profitability with 40%+ win rate
Percentage-based stops adapt to USDJPY volatility (0.3% default)
Configurable position sizing
🎯 Entry Conditions
(see the generated image above)
Long Entry (BUY)
✅ Bullish FVG detected in previous bars
✅ Price returns to FVG zone during active trading session
✅ Volume spike above 1.5x average
✅ Price above 50 EMA (trend confirmation)
✅ Bullish candle closes within FVG zone
✅ Trading during Tokyo open OR London/NY overlap
Short Entry (SELL)
✅ Bearish FVG detected in previous bars
✅ Price returns to FVG zone during active trading session
✅ Volume spike above 1.5x average
✅ Price below 50 EMA (trend confirmation)
✅ Bearish candle closes within FVG zone
✅ Trading during Tokyo open OR London/NY overlap
📈 Expected Performance
Backtesting Results (Based on Similar Strategies):
Win Rate: 44-59% (profitable due to high R:R ratio)
Average Winner: 60-90 pips during London/NY sessions
Average Loser: 30-40 pips (tight stops at FVG boundaries)
Risk/Reward: 2:1 minimum, often 3:1 during strong trends
Best Performance: Monday Tokyo opens and Wednesday London/NY overlaps
Why This Works for USDJPY:
90% correlation with US-Japan bond yield spreads
High volatility provides sufficient pip movement
Heavy institutional/central bank participation creates clear FVGs
Consistent volatility patterns across trading sessions
⚙️ Configurable Parameters
Session Settings:
Trade Tokyo Session (Enable/Disable)
Trade London/NY Overlap (Enable/Disable)
FVG Settings:
FVG Minimum Size (Filter small gaps)
Maximum FVG Age (20 bars default)
Show FVG Markers (Visual display)
Volume Settings:
Use Volume Filter (Enable/Disable)
Volume Multiplier (1.5x default)
Volume Average Period (20 bars)
Trend Settings:
Use Trend Filter (Enable/Disable)
Trend EMA Period (50 default)
Risk Management:
Risk/Reward Ratio (2.0 default)
Stop Loss Percentage (0.3% default)
🎨 Visual Indicators
🟡 Yellow Line: 50 EMA trend filter
🟢 Green Triangles: Long entry signals
🔴 Red Triangles: Short entry signals
🟢 Green Dots: Bullish FVG zones
🔴 Red Dots: Bearish FVG zones
🟦 Blue Background: Tokyo open session
🟧 Orange Background: London/NY overlap
📊 Recommended Settings
Optimal Timeframes:
Primary: 5-minute charts (scalping)
Secondary: 15-minute charts (swing trading)
Parameter Optimization:
Conservative: Stop Loss 0.2%, R:R 2:1, Volume 2.0x
Balanced: Stop Loss 0.3%, R:R 2:1, Volume 1.5x (default)
Aggressive: Stop Loss 0.4%, R:R 1.5:1, Volume 1.2x
Risk Management:
Maximum 1-2% of account per trade
Daily loss limit: Stop after 3-5 consecutive losses
Use fixed percentage position sizing
⚠️ Important Considerations
Avoid Trading During:
Major news events (BOJ interventions, NFP, FOMC)
Holiday periods with reduced liquidity
Low volatility Asian afternoon sessions
When US-Japan yield differential narrows sharply
Best Practices:
Limit to 2-3 trades per session maximum
Always respect the 50 EMA trend filter
Never risk more than planned per trade
Paper trade for 2-4 weeks before live implementation
Track performance by session and day of week
🚀 How to Use
Add the script to your USDJPY chart
Set timeframe to 5-minute or 15-minute
Adjust parameters based on your risk tolerance
Enable strategy alerts for automated notifications
Wait for visual signals (triangles) to appear
Enter trades according to your risk management rules
📚 Strategy Foundation
This strategy is based on:
Smart Money Concepts (SMC): Institutional order flow tracking
Market Microstructure: Understanding how FVGs form in electronic trading
Quantified Risk Management: Statistical edge through proper R:R ratios
Session Liquidity Patterns: Exploiting predictable volatility cycles

Advanced Speedometer Gauge [PhenLabs]Advanced Speedometer Gauge
Version: PineScript™v6
📌 Description
The Advanced Speedometer Gauge is a revolutionary multi-metric visualization tool that consolidates 13 distinct trading indicators into a single, intuitive speedometer display. Instead of cluttering your workspace with multiple oscillators and panels, this gauge provides a unified interface where you can switch between different metrics while maintaining consistent visual interpretation.
Built on PineScript™ v6, the indicator transforms complex technical calculations into an easy-to-read semi-circular gauge with color-coded zones and a precision needle indicator. Each of the 13 available metrics has been carefully normalized to a 0-100 scale, ensuring that whether you’re analyzing RSI, volume trends, or volatility extremes, the visual interpretation remains consistent and intuitive.
The gauge is designed for traders who value efficiency and clarity. By consolidating multiple analytical perspectives into one compact display, you can quickly assess market conditions without the visual noise of traditional multi-indicator setups. All metrics are non-overlapping, meaning each provides unique insights into different aspects of market behavior.
🚀 Points of Innovation
13 selectable metrics covering momentum, volume, volatility, trend, and statistical analysis, all accessible through a single dropdown menu
Universal 0-100 normalization system that standardizes different indicator scales for consistent visual interpretation across all metrics
Semi-circular gauge design with 21 arc segments providing smooth precision and clear visual feedback through color-coded zones
Non-redundant metric selection ensuring each indicator provides unique market insights without analytical overlap
Advanced metrics including MFI (volume-weighted momentum), CCI (statistical deviation), Volatility Rank (extended lookback), Trend Strength (ADX-style), Choppiness Index, Volume Trend, and Price Distance from MA
Flexible positioning system with 5 chart locations, 3 size options, and fully customizable color schemes for optimal workspace integration
🔧 Core Components
Metric Selection Engine: Dropdown interface allowing instant switching between 13 different technical indicators, each with independent parameter controls
Normalization System: All metrics converted to 0-100 scale using indicator-specific algorithms that preserve the statistical significance of each measurement
Semi-Circular Gauge: Visual display using 21 arc segments arranged in curved formation with two-row thickness for enhanced visibility
Color Zone System: Three distinct zones (0-40 green, 40-70 yellow, 70-100 red) providing instant visual feedback on metric extremes
Needle Indicator: Dynamic pointer that positions across the gauge arc based on precise current metric value
Table Implementation: Professional table structure ensuring consistent positioning and rendering across different chart configurations
🔥 Key Features
RSI (Relative Strength Index): Classic momentum oscillator measuring overbought/oversold conditions with adjustable period length (default 14)
Stochastic Oscillator: Compares closing price to price range over specified period with smoothing, ideal for identifying momentum shifts
MFI (Money Flow Index): Volume-weighted RSI that combines price movement with volume to measure buying and selling pressure intensity
CCI (Commodity Channel Index): Measures statistical deviation from average price, normalized from typical -200 to +200 range to 0-100 scale
Williams %R: Alternative overbought/oversold indicator using high-low range analysis, inverted to match 0-100 scale conventions
Volume %: Current volume relative to moving average expressed as percentage, capped at 100 for extreme spikes
Volume Trend: Cumulative directional volume flow showing whether volume is flowing into up moves or down moves over specified period
ATR Percentile: Current Average True Range position within historical range using specified lookback period (default 100 bars)
Volatility Rank: Close-to-close volatility measured against extended historical range (default 252 days), differs from ATR in calculation method
Momentum: Rate of change calculation showing price movement speed, centered at 50 and normalized to 0-100 range
Trend Strength: ADX-style calculation using directional movement to quantify trend intensity regardless of direction
Choppiness Index: Measures market choppiness versus trending behavior, where high values indicate ranging markets and low values indicate strong trends
Price Distance from MA: Measures current price over-extension from moving average using standard deviation calculations
🎨 Visualization
Semi-Circular Arc Display: Curved gauge spanning from 0 (left) to 100 (right) with smooth progression and two-row thickness for visibility
Color-Coded Zones: Green zone (0-40) for low/oversold conditions, yellow zone (40-70) for neutral readings, red zone (70-100) for high/overbought conditions
Needle Indicator: Downward-pointing triangle (▼) positioned precisely at current metric value along the gauge arc
Scale Markers: Vertical line markers at 0, 25, 50, 75, and 100 positions with corresponding numerical labels below
Title Display: Merged cell showing “𓄀 PhenLabs” branding plus currently selected metric name in monospace font
Large Value Display: Current metric value shown with two decimal precision in large text directly below title
Table Structure: Professional table with customizable background color, text color, and transparency for minimal chart obstruction
📖 Usage Guidelines
Metric Selection
Select Metric: Default: RSI | Options: RSI, Stochastic, Volume %, ATR Percentile, Momentum, MFI (Money Flow), CCI (Commodity Channel), Williams %R, Volatility Rank, Trend Strength, Choppiness Index, Volume Trend, Price Distance | Choose the technical indicator you want to display on the gauge based on your current analytical needs
RSI Settings
RSI Length: Default: 14 | Range: 1+ | Controls the lookback period for RSI calculation, shorter periods increase sensitivity to recent price changes
Stochastic Settings
Stochastic Length: Default: 14 | Range: 1+ | Lookback period for stochastic calculation comparing close to high-low range
Stochastic Smooth: Default: 3 | Range: 1+ | Smoothing period applied to raw stochastic value to reduce noise and false signals
Volume Settings
Volume MA Length: Default: 20 | Range: 1+ | Moving average period used to calculate average volume for comparison with current volume
Volume Trend Length: Default: 20 | Range: 5+ | Period for calculating cumulative directional volume flow trend
ATR and Volatility Settings
ATR Length: Default: 14 | Range: 1+ | Period for Average True Range calculation used in ATR Percentile metric
ATR Percentile Lookback: Default: 100 | Range: 20+ | Historical range used to determine current ATR position as percentile
Volatility Rank Lookback (Days): Default: 252 | Range: 50+ | Extended lookback period for Volatility Rank metric using close-to-close volatility
Momentum and Trend Settings
Momentum Length: Default: 10 | Range: 1+ | Lookback period for rate of change calculation in Momentum metric
Trend Strength Length: Default: 20 | Range: 5+ | Period for directional movement calculations in ADX-style Trend Strength metric
Advanced Metric Settings
MFI Length: Default: 14 | Range: 1+ | Lookback period for Money Flow Index calculation combining price and volume
CCI Length: Default: 20 | Range: 1+ | Period for Commodity Channel Index statistical deviation calculation
Williams %R Length: Default: 14 | Range: 1+ | Lookback period for Williams %R high-low range analysis
Choppiness Index Length: Default: 14 | Range: 5+ | Period for calculating market choppiness versus trending behavior
Price Distance MA Length: Default: 50 | Range: 10+ | Moving average period used for Price Distance standard deviation calculation
Visual Customization
Position: Default: Top Right | Options: Top Left, Top Right, Bottom Left, Bottom Right, Middle Right | Controls gauge placement on chart for optimal workspace organization
Size: Default: Normal | Options: Small, Normal, Large | Adjusts overall gauge dimensions and text size for different monitor resolutions and preferences
Low Zone Color (0-40): Default: Green (#00FF00) | Customize color for low/oversold zone of gauge arc
Medium Zone Color (40-70): Default: Yellow (#FFFF00) | Customize color for neutral/medium zone of gauge arc
High Zone Color (70-100): Default: Red (#FF0000) | Customize color for high/overbought zone of gauge arc
Background Color: Default: Semi-transparent dark gray | Customize gauge background for contrast and chart integration
Text Color: Default: White (#FFFFFF) | Customize all text elements including title, value, and scale labels
✅ Best Use Cases
Quick visual assessment of market conditions when you need instant feedback on whether an asset is in extreme territory across multiple analytical dimensions
Workspace organization for traders who monitor multiple indicators but want to reduce chart clutter and visual complexity
Metric comparison by switching between different indicators while maintaining consistent visual interpretation through the 0-100 normalization
Overbought/oversold identification using RSI, Stochastic, Williams %R, or MFI depending on whether you prefer price-only or volume-weighted analysis
Volume analysis through Volume %, Volume Trend, or MFI to confirm price movements with corresponding volume characteristics
Volatility monitoring using ATR Percentile or Volatility Rank to identify expansion/contraction cycles and adjust position sizing
Trend vs range identification by comparing Trend Strength (high values = trending) against Choppiness Index (high values = ranging)
Statistical over-extension detection using CCI or Price Distance to identify when price has deviated significantly from normal behavior
Multi-timeframe analysis by duplicating the gauge on different timeframe charts to compare metric readings across time horizons
Educational purposes for new traders learning to interpret technical indicators through consistent visual representation
⚠️ Limitations
The gauge displays only one metric at a time, requiring manual switching to compare different indicators rather than simultaneous multi-metric viewing
The 0-100 normalization, while providing consistency, may obscure the raw values and specific nuances of each underlying indicator
Table-based visualization cannot be exported or saved as an image separately from the full chart screenshot
Optimal parameter settings vary by asset type, timeframe, and market conditions, requiring user experimentation for best results
💡 What Makes This Unique
Unified Multi-Metric Interface: The only gauge-style indicator offering 13 distinct metrics through a single interface, eliminating the need for multiple oscillator panels
Non-Overlapping Analytics: Each metric provides genuinely unique insights—MFI combines volume with price, CCI measures statistical deviation, Volatility Rank uses extended lookback, Trend Strength quantifies directional movement, and Choppiness Index measures ranging behavior
Universal Normalization System: All metrics standardized to 0-100 scale using indicator-appropriate algorithms that preserve statistical meaning while enabling consistent visual interpretation
Professional Visual Design: Semi-circular gauge with 21 arc segments, precision needle positioning, color-coded zones, and clean table implementation that maintains clarity across all chart configurations
Extensive Customization: Independent parameter controls for each metric, five position options, three size presets, and full color customization for seamless workspace integration
🔬 How It Works
1. Metric Calculation Phase:
All 13 metrics are calculated simultaneously on every bar using their respective algorithms with user-defined parameters
Each metric applies its own specific calculation method—RSI uses average gains vs losses, Stochastic compares close to high-low range, MFI incorporates typical price and volume, CCI measures deviation from statistical mean, ATR calculates true range, directional indicators measure up/down movement, and statistical metrics analyze price relationships
2. Normalization Process:
Each calculated metric is converted to a standardized 0-100 scale using indicator-appropriate transformations
Some metrics are naturally 0-100 (RSI, Stochastic, MFI, Williams %R), while others require scaling—CCI transforms from ±200 range, Momentum centers around 50, Volume ratio caps at 2x for 100, ATR and Volatility Rank calculate percentile positions, and Price Distance scales by standard deviations
3. Gauge Rendering:
The selected metric’s normalized value determines the needle position across 21 arc segments spanning 0-100
Each arc segment receives its color based on position—segments 0-8 are green zone, segments 9-14 are yellow zone, segments 15-20 are red zone
The needle indicator (▼) appears in row 5 at the column corresponding to the current metric value, providing precise visual feedback
4. Table Construction:
The gauge uses TradingView’s table system with merged cells for title and value display, ensuring consistent positioning regardless of chart configuration
Rows are allocated as follows: Row 0 merged for title, Row 1 merged for large value display, Row 2 for spacing, Rows 3-4 for the semi-circular arc with curved shaping, Row 5 for needle indicator, Row 6 for scale markers, Row 7 for numerical labels at 0/25/50/75/100
All visual elements update on every bar when barstate.islast is true, ensuring real-time accuracy without performance impact
💡 Note:
This indicator is designed for visual analysis and market condition assessment, not as a standalone trading system. For best results, combine gauge readings with price action analysis, support and resistance levels, and broader market context. Parameter optimization is recommended based on your specific trading timeframe and asset class. The gauge works on all timeframes but may require different parameter settings for intraday versus daily/weekly analysis. Consider using multiple instances of the gauge set to different metrics for comprehensive market analysis without switching between settings.

Stochastic Enhanced [DCAUT]█ Stochastic Enhanced
📊 ORIGINALITY & INNOVATION
The Stochastic Enhanced indicator builds upon George Lane's classic momentum oscillator (developed in the late 1950s) by providing comprehensive smoothing algorithm flexibility. While traditional implementations limit users to Simple Moving Average (SMA) smoothing, this enhanced version offers 21 advanced smoothing algorithms, allowing traders to optimize the indicator's characteristics for different market conditions and trading styles.
Key Improvements:
Extended from single SMA smoothing to 21 professional-grade algorithms including adaptive filters (KAMA, FRAMA), zero-lag methods (ZLEMA, T3), and advanced digital filters (Kalman, Laguerre)
Maintains backward compatibility with traditional Stochastic calculations through SMA default setting
Unified smoothing algorithm applies to both %K and %D lines for consistent signal processing characteristics
Enhanced visual feedback with clear color distinction and background fill highlighting for intuitive signal recognition
Comprehensive alert system covering crossovers and zone entries for systematic trade management
Differentiation from Traditional Stochastic:
Traditional Stochastic indicators use fixed SMA smoothing, which introduces consistent lag regardless of market volatility. This enhanced version addresses the limitation by offering adaptive algorithms that adjust to market conditions (KAMA, FRAMA), reduce lag without sacrificing smoothness (ZLEMA, T3, HMA), or provide superior noise filtering (Kalman Filter, Laguerre filters). The flexibility helps traders balance responsiveness and stability according to their specific needs.
📐 MATHEMATICAL FOUNDATION
Core Stochastic Calculation:
The Stochastic Oscillator measures the position of the current close relative to the high-low range over a specified period:
Step 1: Raw %K Calculation
%K_raw = 100 × (Close - Lowest Low) / (Highest High - Lowest Low)
Where:
Close = Current closing price
Lowest Low = Lowest low over the %K Length period
Highest High = Highest high over the %K Length period
Result ranges from 0 (close at period low) to 100 (close at period high)
Step 2: Smoothed %K Calculation
%K = MA(%K_raw, K Smoothing Period, MA Type)
Where:
MA = Selected moving average algorithm (SMA, EMA, etc.)
K Smoothing = 1 for Fast Stochastic, 3+ for Slow Stochastic
Traditional Fast Stochastic uses %K_raw directly without smoothing
Step 3: Signal Line %D Calculation
%D = MA(%K, D Smoothing Period, MA Type)
Where:
%D acts as a signal line and moving average of %K
D Smoothing typically set to 3 periods in traditional implementations
Both %K and %D use the same MA algorithm for consistent behavior
Available Smoothing Algorithms (21 Options):
Standard Moving Averages:
SMA (Simple): Equal-weighted average, traditional default, consistent lag characteristics
EMA (Exponential): Recent price emphasis, faster response to changes, exponential decay weighting
RMA (Rolling/Wilder's): Smoothed average used in RSI, less reactive than EMA
WMA (Weighted): Linear weighting favoring recent data, moderate responsiveness
VWMA (Volume-Weighted): Incorporates volume data, reflects market participation intensity
Advanced Moving Averages:
HMA (Hull): Reduced lag with smoothness, uses weighted moving averages and square root period
ALMA (Arnaud Legoux): Gaussian distribution weighting, minimal lag with good noise reduction
LSMA (Least Squares): Linear regression based, fits trend line to data points
DEMA (Double Exponential): Reduced lag compared to EMA, uses double smoothing technique
TEMA (Triple Exponential): Further lag reduction, triple smoothing with lag compensation
ZLEMA (Zero-Lag Exponential): Lag elimination attempt using error correction, very responsive
TMA (Triangular): Double-smoothed SMA, very smooth but slower response
Adaptive & Intelligent Filters:
T3 (Tilson T3): Six-pass exponential smoothing with volume factor adjustment, excellent smoothness
FRAMA (Fractal Adaptive): Adapts to market fractal dimension, faster in trends, slower in ranges
KAMA (Kaufman Adaptive): Efficiency ratio based adaptation, responds to volatility changes
McGinley Dynamic: Self-adjusting mechanism following price more accurately, reduced whipsaws
Kalman Filter: Optimal estimation algorithm from aerospace engineering, dynamic noise filtering
Advanced Digital Filters:
Ultimate Smoother: Advanced digital filter design, superior noise rejection with minimal lag
Laguerre Filter: Time-domain filter with N-order implementation, adjustable lag characteristics
Laguerre Binomial Filter: 6-pole Laguerre filter, extremely smooth output for long-term analysis
Super Smoother: Butterworth filter implementation, removes high-frequency noise effectively
📊 COMPREHENSIVE SIGNAL ANALYSIS
Absolute Level Interpretation (%K Line):
%K Above 80: Overbought condition, price near period high, potential reversal or pullback zone, caution for new long entries
%K in 70-80 Range: Strong upward momentum, bullish trend confirmation, uptrend likely continuing
%K in 50-70 Range: Moderate bullish momentum, neutral to positive outlook, consolidation or mild uptrend
%K in 30-50 Range: Moderate bearish momentum, neutral to negative outlook, consolidation or mild downtrend
%K in 20-30 Range: Strong downward momentum, bearish trend confirmation, downtrend likely continuing
%K Below 20: Oversold condition, price near period low, potential bounce or reversal zone, caution for new short entries
Crossover Signal Analysis:
%K Crosses Above %D (Bullish Cross): Momentum shifting bullish, faster line overtakes slower signal, consider long entry especially in oversold zone, strongest when occurring below 20 level
%K Crosses Below %D (Bearish Cross): Momentum shifting bearish, faster line falls below slower signal, consider short entry especially in overbought zone, strongest when occurring above 80 level
Crossover in Midrange (40-60): Less reliable signals, often in choppy sideways markets, require additional confirmation from trend or volume analysis
Multiple Failed Crosses: Indicates ranging market or choppy conditions, reduce position sizes or avoid trading until clear directional move
Advanced Divergence Patterns (%K Line vs Price):
Bullish Divergence: Price makes lower low while %K makes higher low, indicates weakening bearish momentum, potential trend reversal upward, more reliable when %K in oversold zone
Bearish Divergence: Price makes higher high while %K makes lower high, indicates weakening bullish momentum, potential trend reversal downward, more reliable when %K in overbought zone
Hidden Bullish Divergence: Price makes higher low while %K makes lower low, indicates trend continuation in uptrend, bullish trend strength confirmation
Hidden Bearish Divergence: Price makes lower high while %K makes higher high, indicates trend continuation in downtrend, bearish trend strength confirmation
Momentum Strength Analysis (%K Line Slope):
Steep %K Slope: Rapid momentum change, strong directional conviction, potential for extended moves but also increased reversal risk
Gradual %K Slope: Steady momentum development, sustainable trends more likely, lower probability of sharp reversals
Flat or Horizontal %K: Momentum stalling, potential reversal or consolidation ahead, wait for directional break before committing
%K Oscillation Within Range: Indicates ranging market, sideways price action, better suited for range-trading strategies than trend following
🎯 STRATEGIC APPLICATIONS
Mean Reversion Strategy (Range-Bound Markets):
Identify ranging market conditions using price action or Bollinger Bands
Wait for Stochastic to reach extreme zones (above 80 for overbought, below 20 for oversold)
Enter counter-trend position when %K crosses %D in extreme zone (sell on bearish cross above 80, buy on bullish cross below 20)
Set profit targets near opposite extreme or midline (50 level)
Use tight stop-loss above recent swing high/low to protect against breakout scenarios
Exit when Stochastic reaches opposite extreme or %K crosses %D in opposite direction
Trend Following with Momentum Confirmation:
Identify primary trend direction using higher timeframe analysis or moving averages
Wait for Stochastic pullback to oversold zone (<20) in uptrend or overbought zone (>80) in downtrend
Enter in trend direction when %K crosses %D confirming momentum shift (bullish cross in uptrend, bearish cross in downtrend)
Use wider stops to accommodate normal trend volatility
Add to position on subsequent pullbacks showing similar Stochastic pattern
Exit when Stochastic shows opposite extreme with failed cross or bearish/bullish divergence
Divergence-Based Reversal Strategy:
Scan for divergence between price and Stochastic at swing highs/lows
Confirm divergence with at least two price pivots showing divergent Stochastic readings
Wait for %K to cross %D in direction of anticipated reversal as entry trigger
Enter position in divergence direction with stop beyond recent swing extreme
Target profit at key support/resistance levels or Fibonacci retracements
Scale out as Stochastic reaches opposite extreme zone
Multi-Timeframe Momentum Alignment:
Analyze Stochastic on higher timeframe (4H or Daily) for primary trend bias
Switch to lower timeframe (1H or 15M) for precise entry timing
Only take trades where lower timeframe Stochastic signal aligns with higher timeframe momentum direction
Higher timeframe Stochastic in bullish zone (>50) = only take long entries on lower timeframe
Higher timeframe Stochastic in bearish zone (<50) = only take short entries on lower timeframe
Exit when lower timeframe shows counter-signal or higher timeframe momentum reverses
Zone Transition Strategy:
Monitor Stochastic for transitions between zones (oversold to neutral, neutral to overbought, etc.)
Enter long when Stochastic crosses above 20 (exiting oversold), signaling momentum shift from bearish to neutral/bullish
Enter short when Stochastic crosses below 80 (exiting overbought), signaling momentum shift from bullish to neutral/bearish
Use zone midpoint (50) as dynamic support/resistance for position management
Trail stops as Stochastic advances through favorable zones
Exit when Stochastic fails to maintain momentum and reverses back into prior zone
📋 DETAILED PARAMETER CONFIGURATION
%K Length (Default: 14):
Lower Values (5-9): Highly sensitive to price changes, generates more frequent signals, increased false signals in choppy markets, suitable for very short-term trading and scalping
Standard Values (10-14): Balanced sensitivity and reliability, traditional default (14) widely used,适合 swing trading and intraday strategies
Higher Values (15-21): Reduced sensitivity, smoother oscillations, fewer but potentially more reliable signals, better for position trading and lower timeframe noise reduction
Very High Values (21+): Slow response, long-term momentum measurement, fewer trading signals, suitable for weekly or monthly analysis
%K Smoothing (Default: 3):
Value 1: Fast Stochastic, uses raw %K calculation without additional smoothing, most responsive to price changes, generates earliest signals with higher noise
Value 3: Slow Stochastic (default), traditional smoothing level, reduces false signals while maintaining good responsiveness, widely accepted standard
Values 5-7: Very slow response, extremely smooth oscillations, significantly reduced whipsaws but delayed entry/exit timing
Recommendation: Default value 3 suits most trading scenarios, active short-term traders may use 1, conservative long-term positions use 5+
%D Smoothing (Default: 3):
Lower Values (1-2): Signal line closely follows %K, frequent crossover signals, useful for active trading but requires strict filtering
Standard Value (3): Traditional setting providing balanced signal line behavior, optimal for most trading applications
Higher Values (4-7): Smoother signal line, fewer crossover signals, reduced whipsaws but slower confirmation, better for trend trading
Very High Values (8+): Signal line becomes slow-moving reference, crossovers rare and highly significant, suitable for long-term position changes only
Smoothing Type Algorithm Selection:
For Trending Markets:
ZLEMA, DEMA, TEMA: Reduced lag for faster trend entry, quick response to momentum shifts, suitable for strong directional moves
HMA, ALMA: Good balance of smoothness and responsiveness, effective for clean trend following without excessive noise
EMA: Classic choice for trending markets, faster than SMA while maintaining reasonable stability
For Ranging/Choppy Markets:
Kalman Filter, Super Smoother: Superior noise filtering, reduces false signals in sideways action, helps identify genuine reversal points
Laguerre Filters: Smooth oscillations with adjustable lag, excellent for mean reversion strategies in ranges
T3, TMA: Very smooth output, filters out market noise effectively, clearer extreme zone identification
For Adaptive Market Conditions:
KAMA: Automatically adjusts to market efficiency, fast in trends and slow in congestion, reduces whipsaws during transitions
FRAMA: Adapts to fractal market structure, responsive during directional moves, conservative during uncertainty
McGinley Dynamic: Self-adjusting smoothing, follows price naturally, minimizes lag in trending markets while filtering noise in ranges
For Conservative Long-Term Analysis:
SMA: Traditional choice, predictable behavior, widely understood characteristics
RMA (Wilder's): Smooth oscillations, reduced sensitivity to outliers, consistent behavior across market conditions
Laguerre Binomial Filter: Extremely smooth output, ideal for weekly/monthly timeframe analysis, eliminates short-term noise completely
Source Selection:
Close (Default): Standard choice using closing prices, most common and widely tested
HLC3 or OHLC4: Incorporates more price information, reduces impact of sudden spikes or gaps, smoother oscillator behavior
HL2: Midpoint of high-low range, emphasizes intrabar volatility, useful for markets with wide intraday ranges
Custom Source: Can use other indicators as input (e.g., Heikin Ashi close, smoothed price), creates derivative momentum indicators
📈 PERFORMANCE ANALYSIS & COMPETITIVE ADVANTAGES
Responsiveness Characteristics:
Traditional SMA-Based Stochastic:
Fixed lag regardless of market conditions, consistent delay of approximately (K Smoothing + D Smoothing) / 2 periods
Equal treatment of trending and ranging markets, no adaptation to volatility changes
Predictable behavior but suboptimal in varying market regimes
Enhanced Version with Adaptive Algorithms:
KAMA and FRAMA reduce lag by up to 40-60% in strong trends compared to SMA while maintaining similar smoothness in ranges
ZLEMA and T3 provide near-zero lag characteristics for early entry signals with acceptable noise levels
Kalman Filter and Super Smoother offer superior noise rejection, reducing false signals in choppy conditions by estimations of 30-50% compared to SMA
Performance improvements vary by algorithm selection and market conditions
Signal Quality Improvements:
Adaptive algorithms help reduce whipsaw trades in ranging markets by adjusting sensitivity dynamically
Advanced filters (Kalman, Laguerre, Super Smoother) provide clearer extreme zone readings for mean reversion strategies
Zero-lag methods (ZLEMA, DEMA, TEMA) generate earlier crossover signals in trending markets for improved entry timing
Smoother algorithms (T3, Laguerre Binomial) reduce false extreme zone touches for more reliable overbought/oversold signals
Comparison with Standard Implementations:
Versus Basic Stochastic: Enhanced version offers 21 smoothing options versus single SMA, allowing optimization for specific market characteristics and trading styles
Versus RSI: Stochastic provides range-bound measurement (0-100) with clear extreme zones, RSI measures momentum speed, Stochastic offers clearer visual overbought/oversold identification
Versus MACD: Stochastic bounded oscillator suitable for mean reversion, MACD unbounded indicator better for trend strength, Stochastic excels in range-bound and oscillating markets
Versus CCI: Stochastic has fixed bounds (0-100) for consistent interpretation, CCI unbounded with variable extremes, Stochastic provides more standardized extreme readings across different instruments
Flexibility Advantages:
Single indicator adaptable to multiple strategies through algorithm selection rather than requiring different indicator variants
Ability to optimize smoothing characteristics for specific instruments (e.g., smoother for crypto volatility, faster for forex trends)
Multi-timeframe analysis with consistent algorithm across timeframes for coherent momentum picture
Backtesting capability with algorithm as optimization parameter for strategy development
Limitations and Considerations:
Increased complexity from multiple algorithm choices may lead to over-optimization if parameters are curve-fitted to historical data
Adaptive algorithms (KAMA, FRAMA) have adjustment periods during market regime changes where signals may be less reliable
Zero-lag algorithms sacrifice some smoothness for responsiveness, potentially increasing noise sensitivity in very choppy conditions
Performance characteristics vary significantly across algorithms, requiring understanding and testing before live implementation
Like all oscillators, Stochastic can remain in extreme zones for extended periods during strong trends, generating premature reversal signals
USAGE NOTES
This indicator is designed for technical analysis and educational purposes to provide traders with enhanced flexibility in momentum analysis. The Stochastic Oscillator has limitations and should not be used as the sole basis for trading decisions.
Important Considerations:
Algorithm performance varies with market conditions - no single smoothing method is optimal for all scenarios
Extreme zone signals (overbought/oversold) indicate potential reversal areas but not guaranteed turning points, especially in strong trends
Crossover signals may generate false entries during sideways choppy markets regardless of smoothing algorithm
Divergence patterns require confirmation from price action or additional indicators before trading
Past indicator characteristics and backtested results do not guarantee future performance
Always combine Stochastic analysis with proper risk management, position sizing, and multi-indicator confirmation
Test selected algorithm on historical data of specific instrument and timeframe before live trading
Market regime changes may require algorithm adjustment for optimal performance
The enhanced smoothing options are intended to provide tools for optimizing the indicator's behavior to match individual trading styles and market characteristics, not to create a perfect predictive tool. Responsible usage includes understanding the mathematical properties of selected algorithms and their appropriate application contexts.

AI Trading Alerts v6 — SL/TP + Confidence + Panel (Fixed)Overview
This Pine Script is designed to identify high-probability trading opportunities in Forex, commodities, and crypto markets. It combines EMA trend filters, RSI, and Stochastic RSI, with automatic stop-loss (SL) & take-profit (TP) suggestions, and provides a confidence panel to quickly assess the trade setup strength.
It also includes TradingView alert conditions so you can set up notifications for Long/Short setups and EMA crosses.
⚙️ Features
EMA Trend Filter
Uses EMA 50, 100, 200 for trend confirmation.
Bull trend = EMA50 > EMA100 > EMA200
Bear trend = EMA50 < EMA100 < EMA200
RSI Filter
Bullish trades require RSI > 50
Bearish trades require RSI < 50
Stochastic RSI Filter
Prevents entries during overbought/oversold extremes.
Bullish entry only if %K and %D < 80
Bearish entry only if %K and %D > 20
EMA Proximity Check
Price must be near EMA50 (within ATR × adjustable multiplier).
Signals
Continuation Signals:
Long if all bullish conditions align.
Short if all bearish conditions align.
Cross Events:
Long Cross when price crosses above EMA50 in bull trend.
Short Cross when price crosses below EMA50 in bear trend.
Automatic SL/TP Suggestions
SL size adjusts depending on asset:
Gold/Silver (XAU/XAG): 5 pts
Bitcoin/Ethereum: 100 pts
FX pairs (default): 20 pts
TP = SL × Risk:Reward ratio (default 1:2).
Confidence Score (0–4)
Based on conditions met (trend, RSI, Stoch, EMA proximity).
Labels:
Strongest (4/4)
Strong (3/4)
Medium (2/4)
Low (1/4)
Visual Panel on Chart
Shows ✅/❌ for each condition (trend, RSI, Stoch, EMA proximity, signal now).
Confidence row with color-coded strength.
Alerts
Long Setup
Short Setup
Long Cross
Short Cross
🖥️ How to Use
1. Add the Script
Open TradingView → Pine Editor.
Paste the full script.
Click Add to chart.
Save as "AI Trading Alerts v6 — SL/TP + Confidence + Panel".
2. Configure Inputs
EMA Lengths: Default 50/100/200 (works well for swing trading).
RSI Length: 14 (standard).
Stochastic Length/K/D: Default 14/3/3.
Risk:Reward Ratio: Default 2.0 (can change to 1.5, 3.0, etc.).
EMA Proximity Threshold: Default 0.20 × ATR (adjust to be stricter/looser).
3. Read the Panel
Top-right of chart, you’ll see ✅ or ❌ for:
Trend → Are EMAs aligned?
RSI → Above 50 (bull) or below 50 (bear)?
Stoch OK → Not extreme?
Near EMA50 → Close enough to EMA50?
Above/Below OK → Price position vs. EMA50 matches trend?
Signal Now → Entry triggered?
Confidence row:
🟢 Green = Strongest
🟩 Light green = Strong
🟧 Orange = Medium
🟨 Yellow = Low
⬜ Gray = None
4. Alerts Setup
Go to TradingView Alerts (⏰ icon).
Choose the script under “Condition”.
Select alert type:
Long Setup
Short Setup
Long Cross
Short Cross
Set notification method (popup, sound, email, mobile).
Click Create.
Now TradingView will notify you automatically when signals appear.
5. Example Workflow
Wait for Confidence = Strong/Strongest.
Check if market session supports volatility (e.g., XAU in London/NY).
Review SL/TP suggestions:
Long → Entry: current price, SL: close - risk_pts, TP: close + risk_pts × RR.
Short → Entry: current price, SL: close + risk_pts, TP: close - risk_pts × RR.
Adjust based on your own price action analysis.
📊 Best Practices
Use on H1 + D1 combo → align higher timeframe bias with intraday entries.
Risk only 1–2% of account per trade (position sizing required).
Filter with market sessions (Asia, Europe, US).
Strongest signals work best with trending pairs (e.g., XAUUSD, USDJPY, BTCUSD).

MAxRSI Signals [KedArc Quant]Description:
MAxRSI Indicator Marks LONG/SHORT signals from a Moving Average crossover and (optionally) confirms them with RSI. Includes repaint-safe confirmation, optional higher-timeframe (HTF) smoothing, bar coloring, and alert conditions.
Why combine MA + RSI
* The MA crossover is the primary trend signal (fast trend vs slow trend).
* RSI is a gate, not a second, separate signal. A crossover only becomes a trade signal if momentum agrees (e.g., RSI ≥ level for LONG, ≤ level for SHORT). This reduces weak crosses in ranging markets.
* The parts are integrated in one rule: *Crossover AND RSI condition (if enabled)* → plot signal/alert. No duplicated outputs or unrelated indicators.
How it works (logic)
* MA types: SMA / EMA / WMA / HMA (HMA is built via WMA of `len/2` and `len`, then WMA with `sqrt(len)`).
* Signals:
* LONG when *Fast MA crosses above Slow MA* and (if enabled) *RSI ≥ Long Min*.
* SHORT when *Fast MA crosses below Slow MA* and (if enabled) *RSI ≤ Short Max*.
* Repaint-safe (optional): confirms crosses on closed bars to avoid intrabar repaint.
* HTF (optional): computes MA/RSI on a higher timeframe to smooth noise on lower charts.
* Alerts: crossover alerts + state-flip (bull↔bear) alerts.
How to use (step-by-step)
1. Add to chart. Set MA Type, Fast and Slow (keep Fast < Slow).
2. Turn Use RSI Filter ON for confirmation (default: RSI 14 with 50/50 levels).
3. (Optional) Turn Repaint-Safe ON for close-confirmed signals.
4. (Optional) Turn HTF ON (e.g., 60 = 1h) for smoother signals on low TFs.
5. Enable alerts: pick “MAxRSI Long/Short” or “Bullish/Bearish State”.
Timeframe guidance
* Intraday (1–15m): EMA 9–20 fast vs EMA 50 slow, RSI filter at 50/50.
* Swing (1h–D): EMA 20 fast vs EMA 200 slow, RSI 50/50 (55/45 for stricter).
What makes it original
* Repaint-safe cross confirmation (previous-bar check) for reliable signals/alerts.
* HTF gating (doesn’t compute both branches) for speed and clarity.
* Warning-free MA helper (precomputes SMA/EMA/WMA/HMA each bar), HMA built from built-ins only.
* State-flip alerts and optional RSI overlay on price pane.
Built-ins used
`ta.sma`, `ta.ema`, `ta.wma`, (HMA built from these), `ta.rsi`, `ta.crossover`, `ta.crossunder`, `request.security`, `plot`, `plotshape`, `barcolor`, `alertcondition`, `input.*`, `math.*`.
Note: Indicator only (no orders). Test settings per symbol. Not financial advice.
⚠️ Disclaimer
This script is provided for educational purposes only.
Past performance does not guarantee future results.
Trading involves risk, and users should exercise caution and use proper risk management when applying this strategy.

CCI Stochastic - YOSI
CCI Stochastic (Pro v6) – MTF, Adaptive Bands & Live Label
What it does
This indicator applies a Stochastic calculation on the CCI (K/D lines) to highlight momentum shifts, overbought/oversold zones, and adaptive market regimes. It comes with optional higher-timeframe confirmation, adaptive volatility bands, a live value label, and built-in alerts.
Key Features
Core Signal: Choose between D or K line of the Stoch-CCI.
Extreme Zones: Customizable OB/OS thresholds (default 80/20) and a midline (50), with dynamic background shading.
Adaptive Bands (optional): Mean ± k·standard deviation of the signal, to capture cyclic extremes.
MTF Confirmation (optional): Fetches the same signal from a higher timeframe via request.security.
Arrows/Signals:
Enter – Cross above OS (Buy) / below OB (Sell).
Center – Cross of the 50 midline (momentum shift).
Exit – Exit from extreme zones.
Alerts: All arrow signals + adaptive band crosses.
Live Value Label: Shows the latest signal value near the last bar, customizable decimals/offset/background colors.
Visuals: Red line above OB, green below OS, gray neutral; adaptive band fills.
Use Cases
Momentum / Reversals: Enter with OS/OB crosses confirmed by MTF.
Trend validation: Combine with moving averages (e.g., EMA200) or support/resistance.
Mean Reversion: Fade extreme zones, especially with adaptive band or OB/OS exit alerts.
Inputs
CCI Period, Stoch Period, Smooth K/D – core calculation.
Overbought / Oversold – thresholds (default 80/20).
Line to plot – K or D.
Show Arrows (Enter, Center, Exit) – visual control.
Adaptive Bands – length and k multiplier.
Higher TF – optional confirmation timeframe.
Live Label – decimals, offset, colors.
Quick Tips
For scalping/short-term setups: tighten OB/OS (e.g., 85/15) to filter noise.
In high volatility: increase adaptLen or decrease k to smooth bands.
Reduce false signals: require local + MTF alignment (e.g., only long if MTF > 50).
Disclaimer
This is a technical analysis tool – not a standalone buy/sell signal. Always use with proper risk management, key levels, and confluence from multiple factors.
מה זה עושה?
האינדיקטור מחשב Stochastic על CCI (קו K/D) ומציג אזורי קיצון, חציות ומשטרי שוק. הוא כולל אופציה לאישור מטיימפריים גבוה, בנדים אדפטיביים, תווית ערך חיה והתרעות מוכנות.
יכולות עיקריות
סיגנל מרכזי: בחירה בין קו D או K של Stoch-CCI.
אזורי קיצון: קווים ניתנים להגדרה (ברירת מחדל 80/20) וקו אמצע 50, עם צביעת רקע דינמית כשנכנסים לקיצון.
Adaptive Bands (אופציונלי): ממוצע ± k·סטיית תקן של הסיגנל—מסייע לזהות overheat ומחזוריות.
אישור MTF (אופציונלי): אותו סיגנל מטיימפריים גבוה באמצעות request.security.
חיצים/סיגנלים:
Enter – חציה מלמטה מעל OS (קנייה) / מלמעלה מתחת OB (מכירה).
Center – חציה של 50 (שינוי מומנטום).
Exit – יציאה מאזורים קיצוניים (OS/OB).
Alerts: לכל הסיגנלים לעיל + כניסה/יציאה לבנדים האדפטיביים.
תווית ערך חיה: מציגה את ערך הסיגנל האחרון ליד הנקודה (ספרות ו־offset ניתנים להגדרה).
עיצוב קריא: צבע קו אדום מעל OB, ירוק מתחת OS, אפור ניטרלי; מילוי אזורים.
שימוש מומלץ
מומנטום/היפוכים: כניסה עם חציה מה-OS/OB ואישור מה-MTF.
ממוצע נע/רמות מחיר: חברו לאימות מגמה (למשל EMA200 או תמיכה/התנגדות).
Mean Reversion: חיפוש חזרה מאזורי קיצון, במיוחד כשיש התרעת יציאה מ-OB/OS או נגיעה בבנד אדפטיבי.
קלטים מרכזיים
CCI Period, Stoch Period, Smooth K/D – פרמטרי חישוב.
Overbought / Oversold – ספי קיצון (ברירת מחדל 80/20).
Line to plot – בחירה בין K או D.
Show Arrows/Center/Exit/Enter – שליטה בתצוגת החיצים.
Adaptive Bands (len, k) – חלון ורגישות לבנדים.
Higher TF – טיימפריים לאישור (אופציונלי).
Live Label – ספרות, היסט ברים, צבעי רקע.
טיפים מהירים
בסקלפים/טווחים קצרים: הקשיחו ספי קיצון (למשל 85/15) להפחתת רעש.
בשוק תנודתי: העלו את adaptLen או הורידו את k כדי לקבל בנדים רגישים פחות.
להקטנת אותות שווא: דרשו התאמה בין הסיגנל המקומי ל-MTF (לדוגמה, לונג רק כשה-MTF מעל 50).
הערה חשובה
זהו כלי ניתוח טכני—לא אות קנייה/מכירה בפני עצמו. שלבו אותו עם ניהול סיכונים (SL/TP), בדיקת רמות מפתח ואימות ממספר אינדיקטורים או טיימפריימים.

RMA Smoothed RSIRMA Smoothed RSI
Description:
An enhanced RSI built for cleaner intraday and swing reads. It applies RMA smoothing to damp noise.
How It Works
RSI (RMA-Smoothed):
Computes classic RSI from price changes and smooths the result with an additional RMA (user-controlled 3–7, where 5 is the sweet spot). This reduces whipsaw while preserving shifts in momentum.
How to Interpret
50 Midline = Bias Filter: Above 50 favors strength; below 50 favors weakness.
RSI vs RSI-MA Crosses: Cross up can precede thrust or mean-revert toward 50; cross down the opposite.
Inputs
Length: RSI period (default 14).
Source: Price source for RSI (default Close).
Smoothing: RMA smoothing length on RSI (3–7; default 3; 5 sweet spot).
Calculate Divergence: Toggle to compute pivots/divergences and enable alerts.
Moving Average Type: None, SMA, EMA, WMA, VWMA (default EMA).
MA Length: Length of the RSI-based MA (separate from RSI length).
Best For
Traders who want a cleaner RSI read without losing responsiveness.
Scalpers timing momentum shifts around the 50 line and MA crosses.
Swing traders using divergences as early reversal context.
Pro Tips
For fast intraday charts, start with Length 14, Smoothing 3–5, and EMA as the RSI-MA.
Use 50 reclaims/rejections as a simple regime filter.
Combine divergence labels with volume surges, key S/R, or volatility tools (e.g., BBW/TTM squeeze) to time entries.
Divergence alerts fire only if Calculate Divergence is enabled—keep it on if you rely on signals.

TRAPPER TRENDLINES — PRICEDraws dynamic trendlines on price by connecting the two most recent confirmed swing points (highs to highs for resistance, lows to lows for support). Swings are defined with a symmetric left/right pivot window. Old anchors are ignored so lines stay attached to current structure. Optional break alerts are included.
How it works (plain language)
Pivots: A bar is a swing high (or low) only if it’s the most extreme point compared with a set number of bars on the left and the right.
Lines:
Support connects the last two confirmed swing lows.
Resistance connects the last two confirmed swing highs.
Lines can be extended right only or both left & right (toggle).
Recency filter: Only swings within the last N bars are kept. This avoids anchoring to very old pivots far from current price.
Alerts: Optional alerts fire when price closes above resistance or below support.
Inputs
Auto Settings
Auto pivot size by chart timeframe: When ON, the script picks a pivot size suitable for the current timeframe (you can scale it with Auto pivot multiplier). When OFF, the manual left/right inputs are used.
Auto pivot multiplier: Scales the auto pivot size (e.g., 1.5 makes pivots stricter).
Manual Pivots
Pivot Left / Pivot Right: Bars to the left/right required to confirm a swing. Example: Left=50 & Right=50 keeps only major swings.
Recency Filter
Use last N bars for pivots: Swings older than this window are discarded so trendlines stay relevant to current price.
Style
Support/Resistance color: Line colors.
Extend Left & Right: When ON, both endpoints extend; when OFF, lines extend to the right only.
Alerts
Enable Break Alerts: When ON, alert conditions are exposed:
Price: Break Up — close above resistance.
Price: Break Down — close below support.
Suggested settings
Higher timeframes (4H / 1D / 1W):
Manual: Pivot Left = 50, Pivot Right = 50, Use last N bars = 400–800.
Or enable Auto with Auto pivot multiplier = 1.0–1.5.
Intraday (15m / 30m / 1H):
Manual: Pivot Left = 30, Pivot Right = 30, Use last N bars = 300–500.
Or enable Auto with multiplier ≈ 1.0–1.2.
Pairing with RSI for confluence/divergence
This tool is designed to pair with a companion TRAPPER TRENDLINES — RSI (or any RSI trendline script):
To mirror swings, set RSI Pivot Lookback equal to the price Pivot Left/Right you use here.
Example: Price = 50/50 → RSI Pivot Lookback = 50.
Keep RSI at Length 14 with 70/30 channel for clarity.
Confluence: Price holds/rejects at a trendline while RSI trendline agrees.
Divergence: Price prints a higher high (resistance line rising) while RSI prints a lower high (RSI resistance line falling), or vice-versa for lows. Matching pivot windows makes these relationships clear and reduces false signals.
Reading the signals
Trendline touch/hold: Potential reaction area; wait for follow-through.
Break Up / Break Down (alerts): Close beyond the line. Consider retest behavior, higher-timeframe context, and volume/RSI confirmation.
Notes & limitations
Pivots require future bars to confirm (by design). Lines update as pivots confirm.
“Use last N bars” purposely ignores very old swings. Increase this value if you need legacy structure.
Lines are based on two most recent confirmed pivots per side; rapidly changing markets can replace anchors as new swings confirm.
This is a visual/analytical tool. No strategy entries/exits or performance claims are provided.
Compliance
This script is for educational purposes only and does not constitute financial advice. Trading involves risk. Past results do not guarantee future outcomes. No promises of profit, accuracy, or performance are made.
Alerts (titles/messages)
Price: Break Up — “Price broke above resistance trendline.”
Price: Break Down — “Price broke below support trendline.”
Quick start
Add the indicator to your chart.
Choose Auto or set Pivot Left/Right manually.
Set Use last N bars for how far back to consider swings.
Toggle Extend Left & Right to your preference.
(Optional) Add your RSI trendline indicator and match Pivot Lookback with your price pivot size for clean confluence/divergence.
Enable alerts if you want notifications on breaks.

buy sell ultra systemWhat it is
EMA-POC Momentum System Ultra combines a proven trend stack (EMA 20/50/238), a price-of-control layer (POC via Bar-POC or VWAP alternative), and a momentum trigger (RSI) to surface higher-quality entries only when multiple, independent conditions align. This is not a cosmetic mashup; each component gates the others.
How components work together
Trend (EMA 20/50/238): Defines short/medium/long bias and filters counter-trend signals.
POC (Bar-POC or Alt-POC/VWAP): Locates the most-traded/weighted price area; a neutral band around POC helps avoid chop.
Control background: Above POC → buyers likely in control; below → sellers.
Momentum (RSI): Entry arrows print only when RSI confirms with trend and price location vs POC; optional “cross 50” requirement reduces noise.
Optional HTF trend: Confluence with a higher-timeframe EMA stack for stricter filtering.
Why it’s original/useful
Signals require confluence of (1) EMA trend stack, (2) POC location and neutral-zone filtering, (3) momentum confirmation, (4) optional slope and distance-to-POC checks, and (5) optional HTF trend. This reduces false positives compared with using any layer in isolation.
How to use
Markets/TFs: Built for XAUUSD (Gold) and US30. Works 1m–1h for intraday; 2h–4h for swing.
Entries:
Long: EMA stack bullish, price above POC, not in neutral band, RSI condition true → “Buy” arrow.
Short: Opposite conditions → “Sell” arrow.
Stops/Targets (suggested):
Initial stop beyond POC/neutral band or recent swing.
First target around 1R; trail with EMA20/50 or structure breaks.
Settings to tune:
POC Mode: Bar-POC (highest-volume bar’s close over lookback) or Alt-POC (VWAP).
Neutral Band %: 0.10–0.35 typical intraday.
Min distance from POC: 0.10–0.50% helps avoid low-RR entries right at POC.
RSI: Choose “cross 50” for stricter triggers or simple >/< 50 for more signals.
HTF trend: Turn on for extra confluence.
Alerts:
Buy Signal and Sell Signal (separate), or one Combined Buy/Sell alert.
Set to “Once per bar close” if you want only confirmed arrows.
Repainting / limitations
Shapes can move until bar close (standard Pine behavior) when using intrabar conditions; final confirmation at close. No system guarantees profitability—forward test and adapt to your market/instrument.
Clean chart
The published chart contains only this script so outputs are easy to identify.
Versions / updates
Use Publish → Update for minor changes; do not create new publications for small tweaks. If you fork to preserve older behavior, explain why and how your fork differs.
Changelog
v1.1 – Tuning for Gold/US30, neutral-band & distance filters, optional HTF trend, combined alert.
v1.0 – Initial public release (EMA stack + POC modes + RSI + alerts).
License & credits
Open-source for learning and improvement. Please credit on forks and explain modifications in your description.

Dow Theory Indicator## 🎯 Key Features of the Indicator
### 📈 Complete Implementation of Dow Theory
- Three-tier trend structure: primary trend (50 periods), secondary trend (20 periods), and minor trend (10 periods).
- Swing point analysis: automatically detects critical swing highs and lows.
- Trend confirmation mechanism: strict confirmation logic based on consecutive higher highs/higher lows or lower highs/lower lows.
- Volume confirmation: ensures price moves are supported by trading volume.
### 🕐 Flexible Timeframe Parameters
All key parameters are adjustable, making it especially suitable for U.S. equities:
Trend analysis parameters:
- Primary trend period: 20–200 (default 50; recommended 50–100 for U.S. stocks).
- Secondary trend period: 10–100 (default 20; recommended 15–30 for U.S. stocks).
- Minor trend period: 5–50 (default 10; recommended 5–15 for U.S. stocks).
Dow Theory parameters:
- Swing high/low lookback: 5–50 (default 10).
- Trend confirmation bar count: 1–10 (default 3).
- Volume confirmation period: 10–100 (default 20).
### 🇺🇸 U.S. Market Optimizations
- Session awareness: distinguishes Regular Trading Hours (9:30–16:00 EST) from pre-market and after-hours.
- Pre/post-market weighting: adjustable weighting factor for signals during extended hours.
- Earnings season filter: automatically adjusts sensitivity during earnings periods.
- U.S.-optimized default parameters.
## 🎨 Visualization
1. Trend lines: three differently colored trend lines.
2. Background fill: green (uptrend) / red (downtrend) / gray (neutral).
3. Signal markers: arrows, labels, and warning icons.
4. Swing point markers: small triangles at key turning points.
5. Info panel: real-time display of eight key metrics.
## 🚨 Alert System
- Trend turning to up/down.
- Strong bullish/bearish signals (dual confirmation).
- Volume divergence warning.
- New swing high/low formed.
## 📋 How to Use
1. Open the Pine Editor in TradingView.
2. Copy the contents of dow_theory_indicator.pine.
3. Paste and click “Add to chart.”
4. Adjust parameters based on trading style:
- Long-term investing: increase all period parameters.
- Swing trading: use the default parameters.
- Short-term trading: decrease all period parameters.
## 💡 Parameter Tips for U.S. Stocks
- Large-cap blue chips (AAPL, MSFT): primary 60–80, secondary 25–30.
- Mid-cap growth stocks: primary 40–60, secondary 18–25.
- Small-cap high-volatility stocks: primary 30–50, secondary 15–20.

Smart Breadth [smartcanvas]Overview
This indicator is a market breadth analysis tool focused on the S&P 500 index. It visualizes the percentage of S&P 500 constituents trading above their 50-day and 200-day moving averages, integrates the McClellan Oscillator for advance-decline analysis, and detects various breadth-based signals such as thrusts, divergences, and trend changes. The indicator is displayed in a separate pane and provides visual cues, a summary label with tooltip, and alert conditions to highlight potential market conditions.
The tool uses data symbols like S5FI (percentage above 50-day MA), S5TH (percentage above 200-day MA), ADVN/DECN (S&P advances/declines), and optionally NYSE advances/declines for certain calculations. If primary data is unavailable, it falls back to calculated breadth from advance-decline ratios.
This indicator is intended for educational and analytical purposes to help users observe market internals. My intention was to pack in one indicator things you will only find in a few. It does not provide trading signals as financial advice, and users are encouraged to use it in conjunction with their own research and risk management strategies. No performance guarantees are implied, and historical patterns may not predict future market behavior.
Key Components and Visuals
Plotted Lines:
Aqua line: Percentage of S&P 500 stocks above their 50-day MA.
Purple line: Percentage of S&P 500 stocks above their 200-day MA.
Optional orange line (enabled via "Show Momentum Line"): 10-day momentum of the 50-day MA breadth, shifted by +50 for scaling.
Optional line plot (enabled via "Show McClellan Oscillator"): McClellan Oscillator, colored green when positive and red when negative. Can use actual scale or normalized to fit breadth percentages (0-100).
Horizontal Levels:
Dotted green at 70%: "Strong" level.
Dashed green at user-defined green threshold (default 60%): "Buy Zone".
Dashed yellow at user-defined yellow threshold (default 50%): "Neutral".
Dotted red at 30%: "Oversold" level.
Optional dotted lines for McClellan (when shown and not using actual scale): Overbought (red), Oversold (green), and Zero (gray), scaled to fit.
Background Coloring:
Green shades for bullish/strong bullish states.
Yellow for neutral.
Orange for caution.
Red for bearish.
Signal Shapes:
Rocket emoji (🚀) at bottom for Zweig Breadth Thrust trigger.
Green circle at bottom for recovery signal.
Red triangle down at top for negative divergence warning.
Green triangle up at bottom for positive divergence.
Light green triangle up at bottom for McClellan oversold bounce.
Green diamond at bottom for capitulation signal.
Summary Label (Right Side):
Displays current action (e.g., "BUY", "HOLD") with emoji, breadth percentages with colored circles, McClellan value with emoji, market state, risk/reward stars, and active signals.
Hover tooltip provides detailed breakdown: action priority, breadth metrics, McClellan status, momentum/trend, market state, active signals, data quality, thresholds, recent changes, and a general recommendation category.
Calculations and Logic
Breadth Percentages: Derived from S5FI/S5TH or calculated from advances/(advances + declines) * 100, with fallback adjustments.
McClellan Oscillator: Difference between fast (default 19) and slow (default 39) EMAs of net advances (advances - declines).
Momentum: 10-day change in 50-day MA breadth percentage.
Trend Analysis: Counts consecutive rising days in breadth to detect upward trends.
Breadth Thrust (Zweig): 10-day EMA of advances/total issues crossing from below a bottom level (default 40) to above a top level (default 61.5). Can use S&P or NYSE data.
Divergences: Compares S&P 500 price highs/lows with breadth or McClellan over a lookback period (default 20) to detect positive (bullish) or negative (bearish) divergences.
Market States: Determined by breadth levels relative to thresholds, trend direction, and McClellan conditions (e.g., strong bullish if above green threshold, rising, and McClellan supportive).
Actions: Prioritized logic (0-10) selects an action like "BUY" or "AVOID LONGS" based on signals, states, and conditions. Higher priority (e.g., capitulation at 10) overrides lower ones.
Alerts: Triggered on new occurrences of key conditions, such as breadth thrust, divergences, state changes, etc.
Input Parameters
The indicator offers customization through grouped inputs, but the use of defaults is encouraged.
Usage Notes
Add the indicator to a chart of any symbol (though designed around S&P 500 data; works best on daily or higher timeframes). Monitor the label and tooltip for a consolidated view of conditions. Set up alerts for specific events.
This script relies on external security requests, which may have data availability issues on certain exchanges or timeframes. The fallback mechanism ensures continuity but may differ slightly from primary sources.
Disclaimer
This indicator is provided for informational and educational purposes only. It does not constitute investment advice, financial recommendations, or an endorsement of any trading strategy. Market conditions can change rapidly, and users should not rely solely on this tool for decision-making. Always perform your own due diligence, consult with qualified professionals if needed, and be aware of the risks involved in trading. The author and TradingView are not responsible for any losses incurred from using this script.

Stochastic Ribbon & EMAsHere's a comprehensive description for publishing your indicator:
---
# **Stochastic Ribbon & EMAs**
A clean and powerful trading indicator that combines **Stochastic Support/Resistance levels** with **Essential Moving Averages** for comprehensive market analysis.
## **📊 What It Does**
This indicator provides **7 key reference lines** on your chart:
- **3 Stochastic levels** (20%, 50%, 80%) - Dynamic support/resistance zones
- **4 Essential EMAs** (20, 50, 100, 200) - Trend direction and momentum
## **🎯 Key Features**
### **Stochastic Ribbon (3 Yellow Lines)**
- **80% Line**: Dynamic resistance level - potential selling zone
- **50% Line**: Market equilibrium - trend direction reference
- **20% Line**: Dynamic support level - potential buying zone
- **Default 50-period lookback** for stable, reliable levels
- **All lines in yellow** for clean, consistent visualization
### **Essential EMAs (4 Colored Lines)**
- **20 EMA** (Purple): Short-term trend and entry timing
- **50 EMA** (Dark Cyan): Medium-term trend direction
- **100 EMA** (Rosy Brown): Long-term trend confirmation
- **200 EMA** (Brown): Major trend and institutional levels
## **📈 How to Use**
### **For Support & Resistance:**
- **Above 80% line**: Look for selling opportunities (overbought zone)
- **Between 50-80%**: Bullish bias, pullbacks to 50% line for entries
- **Around 50% line**: Key equilibrium - watch for direction
- **Between 20-50%**: Bearish bias, bounces to 50% line for exits
- **Below 20% line**: Look for buying opportunities (oversold zone)
### **For Trend Analysis:**
- **EMA Stack Order**: Higher timeframe EMAs above lower = uptrend
- **Price above all EMAs**: Strong bullish momentum
- **Price below all EMAs**: Strong bearish momentum
- **EMA as dynamic support/resistance**: Bounces and rejections
### **For Entry Signals:**
- **Confluence zones**: Where Stochastic levels meet EMA levels
- **Breakouts**: Price breaking through multiple levels simultaneously
- **Reversals**: Price rejection at extreme Stochastic levels with EMA confirmation
## **⚙️ Settings**
### **Stochastic Ribbon**
- **Show/Hide**: Toggle the 3 Stochastic lines
- **Length**: Period for high/low calculation (default: 50)
- **Start**: Multiplier for calculation (default: 1)
### **EMAs**
- **Individual toggles**: Show/hide each EMA separately
- **Custom periods**: Adjust each EMA length (defaults: 20, 50, 100, 200)
- **Custom colors**: Personalize each EMA color
## **🚀 Why This Indicator?**
✅ **Clean & Simple**: No cluttered charts - just essential levels
✅ **Multi-Timeframe**: Works on all timeframes from 1m to 1W
✅ **Versatile**: Suitable for scalping, day trading, and swing trading
✅ **Low Lag**: Dynamic levels that adapt to current market conditions
✅ **Proven Components**: Combines two well-established technical concepts
✅ **Customizable**: Adjust all parameters to fit your trading style
## **💡 Pro Tips**
- **Use multiple timeframes**: Check higher timeframe alignment for stronger signals
- **Combine with volume**: Look for volume confirmation at key levels
- **Watch for confluences**: Best signals occur where multiple levels align
- **Respect the 50% line**: Often acts as the most important level for trend direction
## **📋 Technical Details**
- **Version**: Pine Script v5
- **Overlay**: Yes (displays on main price chart)
- **Plots**: 7 total (well within Pine Script limits)
- **Performance**: Optimized for fast loading and smooth operation
---
**Perfect for traders who want clear, actionable levels without chart clutter. Whether you're a beginner learning support/resistance or an experienced trader looking for clean reference points, this indicator delivers exactly what you need.**
Flexi MA Reversal🔹 FlexiMA Reversal – Customizable MA-Based Reversal Indicator
FlexiMA Reversal is a real-time, moving average-based reversal indicator designed to highlight potential market turning points using signal and alert lines. It provides visual cues for both early alerts and confirmed entry signals on candle close.
🔧 Key Features:
Customizable Moving Average Type: Choose from EMA, SMA, WMA, or VWMA (default is EMA).
Flexible MA Inputs: Configure up to three MAs (commonly used 5, 50, and 200).
Toggle Visibility: Enable or disable each MA line as needed.
Real-Time Alert System:
Thin alert lines appear when a potential reversal is detected.
Thicker signal lines confirm the reversal when price closes beyond the alert level.
Optional Visual Styling:
Choose custom colors for each MA, signal, and alert line.
Alert candles are automatically colored to match the corresponding alert line.
Option to show only signal lines for cleaner charts.
Customizable projection length for both alert and signal lines.
📈 Strategy Logic:
This indicator is designed to detect reversal opportunities based on the relationship between price and a selected short-term moving average.
Bullish Setup:
Price closes below the selected MA (e.g., EMA 5).
A bullish alert line is drawn at the high.
If a subsequent candle closes above the alert line and the MA, a bullish signal line is plotted.
Bearish Setup:
Price closes above the selected MA.
A bearish alert line is drawn at the low.
If a subsequent candle closes below the alert line and the MA, a bearish signal line is plotted.
This approach attempts to capture quick market shifts where short-term momentum reverses direction near key MA levels.
🎯 How to Use:
Although originally developed using the 5 EMA strategy, through testing it was found that using 6, 7, or 8 EMA offers even better signal quality.
To add broader trend context, 50 MA and 200 MA lines are included and can be toggled on/off based on your strategy preference.
🔍 Trend Filtering & Re-Entry Tips:
Due to the nature of shorter moving averages, reversal signals may appear frequently. For better trend alignment:
Use the 50 MA as a trend filter:
❌ Ignore bearish signals when price is above 50 MA
❌ Ignore bullish signals when price is below 50 MA
Alternatively, filtered-out signals can be used for re-entry within the trend:
For example, if you receive a bearish alert and signal above the 50 MA, and the next candle closes back above the bearish alert line, this may be interpreted as a bullish re-entry opportunity into the prevailing uptrend.
🛠️ Styling Tips:
You can disable alert candle coloring in the Style tab of the indicator settings.
Use the "Show Only Signal Lines" checkbox to keep the chart minimalistic while still tracking confirmed entries.
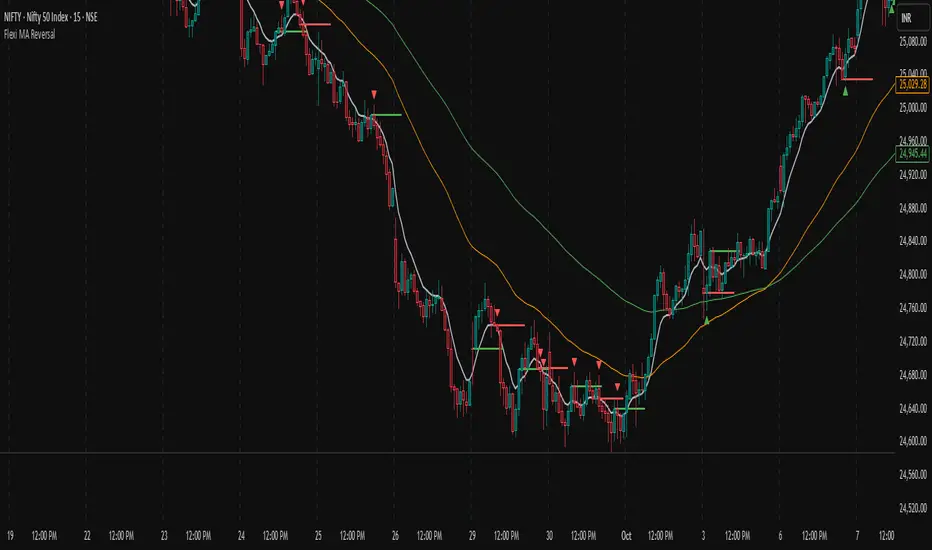
Active PMI Support/Resistance Levels [EdgeTerminal]The PMI Support & Resistance indicator revolutionizes traditional technical analysis by using Pointwise Mutual Information (PMI) - a statistical measure from information theory - to objectively identify support and resistance levels. Unlike conventional methods that rely on visual pattern recognition, this indicator provides mathematically rigorous, quantifiable evidence of price levels where significant market activity occurs.
- The Mathematical Foundation: Pointwise Mutual Information
Pointwise Mutual Information measures how much more likely two events are to occur together compared to if they were statistically independent. In our context:
Event A: Volume spikes occurring (high trading activity)
Event B: Price being at specific levels
The PMI formula calculates: PMI = log(P(A,B) / (P(A) × P(B)))
Where:
P(A,B) = Probability of volume spikes occurring at specific price levels
P(A) = Probability of volume spikes occurring anywhere
P(B) = Probability of price being at specific levels
High PMI scores indicate that volume spikes and certain price levels co-occur much more frequently than random chance would predict, revealing genuine support and resistance zones.
- Why PMI Outperforms Traditional Methods
Subjective interpretation: What one trader sees as significant, another might ignore
Confirmation bias: Tendency to see patterns that confirm existing beliefs
Inconsistent criteria: No standardized definition of "significant" volume or price action
Static analysis: Doesn't adapt to changing market conditions
No strength measurement: Can't quantify how "strong" a level truly is
PMI Advantages:
✅ Objective & Quantifiable: Mathematical proof of significance, not visual guesswork
✅ Statistical Rigor: Levels backed by information theory and probability
✅ Strength Scoring: PMI scores rank levels by statistical significance
✅ Adaptive: Automatically adjusts to different market volatility regimes
✅ Eliminates Bias: Computer-calculated, removing human interpretation errors
✅ Market Structure Aware: Reveals the underlying order flow concentrations
- How It Works
Data Processing Pipeline:
Volume Analysis: Identifies volume spikes using configurable thresholds
Price Binning: Divides price range into discrete levels for analysis
Co-occurrence Calculation: Measures how often volume spikes happen at each price level
PMI Computation: Calculates statistical significance for each price level
Level Filtering: Shows only levels exceeding minimum PMI thresholds
Dynamic Updates: Refreshes levels periodically while maintaining historical traces
Visual System:
Current Levels: Bright, thick lines with PMI scores - your actionable levels
Historical Traces: Faded previous levels showing market structure evolution
Strength Tiers: Line styles indicate PMI strength (solid/dashed/dotted)
Color Coding: Green for support, red for resistance
Info Table: Real-time display of strongest levels with scores
- Indicator Settings:
Core Parameters
Lookback Period (Default: 200)
Lower (50-100): More responsive to recent price action, catches short-term levels
Higher (300-500): Focuses on major historical levels, more stable but less responsive
Best for: Day trading (100-150), Swing trading (200-300), Position trading (400-500)
Volume Spike Threshold (Default: 1.5)
Lower (1.2-1.4): More sensitive, catches smaller volume increases, more levels detected
Higher (2.0-3.0): Only major volume surges count, fewer but stronger signals
Market dependent: High-volume stocks may need higher thresholds (2.0+), low-volume stocks lower (1.2-1.3)
Price Bins (Default: 50)
Lower (20-30): Broader price zones, less precise but captures wider areas
Higher (70-100): More granular levels, precise but may be overly specific
Volatility dependent: High volatility assets benefit from more bins (70+)
Minimum PMI Score (Default: 0.5)
Lower (0.2-0.4): Shows more levels including weaker ones, comprehensive view
Higher (1.0-2.0): Only statistically strong levels, cleaner chart
Progressive filtering: Start with 0.5, increase if too cluttered
Max Levels to Show (Default: 8)
Fewer (3-5): Clean chart focusing on strongest levels only
More (10-15): Comprehensive view but may clutter chart
Strategy dependent: Scalpers prefer fewer (3-5), swing traders more (8-12)
Historical Tracking Settings
Update Frequency (Default: 20 bars)
Lower (5-10): More frequent updates, captures rapid market changes
Higher (50-100): Less frequent updates, focuses on major structural shifts
Timeframe scaling: 1-minute charts need lower frequency (5-10), daily charts higher (50+)
Show Historical Levels (Default: True)
Enables the "breadcrumb trail" effect showing evolution of support/resistance
Disable for cleaner charts focusing only on current levels
Max Historical Marks (Default: 50)
Lower (20-30): Less memory usage, shorter history
Higher (100-200): Longer historical context but more resource intensive
Fade Strength (Default: 0.8)
Lower (0.5-0.6): Historical levels more visible
Higher (0.9-0.95): Historical levels very subtle
Visual Settings
Support/Resistance Colors: Choose colors that contrast well with your chart theme Line Width: Thicker lines (3-4) for better visibility on busy charts Show PMI Scores: Toggle labels showing statistical strength Label Size: Adjust based on screen resolution and chart zoom level
- Most Effective Usage Strategies
For Day Trading:
Setup: Lookback 100-150, Volume Threshold 1.8-2.2, Update Frequency 10-15
Use PMI levels as bounce/rejection points for scalp entries
Higher PMI scores (>1.5) offer better probability setups
Watch for volume spike confirmations at levels
For Swing Trading:
Setup: Lookback 200-300, Volume Threshold 1.5-2.0, Update Frequency 20-30
Enter on pullbacks to high PMI support levels
Target next resistance level with PMI score >1.0
Hold through minor levels, exit at major PMI levels
For Position Trading:
Setup: Lookback 400-500, Volume Threshold 2.0+, Update Frequency 50+
Focus on PMI scores >2.0 for major structural levels
Use for portfolio entry/exit decisions
Combine with fundamental analysis for timing
- Trading Applications:
Entry Strategies:
PMI Bounce Trades
Price approaches high PMI support level (>1.0)
Wait for volume spike confirmation (orange triangles)
Enter long on bullish price action at the level
Stop loss just below the PMI level
Target: Next PMI resistance level
PMI Breakout Trades
Price consolidates near high PMI level
Volume increases (watch for orange triangles)
Enter on decisive break with volume
Previous resistance becomes new support
Target: Next major PMI level
PMI Rejection Trades
Price approaches PMI resistance with momentum
Watch for rejection signals and volume spikes
Enter short on failure to break through
Stop above the PMI level
Target: Next PMI support level
Risk Management:
Stop Loss Placement
Place stops 0.1-0.5% beyond PMI levels (adjust for volatility)
Higher PMI scores warrant tighter stops
Use ATR-based stops for volatile assets
Position Sizing
Larger positions at PMI levels >2.0 (highest conviction)
Smaller positions at PMI levels 0.5-1.0 (lower conviction)
Scale out at multiple PMI targets
- Key Warning Signs & What to Watch For
Red Flags:
🚨 Very Low PMI Scores (<0.3): Weak statistical significance, avoid trading
🚨 No Volume Confirmation: PMI level without recent volume spikes may be stale
🚨 Overcrowded Levels: Too many levels close together suggests poor parameter tuning
🚨 Outdated Levels: Historical traces are reference only, not tradeable
Optimization Tips:
✅ Regular Recalibration: Adjust parameters monthly based on market regime changes
✅ Volume Context: Always check for recent volume activity at PMI levels
✅ Multiple Timeframes: Confirm PMI levels across different timeframes
✅ Market Conditions: Higher thresholds during high volatility periods
Interpreting PMI Scores
PMI Score Ranges:
0.5-1.0: Moderate statistical significance, proceed with caution
1.0-1.5: Good significance, reliable for most trading strategies
1.5-2.0: Strong significance, high-confidence trade setups
2.0+: Very strong significance, institutional-grade levels
Historical Context: The historical trace system shows how support and resistance evolve over time. When current levels align with multiple historical traces, it indicates persistent market memory at those prices, significantly increasing the level's reliability.

Multi-Timeframe EMA Alignment + Listing InfoEnhanced EMA Alignment Checks
Original 4-EMA rows: Check 10EMA ≥ 20EMA ≥ 50EMA ≥ 200EMA for all timeframes
New 3-EMA rows: Check 10EMA ≥ 20EMA ≥ 50EMA (without 200EMA requirement) for weekly and monthly timeframes
Visual Distinction
White background: 4-EMA alignment rows (standard check)
Yellow background: 3-EMA alignment rows (less restrictive check)
Asterisk notation: "1W*" and "1M*" indicate the 3-EMA version
Complete Table Layout
1H: 4-EMA alignment (10≥20≥50≥200)
1D: 4-EMA alignment (10≥20≥50≥200)
1W: 4-EMA alignment (10≥20≥50≥200)
1M: 4-EMA alignment (10≥20≥50≥200)
1W* : 3-EMA alignment (10≥20≥50) - NEW
1M* : 3-EMA alignment (10≥20≥50) - NEW
Separator line
Since List: Weeks/months since listing
Benefits of This Setup:
Comprehensive Analysis: You can now see both strict (4-EMA) and relaxed (3-EMA) trend conditions
Better Entry Signals: The 3-EMA alignment might trigger earlier than 4-EMA, providing potential early entry signals
Trend Strength Assessment: When both 3-EMA and 4-EMA are aligned, it indicates very strong trend conditions
Flexible Strategy: You can use 3-EMA for trend following and 4-EMA for confirmation
The table now provides a complete multi-timeframe trend analysis with both conservative and aggressive alignment criteria, giving you more flexibility in your trading decisions.

Stochastic SuperTrend [BigBeluga]🔵 OVERVIEW
A hybrid momentum-trend tool that combines Stochastic RSI with SuperTrend logic to deliver clean directional signals based on momentum turns.
Stochastic SuperTrend is a straightforward yet powerful oscillator overlay designed to highlight turning points in momentum with high clarity. It overlays a SuperTrend-style envelope onto the Stochastic RSI, generating intuitive up/down signals when a momentum shift occurs across the neutral 50 level. Built for traders who appreciate simplicity without sacrificing reliability.
🔵 CONCEPTS
Stochastic RSI: Measures momentum by applying stochastic calculations to the RSI curve instead of raw price.
SuperTrend Bands: Dynamic upper/lower bands are drawn around the smoothed Stoch RSI line using a user-defined multiplier.
Momentum Direction: Trend flips when the smoothed Stoch RSI crosses above/below the calculated bands.
Neutral Bias Filter: Directional arrows only appear when momentum turns above or below the central 50 level—adding confluence.
🔵 FEATURES
Trend Detection on Oscillator: Applies SuperTrend logic directly to the Stoch RSI curve.
Clean Entry Signals:
→ 🢁 arrow printed when trend flips bullish below 50 (bottom reversals).
→ 🢃 arrow printed when trend flips bearish above 50 (top reversals).
Custom Multiplier: Adjust sensitivity of SuperTrend band spacing around the oscillator.
Neutral Zone Highlight: Visual zone between 0–50 (green) and 50–100 (red) for quick momentum polarity reference.
Toggle SuperTrend Line: Option to show/hide the SuperTrend trail on the Stoch RSI.
🔵 HOW TO USE
Use 🢁 signals for potential bottom reversals when momentum flips bullish from oversold regions.
Use 🢃 signals for potential top reversals when momentum flips bearish from overbought areas.
Combine with price-based SuperTrend or support/resistance zones for confluence.
Suitable for scalping, swing trading, or momentum filtering across all timeframes.
🔵 CONCLUSION
Stochastic SuperTrend is a simple yet refined tool that captures clean momentum shifts with directional clarity. Whether you're identifying reversals, filtering entries, or spotting exhaustion in a trend, this oscillator overlay delivers just what you need— no clutter, just clean momentum structure.

Money Flow: In & Out Detector[THANHCONG]Indicator Name:
Money Flow: In & Out Detector
Indicator Description:
The Money Flow: In & Out Detector indicator uses technical indicators such as RSI (Relative Strength Index), MFI (Money Flow Index), and volume analysis to determine money inflow and outflow in the market.
This indicator helps traders identify changes in money flow, allowing them to detect buy and sell signals based on the combination of the following factors:
RSI > 50 and MFI > 50: Money inflow, indicating a buy signal.
RSI < 50 and MFI < 50: Money outflow, indicating a sell signal.
Volume increase/decrease relative to the average: Identifies strong market behavior changes.
Adjustable Parameters:
RSI Length: The number of periods to calculate the RSI (default is 14).
MFI Length: The number of periods to calculate the MFI (default is 14).
Volume MA Length: The number of periods to calculate the moving average of volume (default is 20).
Volume Increase/Decrease (%): The percentage threshold for volume change compared to the moving average (default is 20%).
Look Back Period: The number of periods used to identify peaks and troughs (default is 20).
How to Use the Indicator:
Money Inflow: When both RSI and MFI are above 50, and volume increases significantly relative to the moving average, the indicator shows a Buy signal.
Money Outflow: When both RSI and MFI are below 50, and volume decreases significantly relative to the moving average, the indicator shows a Sell signal.
Identifying Peaks and Troughs: The indicator also helps identify market peaks and troughs based on technical conditions.
Note:
This indicator assists in decision-making, but does not replace comprehensive market analysis.
Use this indicator in conjunction with other technical analysis methods to increase the accuracy of trade signals.
Steps for Publishing the Indicator on TradingView:
Log in to TradingView:
Go to TradingView and log into your account.
Access Pine Script Editor:
Click on Pine Editor from the menu under the chart.
Paste your Pine Script® code into the editor window.
Check the Source Code:
Ensure your code is error-free and running correctly.
Review the entire source code and add the MPL-2.0 license notice if necessary.
Save and Publish:
After testing and confirming the code works correctly, click Add to Chart to try the indicator on your chart.
If satisfied with the result, click Publish Script at the top right of the Pine Editor.
Provide a name for the indicator and then enter the detailed description you’ve prepared.
Ensure you specify the MPL-2.0 license in the description if required.
Choose the Access Type:
You can choose either Public or Private access for your indicator depending on your intention.
Submit for Publication:
Wait for TradingView to review and approve your indicator. Typically, this process takes a few working days for verification and approval.
User Guide:
You can share detailed instructions for users on how to use the indicator on TradingView, including how to adjust the parameters and interpret the signals. For example:
Set RSI Length: Experiment with different RSI Length values to find the sensitivity that suits your strategy.
Interpreting In/Out Signals: When there is strong money inflow (In), consider entering a buy order. When there is strong money outflow (Out), consider selling.

C&B Auto MK5C&B Auto MK5.2ema BullBear
Overview
The C&B Auto MK5.2ema BullBear is a versatile Pine Script indicator designed to help traders identify bullish and bearish market conditions across various timeframes. It combines Exponential Moving Averages (EMAs), Relative Strength Index (RSI), Average True Range (ATR), and customizable time filters to generate actionable signals. The indicator overlays on the price chart, displaying EMAs, a dynamic cloud, scaled RSI levels, bull/bear signals, and market condition labels, making it suitable for swing trading, day trading, or scalping in trending or volatile markets.
What It Does
This indicator generates bull and bear signals based on the interaction of two EMAs, filtered by RSI thresholds, ATR-based volatility, a 50/200 EMA trend filter, and user-defined time windows. It adapts to market volatility by adjusting EMA lengths and RSI thresholds. A dynamic cloud highlights trend direction or neutral zones, with candlestick coloring in neutral conditions. Market condition labels (current and historical) provide real-time trend and volatility context, displayed above the chart.
How It Works
The indicator uses the following components:
EMAs: Two EMAs (short and long) are calculated on a user-selected timeframe (1, 5, 15, 30, or 60 minutes). Their crossover or crossunder triggers potential bull/bear signals. EMA lengths adjust based on volatility (e.g., 10/20 for volatile markets, 5/10 for non-volatile).
Dynamic Cloud: The area between the EMAs forms a cloud, colored green for bullish trends, red for bearish trends, or a user-defined color (default yellow) for neutral zones (when EMAs are close, determined by an ATR-based threshold). Users can widen the cloud for visibility.
RSI Filter: RSI is scaled to price levels and plotted on the chart (optional). Signals are filtered to ensure RSI is within volatility-adjusted bull/bear thresholds and not in overbought/oversold zones.
ATR Volatility Filter: An optional filter ensures signals occur during sufficient volatility (ATR(14) > SMA(ATR, 20)).
50/200 EMA Trend Filter: An optional filter restricts bull signals to bullish trends (50 EMA > 200 EMA) and bear signals to bearish trends (50 EMA < 200 EMA).
Time Filter: Signals are restricted to a user-defined UTC time window (default 9:00–15:00), aligning with active trading sessions.
Market Condition Labels: Labels above the chart display the current trend (Bullish, Bearish, Neutral) and optionally volatility (e.g., “Bullish Volatile”). Up to two historical labels persist for a user-defined number of bars (default 5) to show recent trend changes.
Visual Aids: Bull signals appear as green triangles/labels below the bar, bear signals as red triangles/labels above. Candlesticks in neutral zones are colored (default yellow).
The indicator ensures compatibility with standard chart types (e.g., candlestick or bar charts) to produce realistic signals, avoiding non-standard types like Heikin Ashi or Renko.
How to Use It
Add to Chart: Apply the indicator to a candlestick or bar chart on TradingView.
Configure Settings:
Timeframe: Choose a timeframe (1, 5, 15, 30, or 60 minutes) to match your trading style.
Filters:
Enable/disable the ATR volatility filter to focus on high-volatility periods.
Enable/disable the 50/200 EMA trend filter to align signals with the broader trend.
Enable the time filter and set custom UTC hours/minutes (default 9:00–15:00).
Cloud Settings: Adjust the cloud width, neutral zone threshold, color, and transparency.
EMA Colors: Use default trend-based colors or set custom colors for short/long EMAs.
RSI Display: Toggle the scaled RSI and its thresholds, with customizable colors.
Signal Settings: Toggle bull/bear labels and set signal colors.
Market Condition Labels: Toggle current/historical labels, include/exclude volatility, and adjust decay period.
Interpret Signals:
Bull Signal: A green triangle or “Bull” label below the bar indicates potential bullish momentum (EMA crossover, RSI above bull threshold, within time window, passing filters).
Bear Signal: A red triangle or “Bear” label above the bar indicates potential bearish momentum (EMA crossunder, RSI below bear threshold, within time window, passing filters).
Neutral Zone: Yellow candlesticks and cloud (if enabled) suggest a lack of clear trend; consider range-bound strategies or avoid trading.
Market Condition Labels: Check labels above the chart for real-time trend (Bullish, Bearish, Neutral) and volatility status to confirm market context.
Monitor Context: Use the cloud, RSI, and labels to assess trend strength and volatility before acting on signals.
Unique Features
Volatility-Adaptive EMAs: Automatically adjusts EMA lengths based on ATR to suit volatile or non-volatile markets, reducing manual configuration.
Neutral Zone Detection: Uses an ATR-based threshold to identify low-trend periods, helping traders avoid choppy markets.
Scaled RSI Visualization: Plots RSI and thresholds directly on the price chart, simplifying momentum analysis relative to price.
Flexible Time Filtering: Supports precise UTC-based trading windows, ideal for day traders targeting specific sessions.
Historical Market Labels: Displays recent trend changes (up to two) with a decay period, providing context for market shifts.
50/200 EMA Trend Filter: Aligns signals with the broader market trend, enhancing signal reliability.
Notes
Use on standard candlestick or bar charts to ensure accurate signals.
Test the indicator on a demo account to optimize settings for your market and timeframe.
Combine with other analysis (e.g., support/resistance, volume) for better decision-making.
The indicator is not a standalone system; use it as part of a broader trading strategy.
Limitations
Signals may lag in fast-moving markets due to EMA-based calculations.
Neutral zone detection may vary in extremely volatile or illiquid markets.
Time filters are UTC-based; ensure your platform’s timezone settings align.
This indicator is designed for traders seeking a customizable, trend-following tool that adapts to volatility and provides clear visual cues with robust filtering for bullish and bearish market conditions.

Dskyz (DAFE) Adaptive Regime - Quant Machine ProDskyz (DAFE) Adaptive Regime - Quant Machine Pro:
Buckle up for the Dskyz (DAFE) Adaptive Regime - Quant Machine Pro, is a strategy that’s your ultimate edge for conquering futures markets like ES, MES, NQ, and MNQ. This isn’t just another script—it’s a quant-grade powerhouse, crafted with precision to adapt to market regimes, deliver multi-factor signals, and protect your capital with futures-tuned risk management. With its shimmering DAFE visuals, dual dashboards, and glowing watermark, it turns your charts into a cyberpunk command center, making trading as thrilling as it is profitable.
Unlike generic scripts clogging up the space, the Adaptive Regime is a DAFE original, built from the ground up to tackle the chaos of futures trading. It identifies market regimes (Trending, Range, Volatile, Quiet) using ADX, Bollinger Bands, and HTF indicators, then fires trades based on a weighted scoring system that blends candlestick patterns, RSI, MACD, and more. Add in dynamic stops, trailing exits, and a 5% drawdown circuit breaker, and you’ve got a system that’s as safe as it is aggressive. Whether you’re a newbie or a prop desk pro, this strat’s your ticket to outsmarting the markets. Let’s break down every detail and see why it’s a must-have.
Why Traders Need This Strategy
Futures markets are a gauntlet—fast moves, volatility spikes (like the April 28, 2025 NQ 1k-point drop), and institutional traps that punish the unprepared. Meanwhile, platforms are flooded with low-effort scripts that recycle old ideas with zero innovation. The Adaptive Regime stands tall, offering:
Adaptive Intelligence: Detects market regimes (Trending, Range, Volatile, Quiet) to optimize signals, unlike one-size-fits-all scripts.
Multi-Factor Precision: Combines candlestick patterns, MA trends, RSI, MACD, volume, and HTF confirmation for high-probability trades.
Futures-Optimized Risk: Calculates position sizes based on $ risk (default: $300), with ATR or fixed stops/TPs tailored for ES/MES.
Bulletproof Safety: 5% daily drawdown circuit breaker and trailing stops keep your account intact, even in chaos.
DAFE Visual Mastery: Pulsing Bollinger Band fills, dynamic SL/TP lines, and dual dashboards (metrics + position) make signals crystal-clear and charts a work of art.
Original Craftsmanship: A DAFE creation, built with community passion, not a rehashed clone of generic code.
Traders need this because it’s a complete, adaptive system that blends quant smarts, user-friendly design, and DAFE flair. It’s your edge to trade with confidence, cut through market noise, and leave the copycats in the dust.
Strategy Components
1. Market Regime Detection
The strategy’s brain is its ability to classify market conditions into five regimes, ensuring signals match the environment.
How It Works:
Trending (Regime 1): ADX > 20, fast/slow EMA spread > 0.3x ATR, HTF RSI > 50 or MACD bullish (htf_trend_bull/bear).
Range (Regime 2): ADX < 25, price range < 3% of close, no HTF trend.
Volatile (Regime 3): BB width > 1.5x avg, ATR > 1.2x avg, HTF RSI overbought/oversold.
Quiet (Regime 4): BB width < 0.8x avg, ATR < 0.9x avg.
Other (Regime 5): Default for unclear conditions.
Indicators: ADX (14), BB width (20), ATR (14, 50-bar SMA), HTF RSI (14, daily default), HTF MACD (12,26,9).
Why It’s Brilliant:
Regime detection adapts signals to market context, boosting win rates in trending or volatile conditions.
HTF RSI/MACD add a big-picture filter, rare in basic scripts.
Visualized via gradient background (green for Trending, orange for Range, red for Volatile, gray for Quiet, navy for Other).
2. Multi-Factor Signal Scoring
Entries are driven by a weighted scoring system that combines candlestick patterns, trend, momentum, and volume for robust signals.
Candlestick Patterns:
Bullish: Engulfing (0.5), hammer (0.4 in Range, 0.2 else), morning star (0.2), piercing (0.2), double bottom (0.3 in Volatile, 0.15 else). Must be near support (low ≤ 1.01x 20-bar low) with volume spike (>1.5x 20-bar avg).
Bearish: Engulfing (0.5), shooting star (0.4 in Range, 0.2 else), evening star (0.2), dark cloud (0.2), double top (0.3 in Volatile, 0.15 else). Must be near resistance (high ≥ 0.99x 20-bar high) with volume spike.
Logic: Patterns are weighted higher in specific regimes (e.g., hammer in Range, double bottom in Volatile).
Additional Factors:
Trend: Fast EMA (20) > slow EMA (50) + 0.5x ATR (trend_bull, +0.2); opposite for trend_bear.
RSI: RSI (14) < 30 (rsi_bull, +0.15); > 70 (rsi_bear, +0.15).
MACD: MACD line > signal (12,26,9, macd_bull, +0.15); opposite for macd_bear.
Volume: ATR > 1.2x 50-bar avg (vol_expansion, +0.1).
HTF Confirmation: HTF RSI < 70 and MACD bullish (htf_bull_confirm, +0.2); RSI > 30 and MACD bearish (htf_bear_confirm, +0.2).
Scoring:
bull_score = sum of bullish factors; bear_score = sum of bearish. Entry requires score ≥ 1.0.
Example: Bullish engulfing (0.5) + trend_bull (0.2) + rsi_bull (0.15) + htf_bull_confirm (0.2) = 1.05, triggers long.
Why It’s Brilliant:
Multi-factor scoring ensures signals are confirmed by multiple market dynamics, reducing false positives.
Regime-specific weights make patterns more relevant (e.g., hammers shine in Range markets).
HTF confirmation aligns with the big picture, a quant edge over simplistic scripts.
3. Futures-Tuned Risk Management
The risk system is built for futures, calculating position sizes based on $ risk and offering flexible stops/TPs.
Position Sizing:
Logic: Risk per trade (default: $300) ÷ (stop distance in points * point value) = contracts, capped at max_contracts (default: 5). Point value = tick value (e.g., $12.5 for ES) * ticks per point (4) * contract multiplier (1 for ES, 0.1 for MES).
Example: $300 risk, 8-point stop, ES ($50/point) → 0.75 contracts, rounded to 1.
Impact: Precise sizing prevents over-leverage, critical for micro contracts like MES.
Stops and Take-Profits:
Fixed: Default stop = 8 points, TP = 16 points (2:1 reward/risk).
ATR-Based: Stop = 1.5x ATR (default), TP = 3x ATR, enabled via use_atr_for_stops.
Logic: Stops set at swing low/high ± stop distance; TPs at 2x stop distance from entry.
Impact: ATR stops adapt to volatility, while fixed stops suit stable markets.
Trailing Stops:
Logic: Activates at 50% of TP distance. Trails at close ± 1.5x ATR (atr_multiplier). Longs: max(trail_stop_long, close - ATR * 1.5); shorts: min(trail_stop_short, close + ATR * 1.5).
Impact: Locks in profits during trends, a game-changer in volatile sessions.
Circuit Breaker:
Logic: Pauses trading if daily drawdown > 5% (daily_drawdown = (max_equity - equity) / max_equity).
Impact: Protects capital during black swan events (e.g., April 27, 2025 ES slippage).
Why It’s Brilliant:
Futures-specific inputs (tick value, multiplier) make it plug-and-play for ES/MES.
Trailing stops and circuit breaker add pro-level safety, rare in off-the-shelf scripts.
Flexible stops (ATR or fixed) suit different trading styles.
4. Trade Entry and Exit Logic
Entries and exits are precise, driven by bull_score/bear_score and protected by drawdown checks.
Entry Conditions:
Long: bull_score ≥ 1.0, no position (position_size <= 0), drawdown < 5% (not pause_trading). Calculates contracts, sets stop at swing low - stop points, TP at 2x stop distance.
Short: bear_score ≥ 1.0, position_size >= 0, drawdown < 5%. Stop at swing high + stop points, TP at 2x stop distance.
Logic: Tracks entry_regime for PNL arrays. Closes opposite positions before entering.
Exit Conditions:
Stop-Loss/Take-Profit: Hits stop or TP (strategy.exit).
Trailing Stop: Activates at 50% TP, trails by ATR * 1.5.
Emergency Exit: Closes if price breaches stop (close < long_stop_price or close > short_stop_price).
Reset: Clears stop/TP prices when flat (position_size = 0).
Why It’s Brilliant:
Score-based entries ensure multi-factor confirmation, filtering out weak signals.
Trailing stops maximize profits in trends, unlike static exits in basic scripts.
Emergency exits add an extra safety layer, critical for futures volatility.
5. DAFE Visuals
The visuals are pure DAFE magic, blending function with cyberpunk flair to make signals intuitive and charts stunning.
Shimmering Bollinger Band Fill:
Display: BB basis (20, white), upper/lower (green/red, 45% transparent). Fill pulses (30–50 alpha) by regime, with glow (60–95 alpha) near bands (close ≥ 0.995x upper or ≤ 1.005x lower).
Purpose: Highlights volatility and key levels with a futuristic glow.
Visuals make complex regimes and signals instantly clear, even for newbies.
Pulsing effects and regime-specific colors add a DAFE signature, setting it apart from generic scripts.
BB glow emphasizes tradeable levels, enhancing decision-making.
Chart Background (Regime Heatmap):
Green — Trending Market: Strong, sustained price movement in one direction. The market is in a trend phase—momentum follows through.
Orange — Range-Bound: Market is consolidating or moving sideways, with no clear up/down trend. Great for mean reversion setups.
Red — Volatile Regime: High volatility, heightened risk, and larger/faster price swings—trade with caution.
Gray — Quiet/Low Volatility: Market is calm and inactive, with small moves—often poor conditions for most strategies.
Navy — Other/Neutral: Regime is uncertain or mixed; signals may be less reliable.
Bollinger Bands Glow (Dynamic Fill):
Neon Red Glow — Warning!: Price is near or breaking above the upper band; momentum is overstretched, watch for overbought conditions or reversals.
Bright Green Glow — Opportunity!: Price is near or breaking below the lower band; market could be oversold, prime for bounce or reversal.
Trend Green Fill — Trending Regime: Fills between bands with green when the market is trending, showing clear momentum.
Gold/Yellow Fill — Range Regime: Fills with gold/aqua in range conditions, showing the market is sideways/oscillating.
Magenta/Red Fill — Volatility Spike: Fills with vivid magenta/red during highly volatile regimes.
Blue Fill — Neutral/Quiet: A soft blue glow for other or uncertain market states.
Moving Averages:
Display: Blue fast EMA (20), red slow EMA (50), 2px.
Purpose: Shows trend direction, with trend_dir requiring ATR-scaled spread.
Dynamic SL/TP Lines:
Display: Pulsing colors (red SL, green TP for Trending; yellow/orange for Range, etc.), 3px, with pulse_alpha for shimmer.
Purpose: Tracks stops/TPs in real-time, color-coded by regime.
6. Dual Dashboards
Two dashboards deliver real-time insights, making the strat a quant command center.
Bottom-Left Metrics Dashboard (2x13):
Metrics: Mode (Active/Paused), trend (Bullish/Bearish/Neutral), ATR, ATR avg, volume spike (YES/NO), RSI (value + Oversold/Overbought/Neutral), HTF RSI, HTF trend, last signal (Buy/Sell/None), regime, bull score.
Display: Black (29% transparent), purple title, color-coded (green for bullish, red for bearish).
Purpose: Consolidates market context and signal strength.
Top-Right Position Dashboard (2x7):
Metrics: Regime, position side (Long/Short/None), position PNL ($), SL, TP, daily PNL ($).
Display: Black (29% transparent), purple title, color-coded (lime for Long, red for Short).
Purpose: Tracks live trades and profitability.
Why It’s Brilliant:
Dual dashboards cover market context and trade status, a rare feature.
Color-coding and concise metrics guide beginners (e.g., green “Buy” = go).
Real-time PNL and SL/TP visibility empower disciplined trading.
7. Performance Tracking
Logic: Arrays (regime_pnl_long/short, regime_win/loss_long/short) track PNL and win/loss by regime (1–5). Updated on trade close (barstate.isconfirmed).
Purpose: Prepares for future adaptive thresholds (e.g., adjust bull_score min based on regime performance).
Why It’s Brilliant: Lays the groundwork for self-optimizing logic, a quant edge over static scripts.
Key Features
Regime-Adaptive: Optimizes signals for Trending, Range, Volatile, Quiet markets.
Futures-Optimized: Precise sizing for ES/MES with tick-based risk inputs.
Multi-Factor Signals: Candlestick patterns, RSI, MACD, and HTF confirmation for robust entries.
Dynamic Exits: ATR/fixed stops, 2:1 TPs, and trailing stops maximize profits.
Safe and Smart: 5% drawdown breaker and emergency exits protect capital.
DAFE Visuals: Shimmering BB fill, pulsing SL/TP, and dual dashboards.
Backtest-Ready: Fixed qty and tick calc for accurate historical testing.
How to Use
Add to Chart: Load on a 5min ES/MES chart in TradingView.
Configure Inputs: Set instrument (ES/MES), tick value ($12.5/$1.25), multiplier (1/0.1), risk ($300 default). Enable ATR stops for volatility.
Monitor Dashboards: Bottom-left for regime/signals, top-right for position/PNL.
Backtest: Run in strategy tester to compare regimes.
Live Trade: Connect to Tradovate or similar. Watch for slippage (e.g., April 27, 2025 ES issues).
Replay Test: Try April 28, 2025 NQ drop to see regime shifts and stops.
Disclaimer
Trading futures involves significant risk of loss and is not suitable for all investors. Past performance does not guarantee future results. Backtest results may differ from live trading due to slippage, fees, or market conditions. Use this strategy at your own risk, and consult a financial advisor before trading. Dskyz (DAFE) Trading Systems is not responsible for any losses incurred.
Backtesting:
Frame: 2023-09-20 - 2025-04-29
Slippage: 3
Fee Typical Range (per side, per contract)
CME Exchange $1.14 – $1.20
Clearing $0.10 – $0.30
NFA Regulatory $0.02
Firm/Broker Commis. $0.25 – $0.80 (retail prop)
TOTAL $1.60 – $2.30 per side
Round Turn: (enter+exit) = $3.20 – $4.60 per contract
Final Notes
The Dskyz (DAFE) Adaptive Regime - Quant Machine Pro is more than a strategy—it’s a revolution. Crafted with DAFE’s signature precision, it rises above generic scripts with adaptive regimes, quant-grade signals, and visuals that make trading a thrill. Whether you’re scalping MES or swinging ES, this system empowers you to navigate markets with confidence and style. Join the DAFE crew, light up your charts, and let’s dominate the futures game!
(This publishing will most likely be taken down do to some miscellaneous rule about properly displaying charting symbols, or whatever. Once I've identified what part of the publishing they want to pick on, I'll adjust and repost.)
Use it with discipline. Use it with clarity. Trade smarter.
**I will continue to release incredible strategies and indicators until I turn this into a brand or until someone offers me a contract.
Created by Dskyz, powered by DAFE Trading Systems. Trade smart, trade bold.

CyberCandle SwiftEdgeCyberCandle SwiftEdge
Overview
CyberCandle SwiftEdge is a cutting-edge, AI-inspired trading indicator designed for traders seeking precision and clarity in trend-following and swing trading. Powered by SwiftEdge, it combines Heikin Ashi candles, a gradient-colored Exponential Moving Average (EMA), and a Relative Strength Index (RSI) to deliver clear buy and sell signals. Featuring glowing visuals, dynamic signal icons, and a customizable RSI dashboard in the top-right corner, this script offers a futuristic interface for identifying high-probability trade setups on various timeframes (e.g., 1H, 4H).
What It Does
CyberCandle SwiftEdge integrates three powerful components to generate actionable trading signals:
Heikin Ashi Candles: Smooths price action to highlight trends, reducing market noise and making reversals easier to spot.
Gradient EMA: A 100-period EMA with dynamic color transitions (blue/cyan for uptrends, red/pink for downtrends) to confirm market direction.
RSI Dashboard: A neon-lit display showing RSI levels, indicating overbought (>70), oversold (<30), or neutral (30-70) conditions.
Buy and sell signals are marked with prominent, glowing icons (triangles and arrows) based on trend direction, momentum, and specific Heikin Ashi patterns. The script’s customizable parameters allow traders to tailor the strategy to their preferences, balancing signal frequency and precision.
How It Works
The strategy leverages the synergy of Heikin Ashi, EMA, and RSI to filter trades and highlight opportunities:
Trend Direction: The price must be above the EMA for buy signals (bullish trend) or below for sell signals (bearish trend). The EMA’s gradient color shifts based on its slope, visually reinforcing trend strength.
Momentum Confirmation: RSI must exceed a user-defined threshold (default: 50) for buy signals or fall below it for sell signals, ensuring momentum supports the trade.
Candle Patterns: Buy signals require a green Heikin Ashi candle (close > open), with the two prior candles having minimal upper wicks (≤5% of candle body) and being red (indicating a retracement). Sell signals require a red candle, minimal lower wicks, and two prior green candles.
RSI Dashboard: Positioned in the top-right corner, it features a glowing circle (red for overbought, green for oversold, blue for neutral), the current RSI value, and a status indicator (triangle for extremes, square for neutral). This provides instant momentum insights without cluttering the chart.
By combining Heikin Ashi’s trend clarity, EMA’s directional filter, and RSI’s momentum validation, CyberCandle SwiftEdge minimizes false signals and highlights trades with strong potential. Its vibrant, AI-like visuals make it easy to interpret at a glance.
How to Use It
Add to Chart: In TradingView, search for "CyberCandle SwiftEdge" and add it to your chart. Set the chart to Heikin Ashi candles for optimal compatibility.
Interpret Signals:
Buy Signal: Large green triangles and arrows appear below candles when the price is above the EMA, RSI is above the buy threshold (default: 50), and conditions for a bullish retracement are met. Consider entering a long position with a 1:2 risk/reward ratio.
Sell Signal: Large red triangles and arrows appear above candles when the price is below the EMA, RSI is below the sell threshold (default: 50), and conditions for a bearish retracement are met. Consider entering a short position.
RSI Dashboard: Monitor the top-right dashboard. A red circle (RSI > 70) suggests caution for buys, a green circle (RSI < 30) indicates potential buying opportunities, and a blue circle (RSI 30-70) signals neutrality.
Customize Parameters: Open the indicator’s settings to adjust:
EMA Length (default: 100): Increase (e.g., 200) for longer-term trends or decrease (e.g., 50) for shorter-term sensitivity.
RSI Length (default: 14): Adjust for more (e.g., 7) or less (e.g., 21) responsive momentum signals.
RSI Buy/Sell Thresholds (default: 50): Set higher (e.g., 55) for buys or lower (e.g., 45) for sells to require stronger momentum.
Wick Tolerance (default: 0.05): Increase (e.g., 0.1) to allow larger wicks, generating more signals, or decrease (e.g., 0.02) for stricter conditions.
Require Retracement (default: true): Disable to remove the two-candle retracement requirement, increasing signal frequency.
Trading: Use signals in conjunction with the RSI dashboard and market context. For example, avoid buy signals if the RSI dashboard is red (overbought). Always apply proper risk management, such as setting stop-losses based on recent lows/highs.
What Makes It Original
CyberCandle SwiftEdge stands out due to its futuristic, AI-inspired visual design and user-friendly customization:
Neon Aesthetics: Glowing Heikin Ashi candles, gradient EMA, and dynamic signal icons (triangles and arrows) with RSI-driven transparency create a high-tech, immersive experience.
RSI Dashboard: A compact, top-right display with a neon circle, RSI value, and adaptive status indicator (triangle/square) provides instant momentum insights without cluttering the chart.
Customizability: Users can fine-tune EMA length, RSI parameters, wick tolerance, and retracement requirements via TradingView’s settings, balancing signal frequency and precision.
Integrated Approach: The synergy of Heikin Ashi’s trend clarity, EMA’s directional strength, and RSI’s momentum validation offers a cohesive strategy that reduces false signals.
Why This Combination?
The script combines Heikin Ashi, EMA, and RSI for a complementary effect:
Heikin Ashi smooths price fluctuations, making it ideal for identifying sustained trends and retracements, which are critical for the strategy’s signal logic.
EMA provides a reliable trend filter, ensuring signals align with the broader market direction. Its gradient color enhances visual trend recognition.
RSI adds momentum context, confirming that signals occur during favorable conditions (e.g., RSI > 50 for buys). The dashboard makes RSI intuitive, even for non-technical users.
Together, these components create a balanced system that captures trend reversals after retracements, validated by momentum, with a visually engaging interface that simplifies decision-making.
Tips
Best used on volatile assets (e.g., BTC/USD, EUR/USD) and higher timeframes (1H, 4H) for clearer trends.
Experiment with parameters in the settings to match your trading style (e.g., increase wick tolerance for more signals).
Combine with other analysis (e.g., support/resistance) for higher-confidence trades.
Note
This indicator is for informational purposes and does not guarantee profits. Always backtest and use proper risk management before trading.

EMA-Based Squeeze Dynamics (Gap Momentum & EWMA Projection)EMA-Based Squeeze Dynamics (Gap Momentum & EWMA Projection)
🚨 Main Utility: Early Squeeze Warning
The primary function of this indicator is to warn traders early when the market is approaching a "squeeze"—a tightening condition that often precedes significant moves or regime shifts. By visually highlighting areas of increasing tension, it helps traders anticipate potential volatility and prepare accordingly. This is intended to be a statistically and psychologically grounded replacement of so-called "fib-time-zones," which are overly-deterministic and subjective.
📌 Overview
The EMA-Based Squeeze Dynamics indicator projects future regime shifts (such as golden and death crosses) using exponential moving averages (EMAs). It employs historical interval data and current market conditions to dynamically forecast when the critical EMAs (50-period and 200-period) will reconverge, marking likely trend-change points.
This indicator leverages two core ideas:
Behavioral finance theory: Traders often collectively anticipate popular EMA crossovers, creating a self-fulfilling prophecy (normative social influence), similar to findings from Solomon Asch’s conformity experiments.
Bayesian-like updates: It utilizes historical crossover intervals as a prior, dynamically updating expectations based on evolving market data, ensuring its signals remain objectively grounded in actual market behavior.
⚙️ Technical & Mathematical Explanation
1. EMA Calculations and Regime Definitions
The indicator uses three EMAs:
Fast (9-period): Represents short-term price movement.
Medial (50-period): Indicates medium-term trend direction.
Slow (200-period): Defines long-term market sentiment.
Regime States:
Bullish: 50 EMA is above the 200 EMA.
Bearish: 50 EMA is below the 200 EMA.
A shift between these states triggers visual markers (arrows and labels) directly on the chart.
2. Gap Dynamics and Historical Intervals
At each crossover:
The indicator records the gap (distance) between the 50 and 200 EMAs.
It tracks the historical intervals between past crossovers.
An Exponentially Weighted Moving Average (EWMA) of these intervals is calculated, weighting recent intervals more heavily, dynamically updating expectations.
Important note:
After every regime shift, the projected crossover line resets its calculation. This reset is visually evident as the projection line appears to move further away after each regime change, temporarily "repelled" until the EMAs begin converging again. This ensures projections remain realistic, grounded in actual EMA convergence, and prevents overly optimistic forecasts immediately after a regime shift.
3. Gap Momentum & Adaptive Scaling
The indicator measures how quickly or slowly the gap between EMAs is changing ("gap momentum") and adjusts its forecast accordingly:
If the gap narrows rapidly, a crossover becomes more imminent.
If the gap widens, the next crossover is pushed further into the future.
The "gap factor" dynamically scales the projection based on recent gap momentum, bounded between reasonable limits (0.7–1.3).
4. Squeeze Ratio & Background Color (Visual Cues)
A "squeeze ratio" is computed when market conditions indicate tightening:
In a bullish regime, if the fast EMA is below the medial EMA (price pulling back towards long-term support), the squeeze ratio increases.
In a bearish regime, if the fast EMA rises above the medial EMA (price rallying into long-term resistance), the squeeze ratio increases.
What the Background Colors Mean:
Red Background: Indicates a bullish squeeze—price is compressing downward, hinting a bullish reversal or continuation breakout may occur soon.
Green Background: Indicates a bearish squeeze—price is compressing upward, suggesting a bearish reversal or continuation breakout could soon follow.
Opacity Explanation:
The transparency (opacity) of the background indicates the intensity of the squeeze:
High Opacity (solid color): Strong squeeze, high likelihood of imminent volatility or regime shift.
Low Opacity (faint color): Mild squeeze, signaling early stages of tightening.
Thus, more vivid colors serve as urgent visual warnings that a squeeze is rapidly intensifying.
5. Projected Next Crossover and Pseudo Crossover Mechanism
The indicator calculates an estimated future bar when a crossover (and thus, regime shift) is expected to occur. This calculation incorporates:
Historical EWMA interval.
Current squeeze intensity.
Gap momentum.
A dynamic penalty based on divergence from baseline conditions.
The "Pseudo Crossover" Explained:
A key adaptive feature is the pseudo crossover mechanism. If price action significantly deviates from the projected crossover (for example, if price stays beyond the projected line longer than expected), the indicator acknowledges the projection was incorrect and triggers a "pseudo crossover" event. Essentially, this acts as a reset, updating historical intervals with a weighted adjustment to recalibrate future predictions. In other words, if the indicator’s initial forecast proves inaccurate, it recognizes this quickly, resets itself, and tries again—ensuring it remains responsive and adaptive to actual market conditions.
🧠 Behavioral Theory: Normative Social Influence
This indicator is rooted in behavioral finance theory, specifically leveraging normative social influence (conformity). Traders commonly watch EMA signals (especially the 50 and 200 EMA crossovers). When traders collectively anticipate these signals, they begin trading ahead of actual crossovers, effectively creating self-fulfilling prophecies—similar to Solomon Asch’s famous conformity experiments, where individuals adopted group behaviors even against direct evidence.
This behavior means genuine regime shifts (actual EMA crossovers) rarely occur until EMAs visibly reconverge due to widespread anticipatory trading activity. The indicator quantifies these dynamics by objectively measuring EMA convergence and updating projections accordingly.
📊 How to Use This Indicator
Monitor the background color and opacity as primary visual cues.
A strongly colored background (solid red/green) is an early alert that a squeeze is intensifying—prepare for potential volatility or a regime shift.
Projected crossover lines give a dynamic target bar to watch for trend reversals or confirmations.
After each regime shift, expect a reset of the projection line. The line may seem initially repelled from price action, but it will recalibrate as EMAs converge again.
Trust the pseudo crossover mechanism to automatically recalibrate the indicator if its original projection misses.
🎯 Why Choose This Indicator?
Early Warning: Visual squeeze intensity helps anticipate market breakouts.
Behaviorally Grounded: Leverages real trader psychology (conformity and anticipation).
Objective & Adaptive: Uses real-time, data-driven updates rather than static levels or subjective analysis.
Easy to Interpret: Clear visual signals (arrows, labels, colors) simplify trading decisions.
Self-correcting (Pseudo Crossovers): Quickly adjusts when initial predictions miss, maintaining accuracy over time.
Summary:
The EMA-Based Squeeze Dynamics Indicator combines behavioral insights, dynamic Bayesian-like updates, intuitive visual cues, and a self-correcting pseudo crossover feature to offer traders a reliable early warning system for market squeezes and impending regime shifts. It transparently recalibrates after each regime shift and automatically resets whenever projections prove inaccurate—ensuring you always have an adaptive, realistic forecast.
Whether you're a discretionary trader or algorithmic strategist, this indicator provides a powerful tool to navigate market volatility effectively.
Happy Trading! 📈✨

LUX CLARA - EMA + VWAP (No ATR Filter) - v6EMA STRAT SHOUT OUTOUTLIERSSSSS
Overview:
an intraday strategy built around two core principles:
Trend Confirmation using the 50 EMA (Exponential Moving Average) in relation to the VWAP (Volume-Weighted Average Price).
Entry Signals triggered by the 8 EMA crossing the 50 EMA in the direction of that confirmed trend.
Key Logic:
Bullish Trend if the 50 EMA is above VWAP. Only long entries are allowed when the 8 EMA crosses above the 50 EMA during that bullish phase.
Bearish Trend if the 50 EMA is below VWAP. Only short entries are allowed when the 8 EMA crosses below the 50 EMA during that bearish phase.
Intraday Focus: Trades are restricted to a user-defined session window (default 7:30 AM–11:30 AM), aligning entries/exits with peak intraday liquidity.
Exit Rule: Positions close automatically when the 8 EMA crosses back in the opposite direction of the entry.
Why It Works:
EMA + VWAP helps detect both immediate momentum (EMAs) and overall institutional bias (VWAP).
By confining trades to a set intraday window, the strategy aims to capture morning volatility while avoiding choppy afternoon or overnight sessions.
Customization:
Users can adjust EMA lengths, session times, or incorporate stops/targets for additional risk management.
It can be tested on various symbols and intraday timeframes to gauge performance and robustness.
