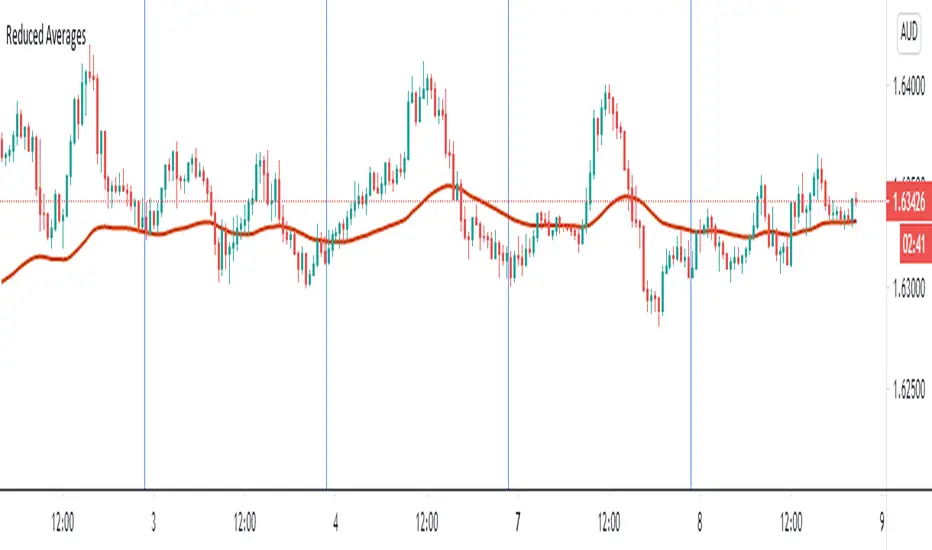
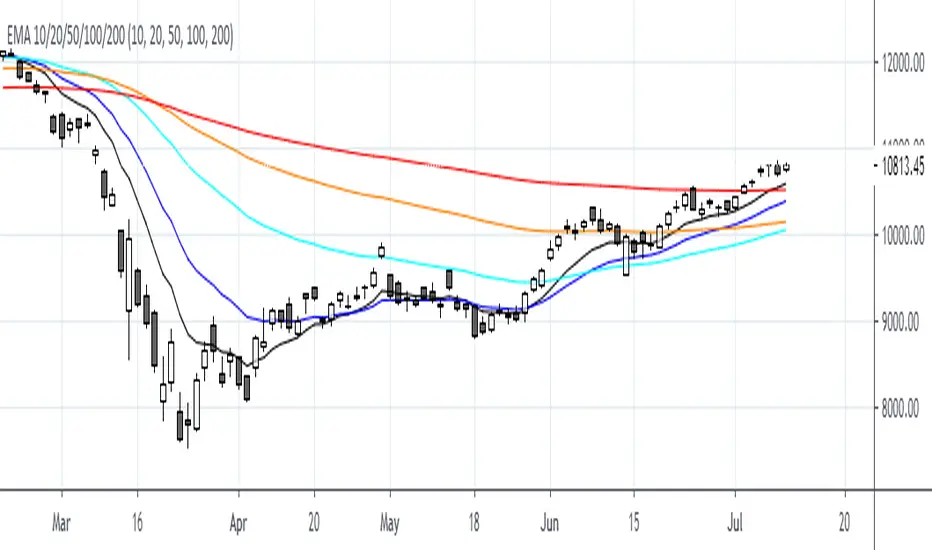
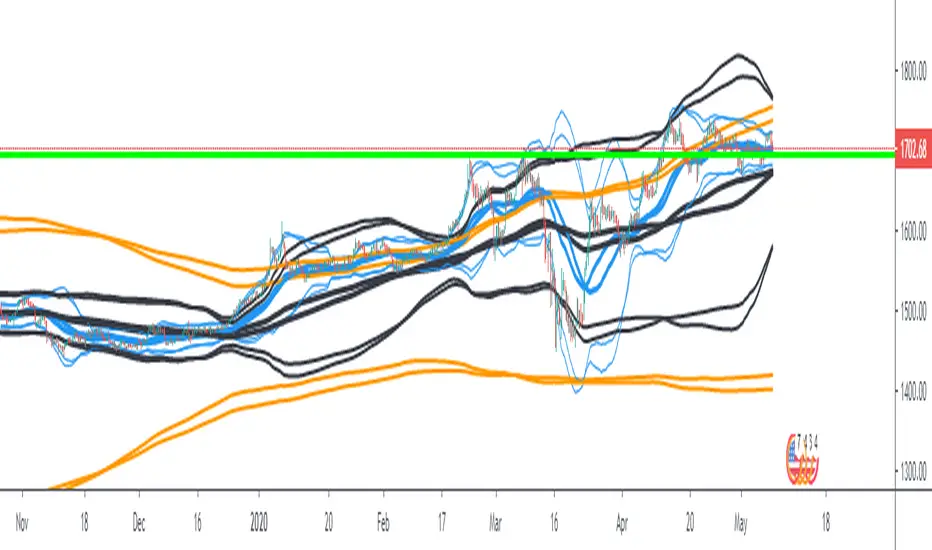
Reduced Averages (20,50,100,200)This script simply takes average value of exponential averages with a goal of reducing the noise on your chart. Many traders use a bunch of averages to identify a trend as they perfectly line up. Reduced Averages does just that. When price is close to a central line, you can comfortbly switch to another chart. When you see it deviating further away, you can enable 20 EMA, 50 EMA, 100 EMA and 200 EMA with a single click.
Cari dalam skrip untuk "南方标普中国A股大盘红利低波50指数成分股行业分布及权重"
MinMax(20,50,100, 200)Draws minimum and maximum prices as a line chart for four different time frames.
1) The last 21 bars (close price)
2) The last 50 bars (close price)
3) The last 100 bars (close price)
4) The last 200 bars (close price)
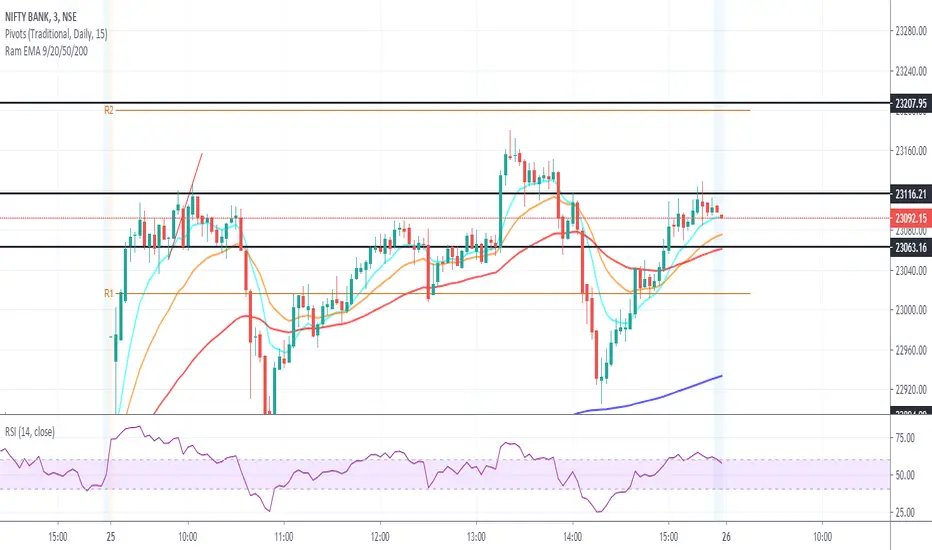
Min/ Max values usually provide important resistance/ support levels.
SMA 9/50/180 | EMA 20 | BUY/SELLAllows for 3 SMAs and One EMA, Combined with Buy/Sell Indicator
Defaults to following settings:
9 SMA - Red
50 SMA - Blue
180 SMA - White
20 EMA - Yellow
Input Values and Colors can be modified
Recommend changes to the Style default
-uncheck SMA2
-uncheck Buy/Sell Chart Line

EMA 10/20/50/100/200First Thank you very much "TradingView" for providing such a Wonderful plateform.
Also very thankful to all TradingView's known & unknown authors who provides superb learnings.
EMA 10/20/50/100/200
Percent difference from 50 & 200 day MAsTo chart price relative to 50 and 200 day SMAs and to use the difference between those metrics as an indicator of bull or bear market and potential turnarounds.
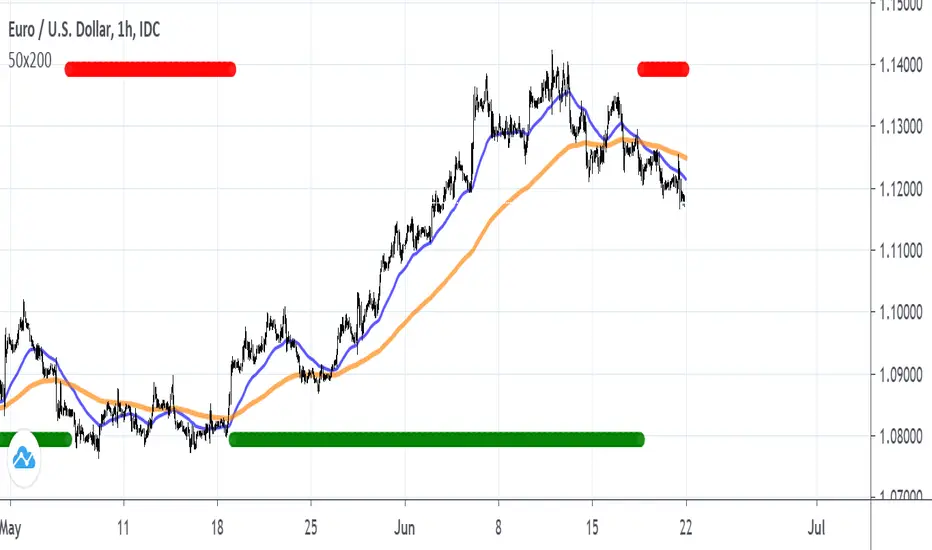
EMA 50 cross 200 with Strong TrendEMA 50 cross 200 with Strong Trend
Just Buy when Green apears and close it when disapear.
and
Just Sell when Red apears and close it when disapear.
if you combine with upper Time Frame , it will be supper decision
Good Luck

EMA 13/50/200/800Candle close below the 13 ema or above is entry singal for sell and buy respectively.
After a bounce off the 50,200 and 800 then a confirmation with the 13 ema
GM EMA BB {EMA(5-26-50) + BB(2-3)}A modified script that shows the EMA of 5, 26, 50 along with nested Bollinger Bands of 2 & 3 mult.
Useful for Growth Module students

EMA 20/50 BUYERSIndicator uses EMA 20 & Ema 50 to determine trend
Entry=
Bullish bars - Uptrend
Bearish Bars Downtrend
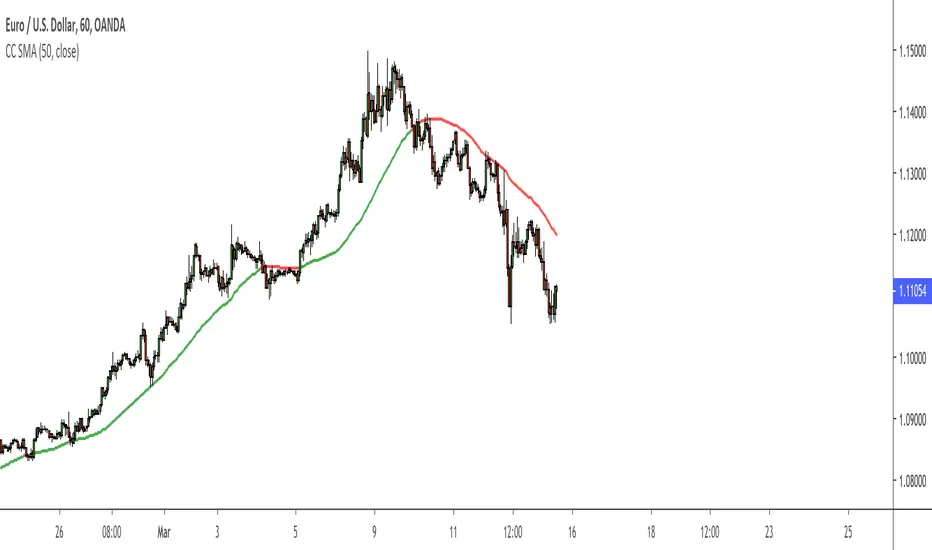
Color Change 50 SMAThis 50 SMA changes color based on the trend of the market.
If the SMA is green, use your edge to determine when to buy.
If the SMA is red, use your edge to determine when to sell.
Can be used on any timeframe and market.
Customize this to meet your needs.
Bollinger Bands Ema 50,200,800EMAs converted to Bollinger Bands The bands are 50, 200 and 800 period, forming a strategy and having clear trends and stronger supports and resistances (when the lines converge the area is stronger).
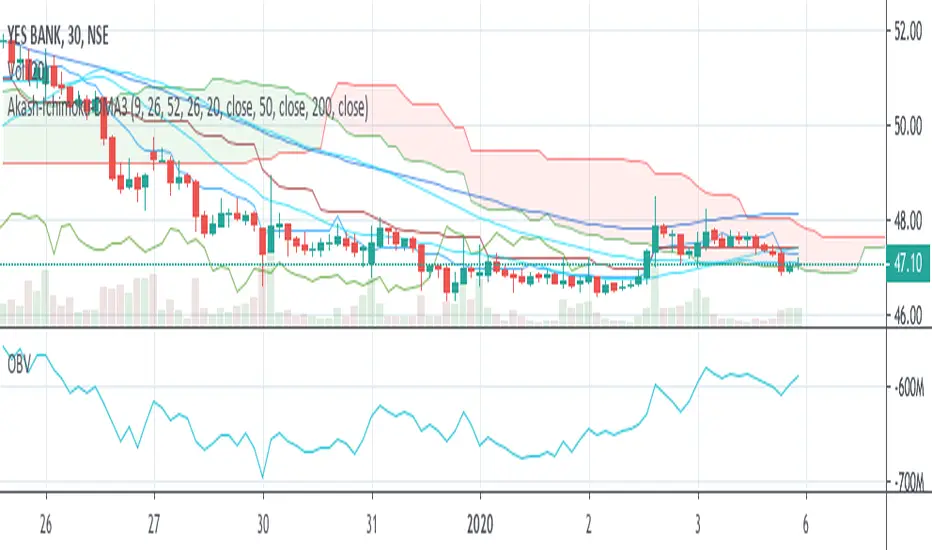
Akash-Ichimoku Cloud + Moving avg of 20-50-200Its a convenient combo indicator of ichimoku cloud and moving averages of 20-50-200
This can help save on limit of indicators in free version.
Most of the positional trading calls can be done with this combo indicator.
Akash Rajpal

sma 50 100 200 multi Timframes actual daily weekly monthlysma 50-100-200
Just 3 sma from actual,daily,weekly and monthly timeframe
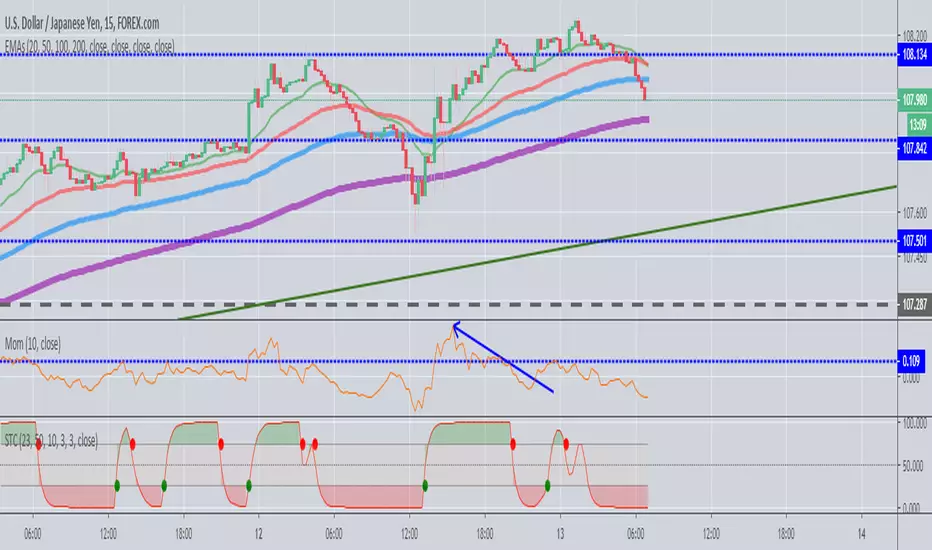
EMAs (20,50,100,200)Ability to plot EMAs (20,50,100,200) in single indicator and can be tweaked according to your trading style.
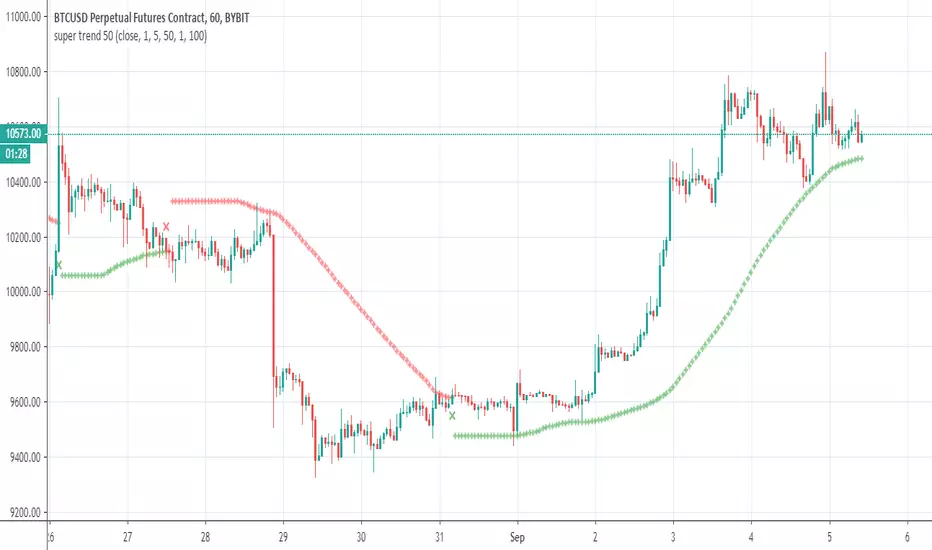
super trend 50So how this super trend is different?
answer is simple =instead to use the source as close we use modified sma at length of 50 (length of curve)
by this way we can make it to act little different
the rest is just to find best setting for each case
alerts inside