Crypto Scalper Divergence Macd Psar Ema 200This is a very efficient crypto scalper adapted to very short timeframes, however it can be optimized for other timeframes and assests as well.
Its components are
MACD
P SAR
EMA 200
Risk management
Rules for entry:
For short : we have an uptrend on PSAR , histogram is positive (divergence MACD) and close of a candle is below EMA 200
For long : we dont have an uptrend on PSAR, histogram is negative(divergence MACD) and close of a candle is above EMA 200
Rules for exit:
We exit when we either find a reverse condition than the entry one, or based on stop loss/take profit that are calculated on % movements of the price.
If you have any questions, let me know !
Cari dalam skrip untuk "情绪指数板块+约200只股票+选股规则"

SMA 200 Ribbon MTF - Support and ResistanceThe SMA 200 is one of the most important and strongest support/resistance lines on any timeframe. This script pulls the SMA 200 line from multiple timeframes so traders can visually see price action bounce between support and resistance . The current timeframes SMA 200 is displayed in white and turns yellow to signify "pressure". Can be used on higher timeframes to find bull action. This indicator can also be used to filter out pumps and dumps as shown in example 3 and 4.
Example of indicator on 5 min timeframe. Candles bounce along SMA200 lines.
Example of indicator on daily timeframe . Lines turn green and price action pumps. Lines turn red and price action dumps.
Example 3: A clean crossover of lines usually signals a bullish pump.
Example 4: Tangled or messy lines tend to result in a dump as price action struggles to cross resistance. A pullback is required to "clean" the lines.
EMA Band can be turned on using "tickbox" in settings menu.

SMA 20, 50, 200This Script provides the 50 and 200 day moving average to provide a way to keep track of the classic Death Cross and Golden Cross. The 20 day moving average is just used as an early prediction of what the 50 day may do so you can keep and eye on it. If you are the kind of person that freaks out at sudden changes in the graphs it is probably best to just turn the 20 day off.
A Golden Cross is when the 50 day MA raises above the 200 day MA. This indicates the start of a Bull Market. This is the best time to buy as the market commonly will increase over the next few months or even years.
A Death Cross is when the 50 day MA drops below the 200 day MA. This indicates the start of a Bear Market. This is the best time to sell as the market will commonly decrease at least 20 percent or more over the next couple months or more.
I am not a financial advisor and this is just a tool to help you make your own decisions with your investments. My information is just based on common knowledge.

EMA 21,55,100,200/SMA 30,200 by Niko
Hi stranger,
This is my script with Exponencial moving average in my scales ( 21,55,100,200) which I use, and Simple moving average (30,200).
Enjoy

EMA 50 & 200 (TF-specific)This script plots EMA 50 and EMA 200 only on the timeframes where they matter most:
EMA 50 (gray): visible on 1H, 4H, and 12H charts – often used by intraday traders.
EMA 200 (black): visible on Daily and Weekly charts – a classic long-term trend indicator.
🔹 Why use it?
Avoids clutter by showing each EMA only on the relevant timeframe.
Helps align intraday trading with higher timeframe trends.
Simple, clean, and effective for both swing and day trading.

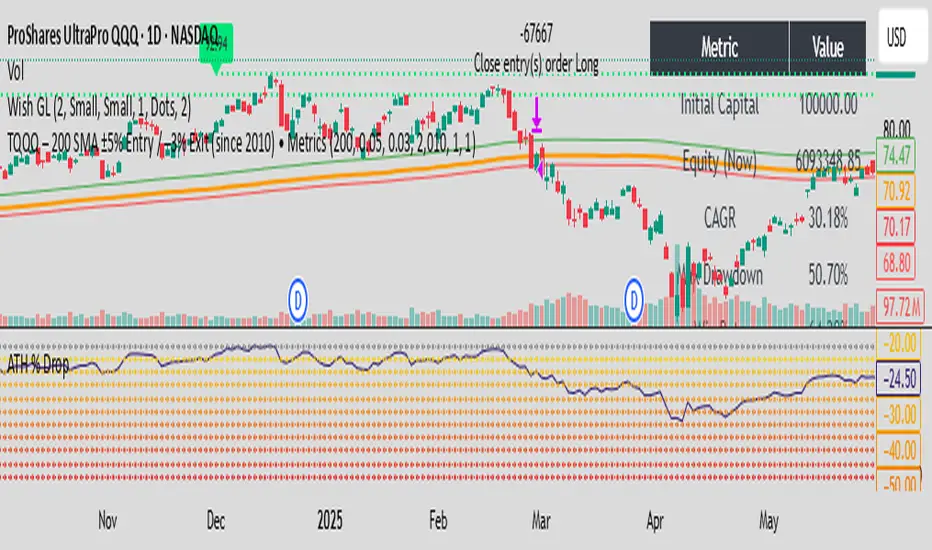
TQQQ – 200 SMA ±5% Entry / –3% Exit (since 2010) • Metrics by DE✅ In plain words:
You only buy TQQQ when it’s trading 5% above its 200-day SMA (a sign of strong uptrend momentum).
You stay long as long as the price holds above 3% below the 200-day SMA.
If price falls below that lower threshold, you exit to limit drawdown.
The strategy is designed to catch strong uptrends while cutting losses early.
EMA 200 MultiTF G/R + Cross Alerts by LifeHack Trader1. Indicator Setup
The script starts by defining the version of Pine Script (v5) and creating an indicator called "EMA 200 MultiTF G/R + Cross Alerts by LifeHack Trader."
The overlay=true parameter ensures that the indicator is plotted directly on the price chart.
2. Function to Get EMA200
A custom function getEma200 is defined to retrieve the 200-period Exponential Moving Average (EMA) for a specified timeframe (tf).
This function uses the request.security function to fetch the close price's EMA from different timeframes.
3. Calculate EMA200 for Multiple Timeframes
The script calculates the EMA200 for four timeframes: 15 minutes ("15"), 1 hour ("60"), 4 hours ("240"), and 1 day ("D").
These values are stored in variables (ema15, ema1h, ema4h, ema1d) and represent the EMA for each timeframe.
4. Determine Price Above or Below EMA200 (G/R)
For each timeframe, the script checks whether the closing price is above or below the EMA200.
It uses boolean checks to determine if the price is above the EMA200, assigning the status "G" (Green) for above and "R" (Red) for below.
5. Cross Signal Detection (Up/Down)
The script detects crossovers and crossunders between the price and EMA200 for each timeframe.
A crossover signal is detected when the price crosses above the EMA200 (bullish), and a crossunder signal is detected when the price crosses below the EMA200 (bearish).
These signals are stored in separate variables (crossUp, crossDown).
6. Display a Table with G/R Status and Cross Alerts
A table is created and displayed in the top-right corner of the chart. The table shows the status (G or R) for each timeframe and the cross signal (▲ for crossover, ▼ for crossunder, or - for no cross event).
The table is updated with the respective values for each timeframe every time a new bar is formed.
7. Alert Conditions
The script defines alert conditions based on the crossovers and crossunders.
When a price crosses above the EMA200 (cross-up), an alert is triggered for a potential buy opportunity. When the price crosses below the EMA200 (cross-down), an alert is triggered for a potential sell opportunity.
Alerts are configured for each timeframe (15 minutes, 1 hour, 4 hours, and 1 day).
This script provides a comprehensive system for monitoring price action relative to the EMA200 on multiple timeframes, highlighting crossovers, and delivering visual feedback and alerts based on the price's relationship with the EMA.

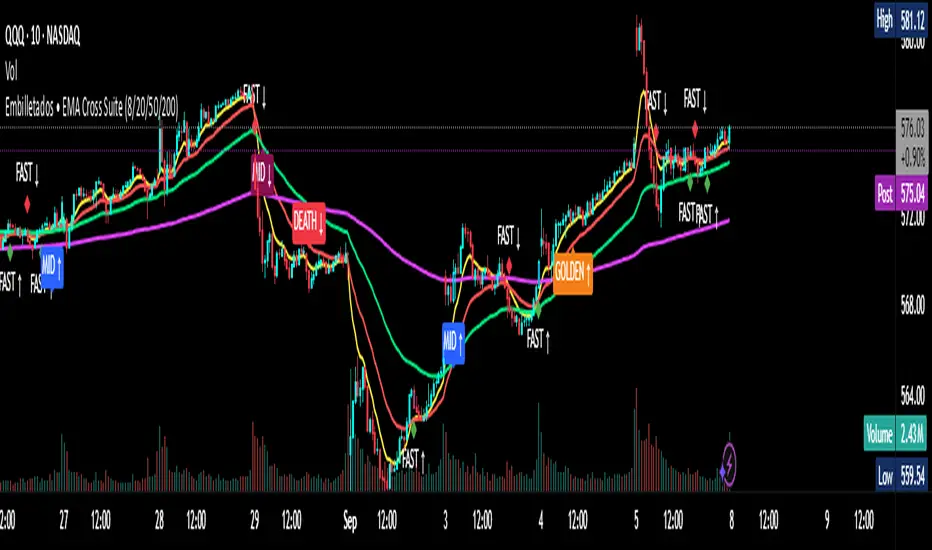
EMA Cross Suite (8/20/50/200) GOLDEN/DEATH by Carlos Chavez📜 Short Description (max 160 characters)
“Advanced EMA crossover system with FAST, MID, GOLDEN, and DEATH signals. Includes alerts, optimized visuals, and full customization.”
📄 Full Description (Paste in the box)
📌 Overview
The Embilletados • EMA Cross Suite is a professional trading indicator designed for intraday traders, scalpers, and swing traders.
It provides clear crossover signals using 4 EMAs combined with optimized visualization and built-in alerts to help you catch opportunities faster.
✨ Key Features:
🔹 4 configurable EMAs → 8, 20, 50, and 200.
🔹 Instant visual signals with colored labels:
FAST CROSS (8/20) → Quick momentum shifts.
MID CROSS (20/50) → Trend confirmation signals.
GOLDEN CROSS (50/200) → Strong bullish trend signals.
DEATH CROSS (50/200) → Strong bearish trend signals.
🔹 Built-in alerts → Get notified instantly for all crossover events.
🔹 Optimized visualization → Clean and easy-to-read interface.
🔹 Highly customizable → Enable/disable signals, labels, colors, and alerts according to your strategy.
📊 Recommended Timeframes:
10-minute charts → Best for intraday setups.
1-hour charts → Ideal for swing trading and trend confirmation.
🚀 How to Use:
Add the indicator to your chart.
Set up alerts for the desired crossovers: FAST, MID, GOLDEN, or DEATH.
Trade confidently using clear visual confirmations and real-time notifications.
🌟 Perfect for:
✅ Intraday traders
✅ Scalpers
✅ Swing traders
✅ Trend-following strategies
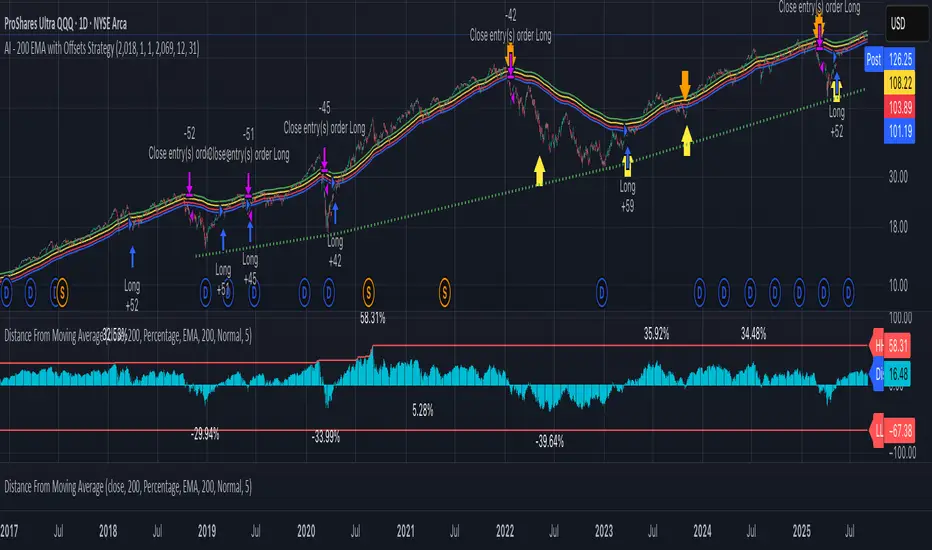
AI - 200 EMA with Offsets StrategyLong when close price crosses above +4% offset 200 day EMA
Sell when close price crosses below -6.5% offset 200 day EMA
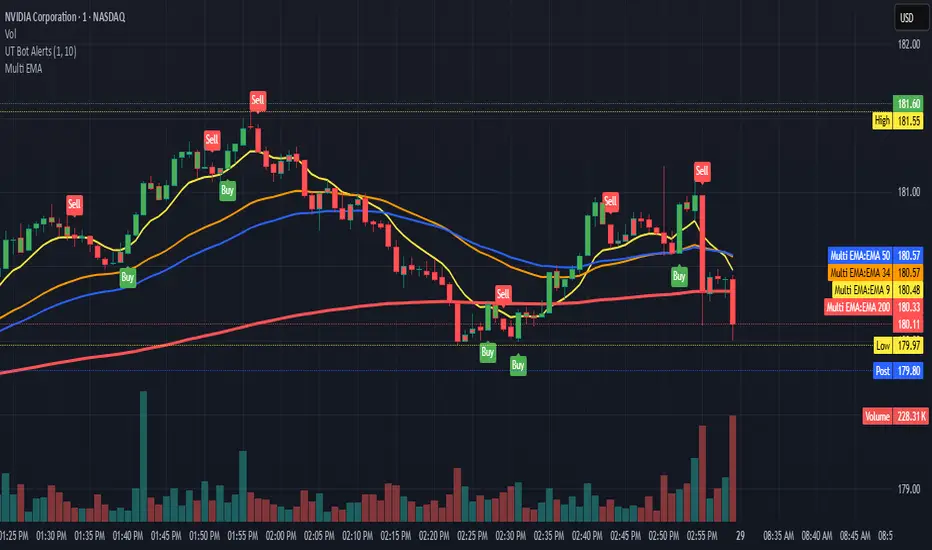
Multi-EMA System (9,34,50,200)This script gives you:
Yellow line: 9 EMA (your fastest momentum indicator)
Orange line: 34 EMA (good for short-term trend confirmation)
Blue line: 50 EMA (classic medium-term trend line)
Red line: 200 EMA (the big daddy - long-term trend and major support/resistance)
I made the 200 EMA a bit thicker since it's usually the most significant level. You can adjust the colors in the script if you prefer different ones.
Multi-Timeframe 200 EMAMulti-Timeframe 200 EMA Indicator
This indicator plots five 200-period Exponential Moving Averages (EMAs) on your chart, each from a different timeframe: 1-hour, 2-hour, 4-hour, 8-hour, and 1-day.
What It Does:
Analyzes Higher Timeframes: It uses the request.security() function to fetch data from higher timeframes. This allows you to see significant long-term support and resistance levels from higher timeframes, all on your current chart.
Customizable: You can easily turn each EMA line on or off individually in the indicator's settings. By default, the 1-hour and 1-day EMAs are off, so you can focus on the intermediate timeframes right away.
Clean and Simple: The indicator is designed to be clean and easy to read, with different colors for each EMA line to help you quickly identify the different timeframes at a glance.
This is a powerful tool for trend analysis and identifying key price levels, helping you make more informed trading decisions.

MACROFLOW 200 — Bias & Triggersstephtradez model
MACROFLOW 200 — at a glance (the elevator pitch)
Trade direction = Macro Bias + 1H 200 EMA filter + DXY confirm.
Locations = 1H supply/demand zones.
Triggers (15m): (T1) Retest rejection, (T2) Liquidity sweep + BOS/CHOCH, (T3) Momentum break + shallow pullback.
Stops: structure‑based beyond zone with ATR buffer.
Targets: 2R base, scale at 1.5R, trail to next HTF zone.
Sessions: 7–10 pm ET and 9:30–10:30 am ET.
Risk: tight, prop‑friendly max 1% per session

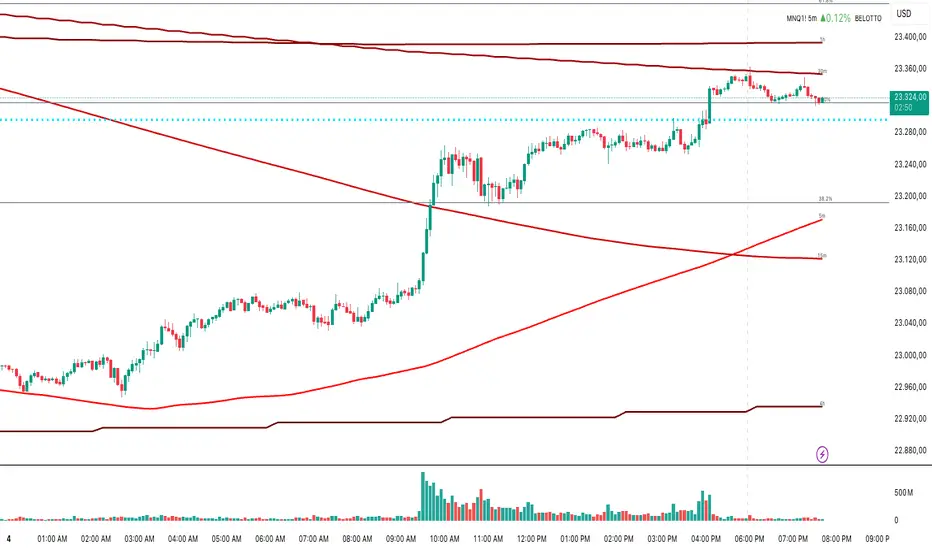
Multi-Timeframe MA 200Multi-Timeframe MA 200
This powerful tool plots the 200-period Moving Average across multiple timeframes (5m, 15m, 30m, 1h, 4h, Daily) directly on your active chart. You can switch between SMA (Simple Moving Average) and EMA (Exponential Moving Average) for all timeframes at once.
Key features:
✅ 100% accurate calculation using the original timeframe
✅ Option to choose SMA or EMA
✅ Visual smoothing for cleaner display
✅ Floating labels showing the origin timeframe
✅ Clean interface – no clutter or legends
✅ Ideal for scalping, intraday, and swing traders
Developed by BELOTTO TRADER, founder of the CLUBE DO GAIN – one of the most engaged trading communities in the Portuguese-speaking world.
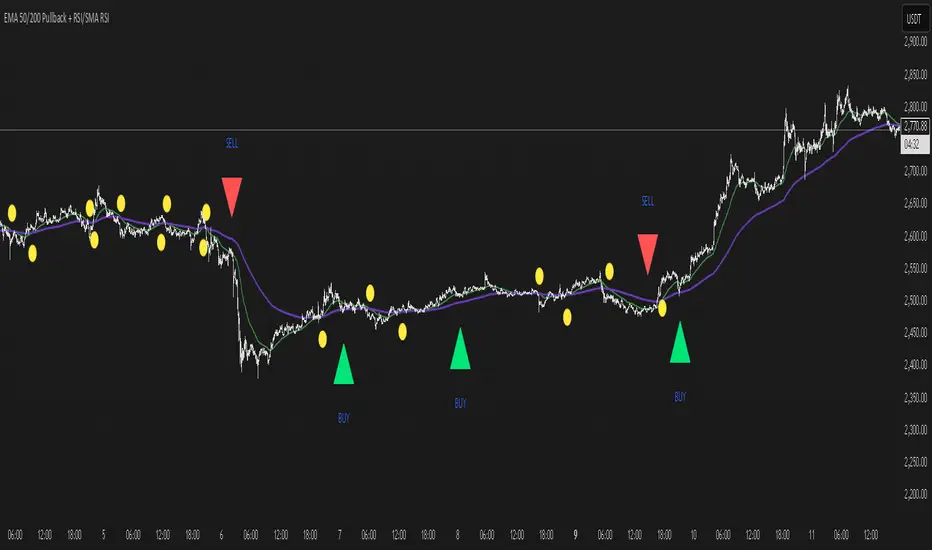
EMA 50/200 Pullback + RSI/SMA RSI
Strategy Description: EMA 50/200 Pullback + RSI/SMA RSI
1. Trend Identification with EMA:
Uses two Exponential Moving Averages (EMA): a fast EMA (default 50) and a slow EMA (default 200).
When the fast EMA crosses above the slow EMA (bullish crossover), an uptrend is identified.
When the fast EMA crosses below the slow EMA (bearish crossover), a downtrend is identified.
The lengths of both EMAs are fully customizable.
2. EMA Distance Condition:
Signals are only valid when the absolute percentage distance between the two EMAs is within a user-defined range (default: 0.4% to 1%).
This helps filter out weak signals when the EMAs are too close or too far apart.
3. Pullback Condition:
After a new trend is detected (EMA crossover), the strategy waits for the price to pull back to touch or cross the fast EMA (EMA 50).
This ensures entries are not taken immediately at the crossover, but after a retracement to a dynamic support/resistance area.
4. RSI Confirmation:
Uses the RSI indicator (default 14) and its Simple Moving Average (SMA RSI, default 14).
Buy signal: RSI crosses above its SMA.
Sell signal: RSI crosses below its SMA.
Both RSI and SMA RSI lengths are fully customizable.
5. Entry Rules:
The indicator only gives the first buy/sell signal after each EMA crossover (start of a new trend), and will not repeat signals until the next EMA crossover.
Buy signal:
Fast EMA crosses above slow EMA
EMA distance is within the valid range
Price pulls back to the fast EMA
RSI crosses above its SMA
Sell signal:
Fast EMA crosses below slow EMA
EMA distance is within the valid range
Price pulls back to the fast EMA
RSI crosses below its SMA
6. Customization:
All parameters (EMA lengths, RSI length, SMA RSI length, EMA distance range) can be adjusted in the indicator’s settings.
Note:
This is a signal indicator, not a complete trading strategy. For real trading, always combine with risk management and additional confirmations.
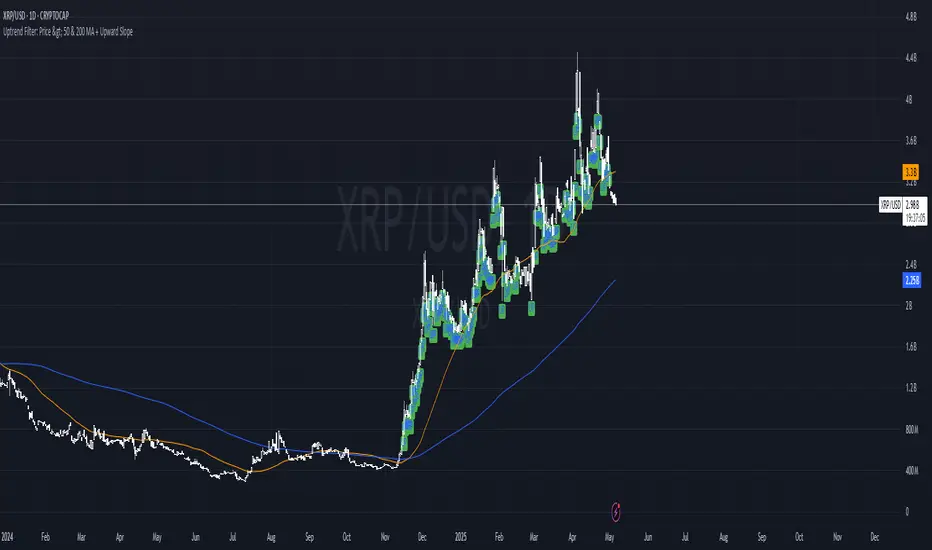
Uptrend Filter: Price > 50 & 200 MA + Upward SlopeThis indicator is designed to help traders instantly identify strong uptrend conditions based on two simple yet powerful criteria:
Price is above both the 50-day and 200-day moving averages
Both moving averages are sloping upward (positive momentum)
When both conditions are met, the indicator plots a green “UP” label below the candle, signaling a valid uptrend setup. This filter is ideal for asset selection in strategy-building, portfolio rotation, or trend-following systems.
🧠 Why it works:
The 50-day MA reflects medium-term momentum.
The 200-day MA represents the long-term trend.
When both are aligned and sloping upward, it confirms strong market structure and trend health.
🧰 Best used for:
Token screening (e.g., filtering altcoins)
Momentum-based entries
Trend confirmation
Risk filtering in strategy backtesting
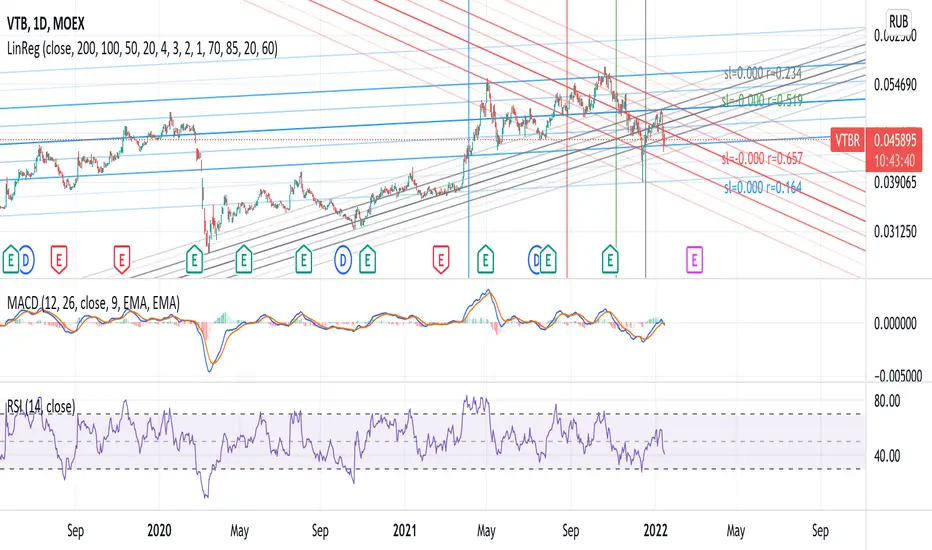
Linear Regression 200/100/50/20Four time frames in one indicator in different colors, showing current price trend in different scopes.
If the slope of the smaller time frame is in a (0,75;1,25) interval of some of the bigger ones the smaller one is omitted (different signs near zero are not coalesced in that way though).
Every time frame has four deltas of range in trend lines of different grade of transparency (2-1-4-3), as well as a vertical line denoting regression date range start, also bearing the same color (blue-red-green-gray for 200/100/50/20).
On the right of the latest bar are Pearson coefficients and slopes of the regressions, 200/100/50/20 bottom-up, also appropriately colored.
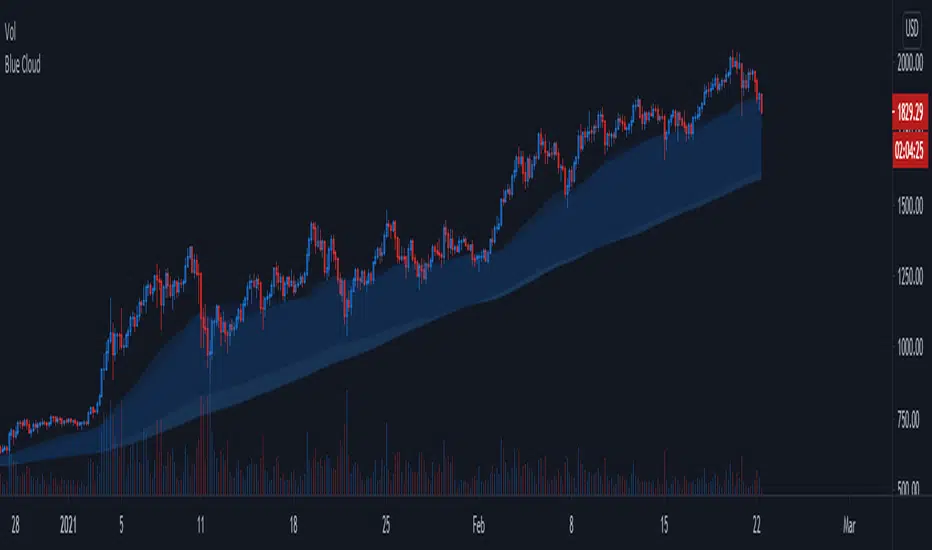
Blue CloudTrend Indicator
- Based on 4h 50/200 ma/ema
- Static, same accross all timeframes
- Works best with trending assets (espacially altcoins)
- 4h 50/200 ma/ema 's are transparent by default but can be enabled to improve visibility
Blue Cloud = Bullish, cloud often acts as support
Red Cloud = Bearish, cloud often acts as resistance
Long only strategy VWAP with BB and Golden Cross EMA50/200
This is strategy, mainly designed for stock markets
It makes uses of the EMA 50/ 200 ( Golden cross) and VWAP and Bollinger bands.
It only takes long positions. It can be adapted to all time frames, but preferably to be used with longer timeframes 1h +
The rules for entry are the next ones :
1. EMA50 > EMA 200
2. if current close > vwap session value
3. check if price dipped BB lower band for any of last 10 candles
EXIT RULE
1. price closes above BB upper
STOP LOSS EXIT
1. As configured --- default is set to 1%

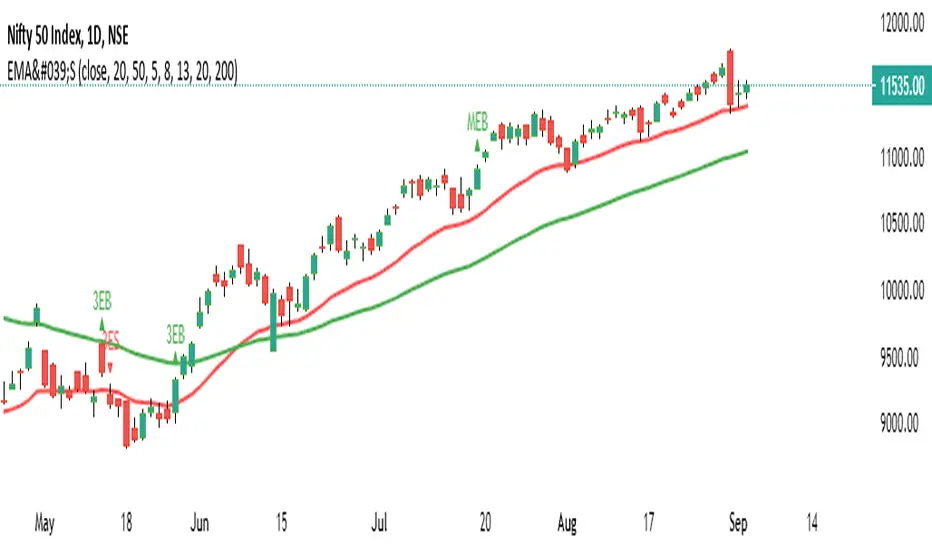
5-8-13 & 20-200 EMA Cross Over1) Popular EMA cross over combined as on indicator daily time frame
2) 5-8-13 for Swing 3EB- Bullish 3ES - Bearish
3) 20-200 EMA Cross over called as multi-bagger cross over with an inverted triangle in a smaller period of time
MEB - Bullish 20 ema crossed 200 ema, MES - Bearish vice versa
4) Simultaneously 20 50 are plotted in the graph as user input can be changed to according to user specific
Big Picture 50/200Crazy as this may sound, it took 126 iterations to get something so simple sone right.
Big Picture helps offload some longer-term SMA lines off your chart so you can clutter it up again with some other stuff. It works by comparing SMAs 50 and 200 in histogram form. If the histogram is over the zero-line, 50 is over 200, and vice versa.
The histogram is green when the slope rises, suggesting that 50 is rising relative to 200. When the histogram turns red, 50 is falling.
Some Heikin-Ashi inspired averaging helps smooth the line just a little to help give a better idea as to overall trend.

Accum/Dist + 200 EMAAccumulation / Distribution Indicator with a 200 EMA applied to it.
Helps to identify market trends and especially useful if combined with Pivot Points.
When AD line is above the 200 EMA and price is hovering above the central Pivot, we assume a bullish bias towards R1 and R2 resistance points. And vice-versa.

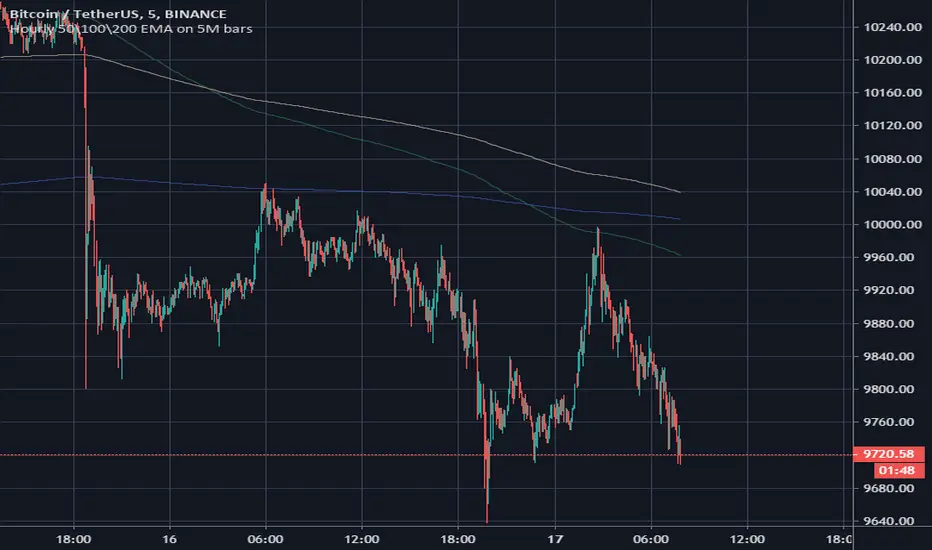
Hourly 50\100\200 EMA on 5M barsHello. This script was created for traders using a 5 minute timeframe. The script allows you to plot EMA from a higher level timeframe. Its formula includes the multiplication of the classical values of 50/100/200 EMA by 12, because in one hour it is 12 times for 5 minutes. You must use script only at 5M timeframe, because his interval is unique and not compare with other timeframes.
Often, an hourly EMA on a 5-minute timeframe becomes a strong level of support or price resistance. You can use this script on 5M timeframe with "daily 50/100/200 EMA" script on 1H timeframe for best scalping results.
Good luck in trading!
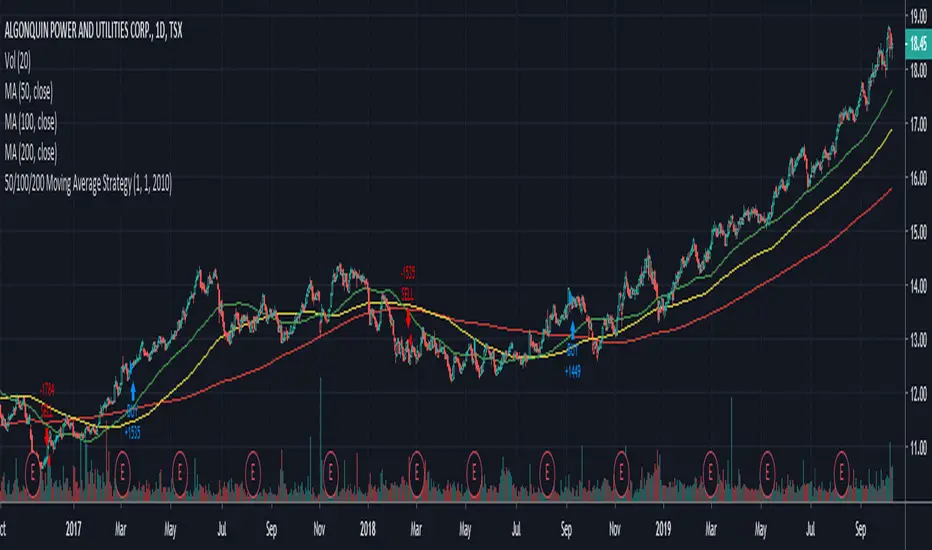
Easy to Use 50/100/200 Day Moving Average StrategyWhenever you see someone publish a chart or idea, what's the one thing you almost always see? Moving Averages!
Many investors focus on these indictors solely as entry and exit points, so here's an easy to manipulate strategy to backtest and see if this is feasible on your security.
CODE VARIABLES
LINE 2 - Here you can change your currency and amount you want to invest on each entry.
LINE 8/9/10 - Here we establish the 50 (Fast), 100 (Medium) and 200 (Slow) day variables. These can be adjusted to your choosing.
LINE 13/14/15 - Here we establish what date we want to start backtesting from. Simple change the defval on each line to change the date (In the code below we start on Jan 1st, 2010).
LINE 20/23 - Here, within the crossover and crossunder functions, we set which MA's must cross to enter and exit a trade. Below we have the 50 day moving above and under the 200 day. Simple change the variables to FastMA, MediumMA and SlowMA to your choosing.
NOTE: As a beginner you may not want to short stock, therefore LINE 5 was added to only allow long positions.
Hope this helps, from one beginner to another.
Cheers!