Cari dalam skrip untuk "想象图:箱线图+折线组合,横轴为国家,纵轴为响应指数(0-100),箱线显示均值±标准差,叠加红色虚线标注各国确诊高峰时间点"
EMA30,60,100 EMA 30 (orange),60(red),100(green)
Bullish: green below the other two
Bearish: green above other two
when lines cross, no clear trend.
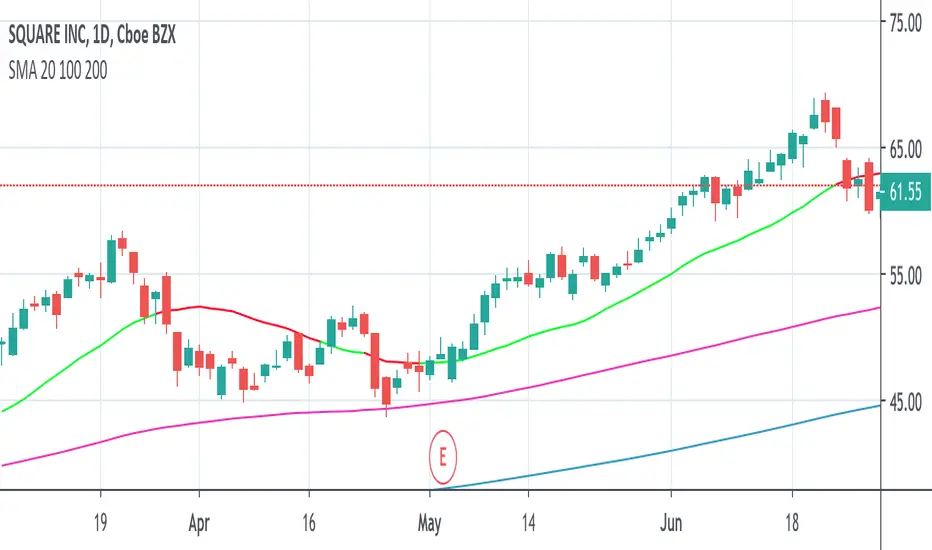
When Price touches the orange = entry point
Thanks to CFXtrader for the basic script

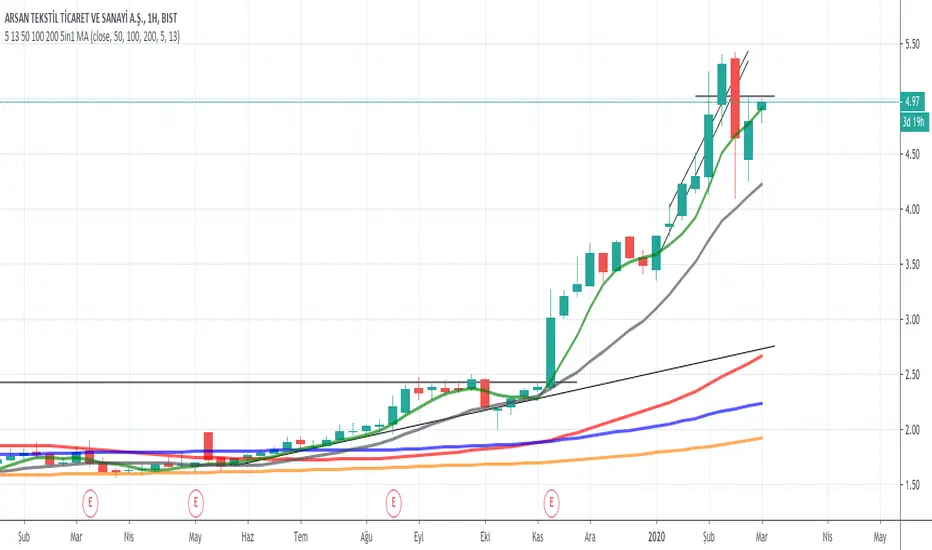
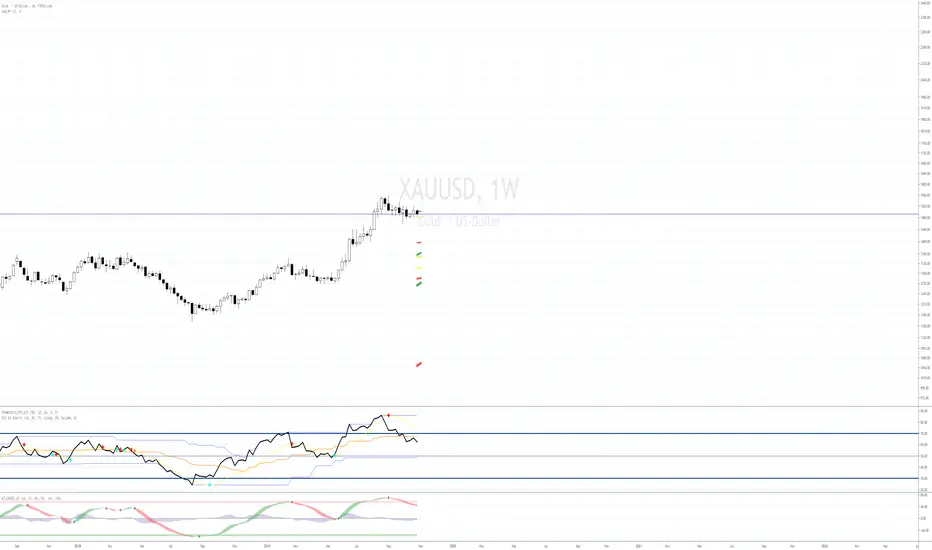
Fibonacci Trendlines 20, 50, 100, 200 (SMA)Dört tane simple moving average bir arada. 20, 50, 100, 200 (SMA) hareketli ortalamaları içerir

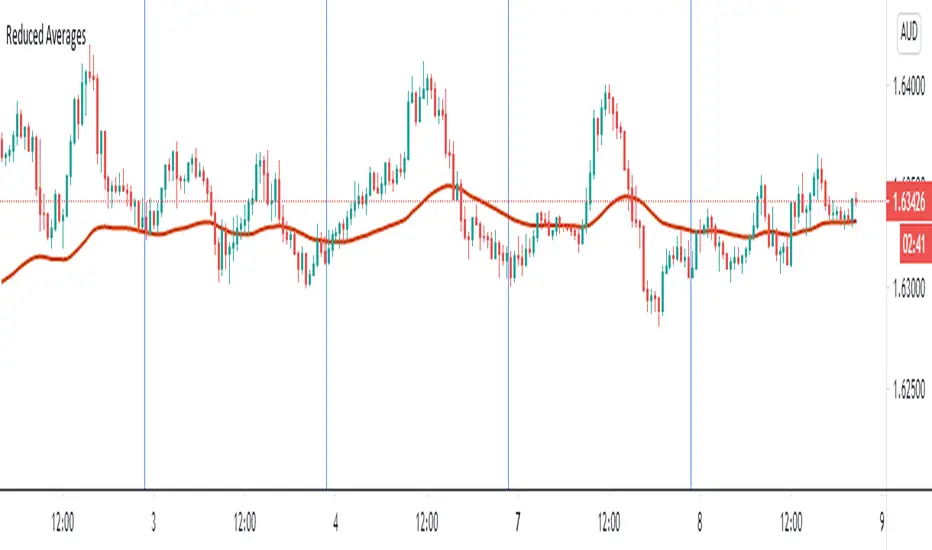
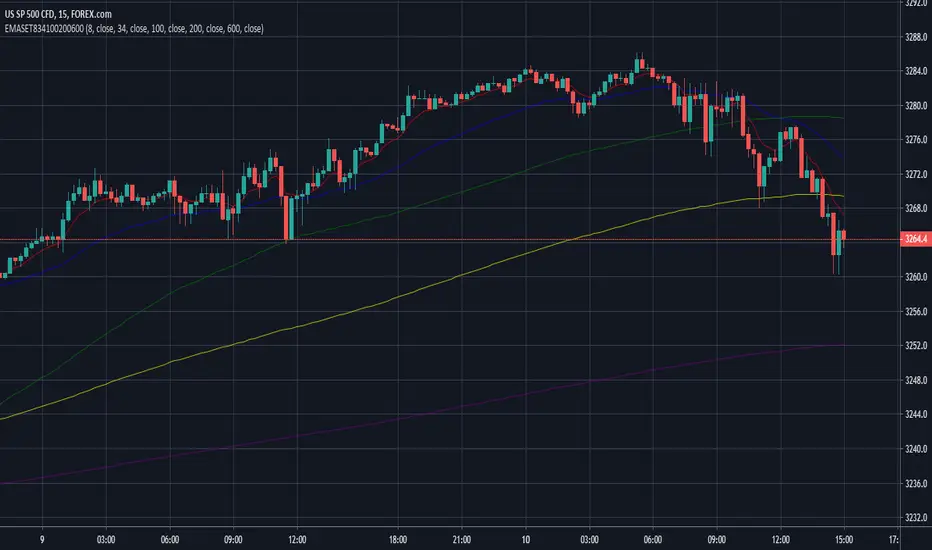
Reduced Averages (20,50,100,200)This script simply takes average value of exponential averages with a goal of reducing the noise on your chart. Many traders use a bunch of averages to identify a trend as they perfectly line up. Reduced Averages does just that. When price is close to a central line, you can comfortbly switch to another chart. When you see it deviating further away, you can enable 20 EMA, 50 EMA, 100 EMA and 200 EMA with a single click.
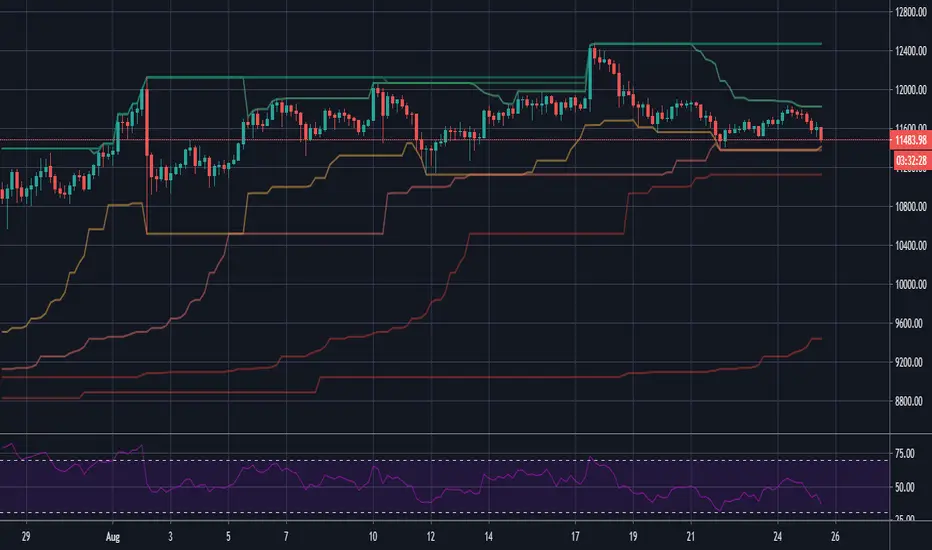
MinMax(20,50,100, 200)Draws minimum and maximum prices as a line chart for four different time frames.
1) The last 21 bars (close price)
2) The last 50 bars (close price)
3) The last 100 bars (close price)
4) The last 200 bars (close price)
Min/ Max values usually provide important resistance/ support levels.
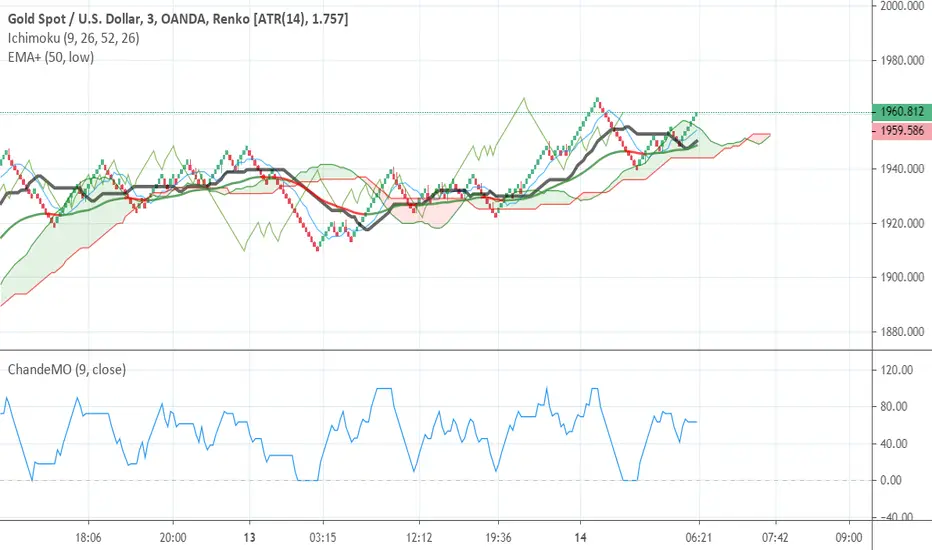
Chande Momentum Oscillator - Fixed (0,100)I just did little trick to change the old scale to (0,100)
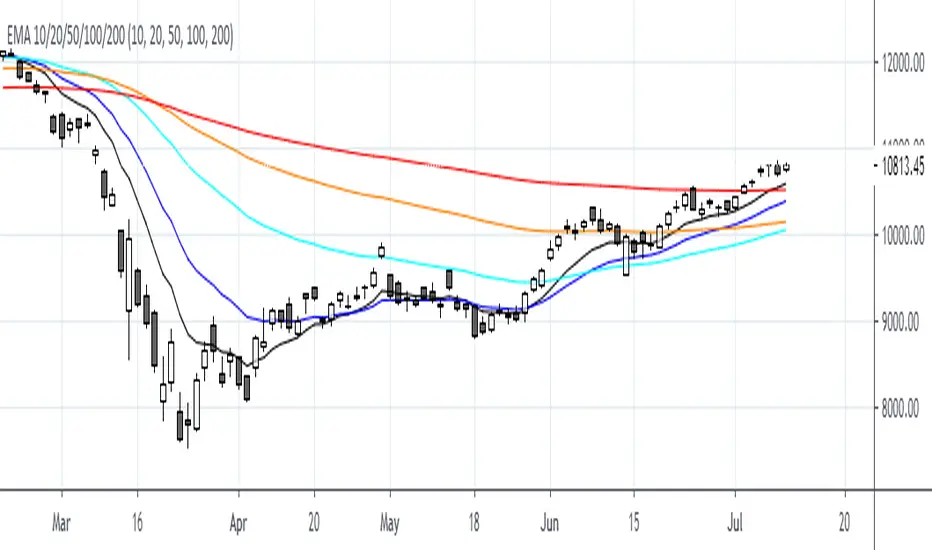
EMA 10/20/50/100/200First Thank you very much "TradingView" for providing such a Wonderful plateform.
Also very thankful to all TradingView's known & unknown authors who provides superb learnings.
EMA 10/20/50/100/200
EMA 20/100/200 alwaysThis script will always show the EMA 20/100/200 daily values across any time frame chart (e.g. showing daily 20 EMA while viewing the 5 minute chart)

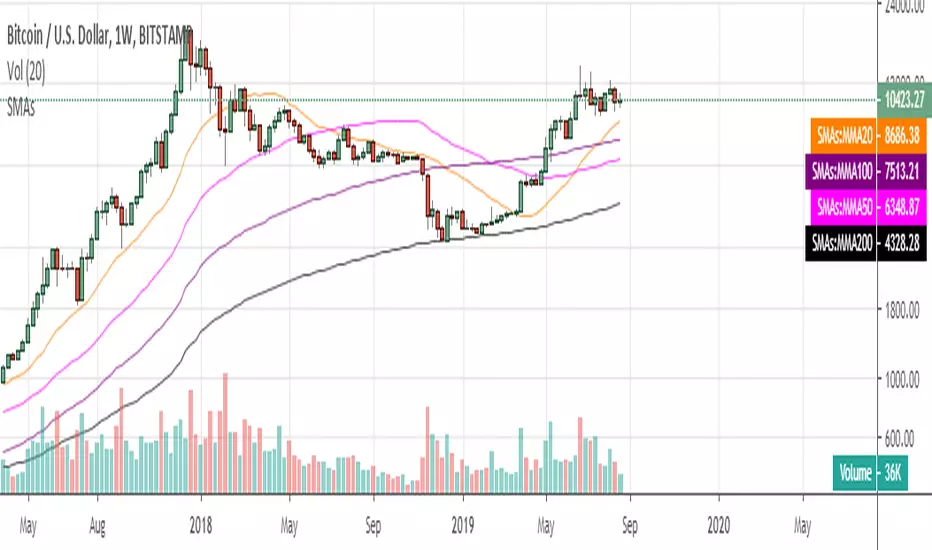
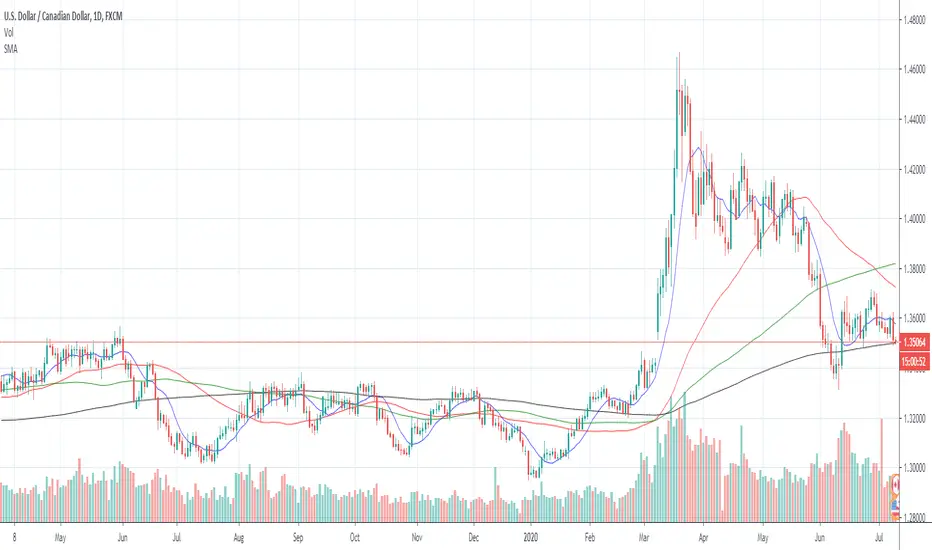
SMA price-based 20 SMA 100 SMA 200Three Simple Moving Averages to detect changes in short time frame direction as well longer time frame swing movements.
sma 20 based on price - Two colors. Green if closing price is above the 20 sma. Red if closing price is below 20 sma.
sma 100
sma 200

sma 50 100 200 multi Timframes actual daily weekly monthlysma 50-100-200
Just 3 sma from actual,daily,weekly and monthly timeframe
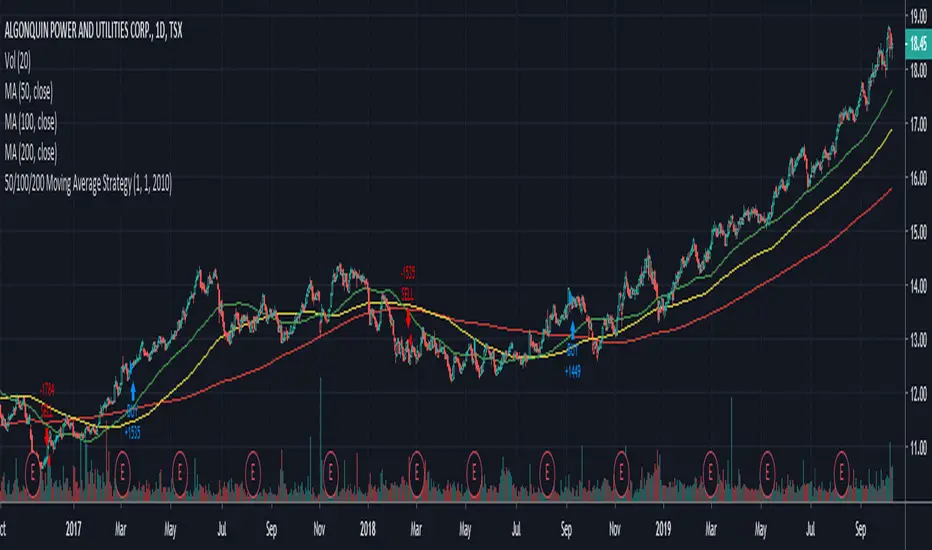
Easy to Use 50/100/200 Day Moving Average StrategyWhenever you see someone publish a chart or idea, what's the one thing you almost always see? Moving Averages!
Many investors focus on these indictors solely as entry and exit points, so here's an easy to manipulate strategy to backtest and see if this is feasible on your security.
CODE VARIABLES
LINE 2 - Here you can change your currency and amount you want to invest on each entry.
LINE 8/9/10 - Here we establish the 50 (Fast), 100 (Medium) and 200 (Slow) day variables. These can be adjusted to your choosing.
LINE 13/14/15 - Here we establish what date we want to start backtesting from. Simple change the defval on each line to change the date (In the code below we start on Jan 1st, 2010).
LINE 20/23 - Here, within the crossover and crossunder functions, we set which MA's must cross to enter and exit a trade. Below we have the 50 day moving above and under the 200 day. Simple change the variables to FastMA, MediumMA and SlowMA to your choosing.
NOTE: As a beginner you may not want to short stock, therefore LINE 5 was added to only allow long positions.
Hope this helps, from one beginner to another.
Cheers!
SMA 21/30/50/100/200 with Cross by DragonByteCombines several key simple moving averages into one slot without going overboard. Includes cross indicators between the 50/100 and the 50/200 day SMA's.

4 EMAs With Colors(100,300,600,1000)+ichimoku Cloud4 EMAs With Colors(100,300,600,1000) To detect trend
+ichimoku Cloud to have successful trading
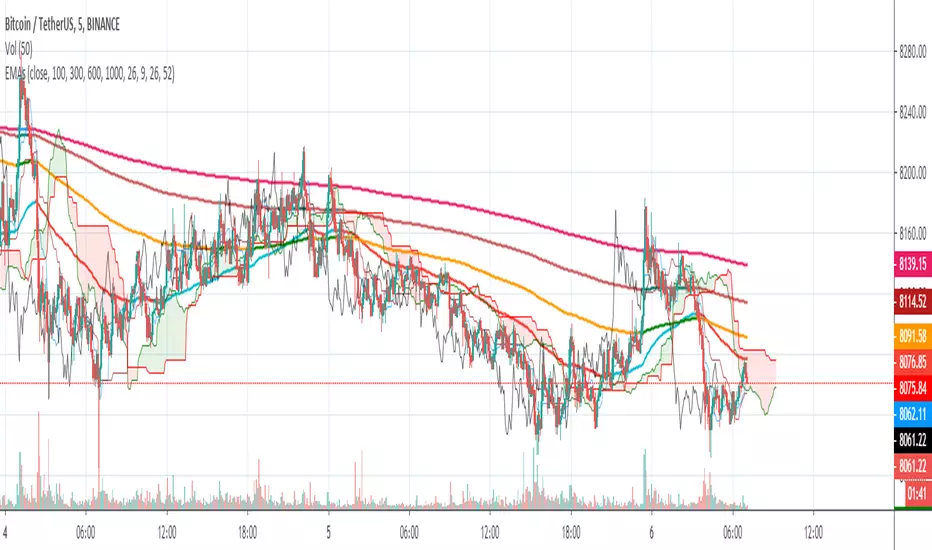
4 Exponential Moving Averages With Colors(100,300,600,1000)4 Exponential Moving Averages With Colors(100,300,600,1000) With Colors
To play with Scalper,Swing, intraday

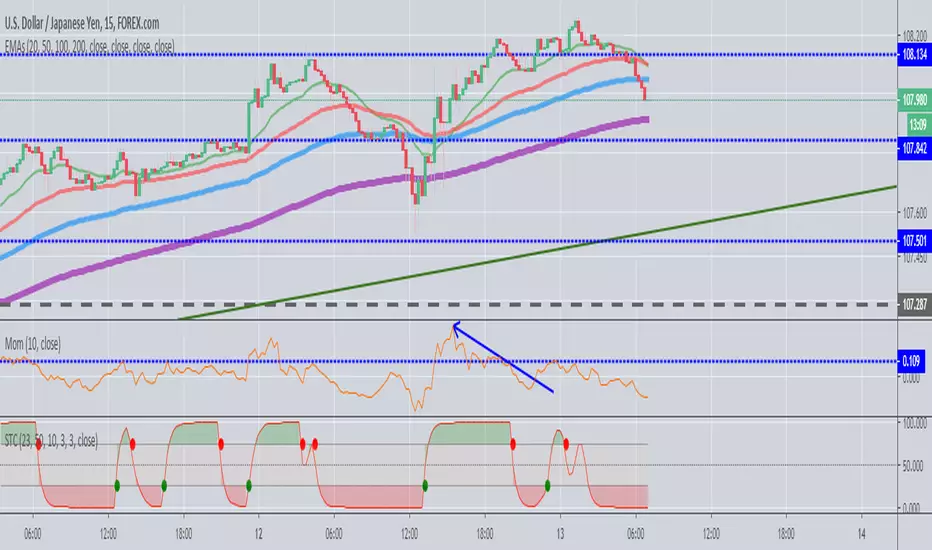
EMAs (20,50,100,200)Ability to plot EMAs (20,50,100,200) in single indicator and can be tweaked according to your trading style.