Crypto Leverage Ratio [Market Cap / Open Interest in %]This indicator calculates what percentage of market cap data corresponds to open interest data.
Leverage Ratio = 1/(Market Cap / 100 * Open Interest)
Market Cap data comes from TradingView -> CRYPTOCAP:YOURCOINSYMBOL
Open Interest data comes from IntoTheBlock -> INTOTHEBLOCK:YOURCOINSYMBOL_PERPETUALOPENINTEREST
IntoTheBlock refresh perpetual data at the end of the day. It means there is no intraday data.
It can only be used in Daily or higher time intervals.
This indicator and any other indicator can not precisely calculate real leverage ratio except exchanges itself. This calculation is just based on assumption.
You can see the exact same result by just adding:
1/(CRYPTOCAP:BTC/100*INTOTHEBLOCK:BTC_PERPETUALOPENINTEREST)
to your symbol search, if your chart is a BTC chart.
"
The Futures Open Interest Leverage Ratio is calculated by dividing the market open contract value, by the market cap of the asset (presented as %). This returns an estimate of the degree of leverage that exists relative to market size as a gauge for whether derivatives markets are a source of deleveraging risk.
High Values indicate that futures market open interest is large relative to the market size. This increases the risk of a short/long squeeze, deleveraging event, or liquidation cascade.
Low Values indicate that futures market open interest is small relative to the market size. This is generally coincident with a lower risk of derivative led forced buying/selling and volatility.
Deleveraging Events such as short/long squeezes, or liquidation cascades can be identified by rapid declines in OI relative to market cap, and vertical drops in the metric.
-glassnode
"
says glassnode. I think it is more than that. Especially with MAs.
Cari dalam skrip untuk "想象图:箱线图+折线组合,横轴为国家,纵轴为响应指数(0-100),箱线显示均值±标准差,叠加红色虚线标注各国确诊高峰时间点"

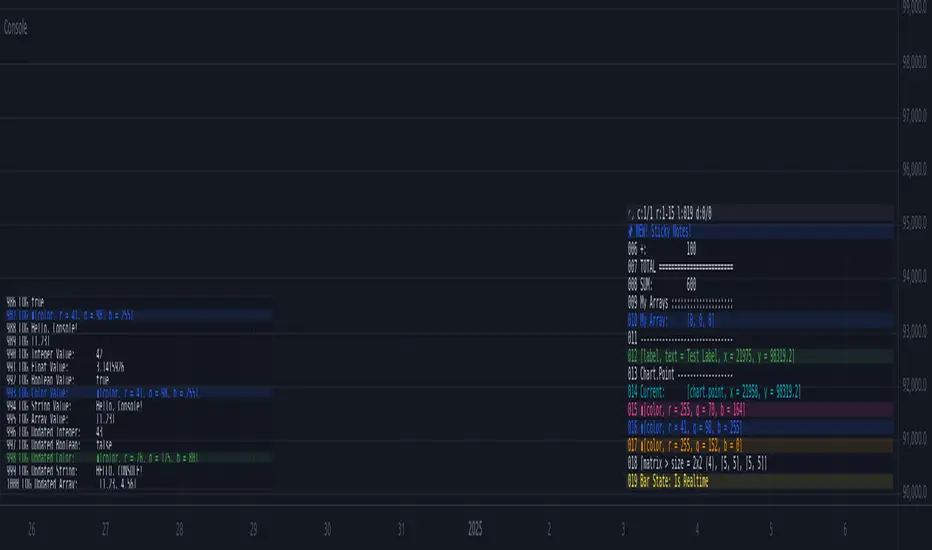
Console📕 Console Library
🔷 Introduction
This script is an adaptation of the classic JavaScript console script. It provides a simple way to display data in a console-like table format for debugging purposes.
While there are many nice console/logger scripts out there, my personal goal was to achieve inline functionality and visual object (label, lines) logging .
🔷 How to Use
◼ 1. Import the Console library into your script:
import cryptolinx/Console/1
- or -
Instead of the library namespace, you can define a custom namespace as alias.
import cryptolinx/Console/1 as c
◼ 2. Create and init a new `` object.
The `init()` method is used to initialize the console object with default settings. It can be used to customize it.
// When using the `var` keyword in a declaration, the logs will act as ever-forwarding.
// Without `var`, the `console` variable will be redeclared every time `bar` is called.
// var console = Console.terminal.new(log_position=position.bottom_left, prefix = '> ', show_no = true)
- or -
If you has set up an alias before.
var console = c.terminal.new().init()
◼ 3. Logging
// inline ✨
array testArray = array.new(3, .0).log(console)
// basic
console.log(testArray)
// inline ✨
var testLabel = label.new(bar_index, close, 'Label Text').log(console)
// basic
console.log(testLabel)
// It is also possible to use `().` for literals ✨.
int a = 100
testCalc = (5 * 100).log(console) + a.log(console) // SUM: 600
console.
.empty()
.log('SUM' + WS + testCalc.tostring())
◼ 4. Visibility
Finally, we need to call the `show()` method to display the logged messages in the console.
console.show(true) // True by default. Simply turn it on or off
Branch CurveLibrary "branch"
Generates a branch made of segments with a starting angle
and a turning angle for each segment. The branch is generated from a starting point
and a number of nodes to generate. The length of each segment and angle of each segment
can be adjusted. The branch can be generated in 2D or 3D, render as you wish.
method branch(origin, nodes, segment_length, segment_growth, angle_start, angle_turn)
# Branch Generation.
- `origin`: CommonTypesMath.Vector3 - The starting point of the branch. If the z value is not zero, it will be used as the starting angle.
- `nodes`: int - The number of nodes to generate.
- `segment_length`: float - The length of each segment.
- `segment_growth`: float - The growth of each segment. 0 = no growth, 100 = double the length of the previous segment.
- `angle_start`: float - The starting angle of the branch in degrees.
- `angle_turn`: float - The turning angle of each segment in degrees.
Namespace types: CommonTypesMath.Vector3
Parameters:
origin (Vector3 type from RicardoSantos/CommonTypesMath/1) : The starting point of the branch. If the z value is not zero, it will be used as the starting angle.
nodes (int) : The number of nodes to generate.
segment_length (float) : The length of each segment.
segment_growth (float) : The growth of each segment. 0 = no growth, 100 = double the length of the previous segment.
angle_start (float) : The starting angle of the branch in degrees.
angle_turn (float) : The turning angle of each segment in degrees.
@return segments The list of segments that make up the branch.

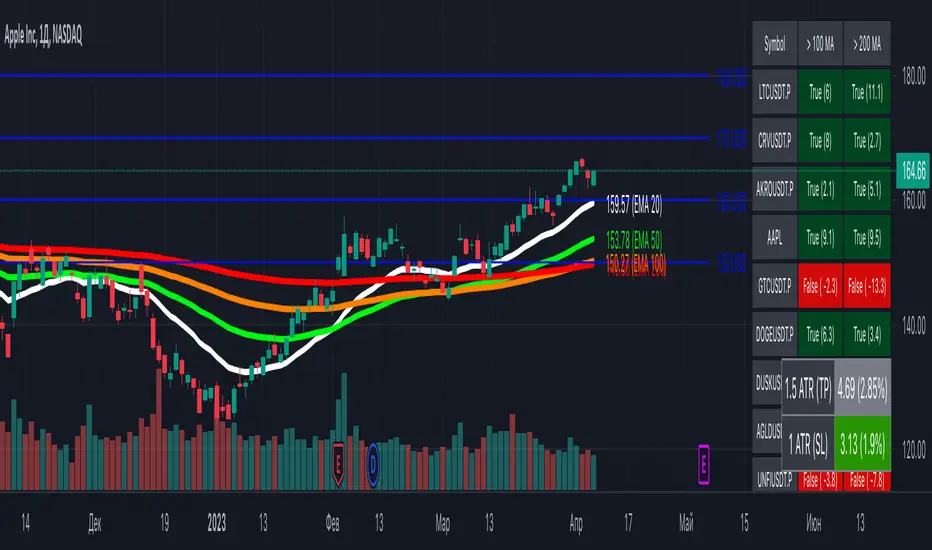
[MiV] MA Screener v1.0In my trading I stick to the following strategy: I buy an asset above the 100/200 moving average and then sell it.
The most problematic thing in all this is to look for assets that are above the 100 or 200 moving average, and to assess how "far" the price is from that moving average.
In fact, to solve this problem I created this indicator.
It works with 30 different assets and displays the state of its two moving averages, whether the price is higher or not, and how much higher the price is from that level.
WillyCycle Oscillator&DoubleMa/ErkOzi/version 2This oscillator can be customized by adjusting the length of the Willy period, the length of Willy's EMA, and the upper and lower bands. The upper and lower bands help traders identify overbought and oversold conditions.
The WillyCycle Oscillator is a technical analysis tool used to measure the momentum of an asset and identify overbought and oversold conditions based on the price range of a specific period and calculating the percentage of the closing price in that range. The WillyCycle Oscillator consists of two main components: Willy and Willy's EMA. The Willy component is the percentage calculation of the asset's price range, and Willy's EMA is the exponential moving average of the Willy component. Willy's EMA is used to smooth out the Willy component and make it easier to identify trends.
*** When the oscillator is above the 80 level, it indicates that the asset is overbought, and when it is below the 20 level, it indicates that the asset is oversold. Traders can use these levels as a guide for buying and selling signals.
***Traders can also use the WillyCycle Oscillator to identify trend reversals. When the oscillator rises above the 50 level, it signals a potential uptrend, and when it falls below the 50 level, it signals a potential downtrend.
***I have added a smoothed line option to the WillyCycle Oscillator, which allows traders to see a more smoothed version of the oscillator. This option can be enabled by setting the 'smoothed' input to true. The default value for the smoothed line is 15.
***We have also changed the value range of the WillyCycle Oscillator from -100 to 100 to 0 to 100. This change was made to make the oscillator more user-friendly and easier to read.
In conclusion, the WillyCycle Oscillator is a versatile tool that can help traders identify potential trading opportunities and trend reversals. Traders can customize the oscillator to fit their trading style and preferences. Adding a smoothed line and changing the value range can enhance the user experience and make the oscillator easier to use.

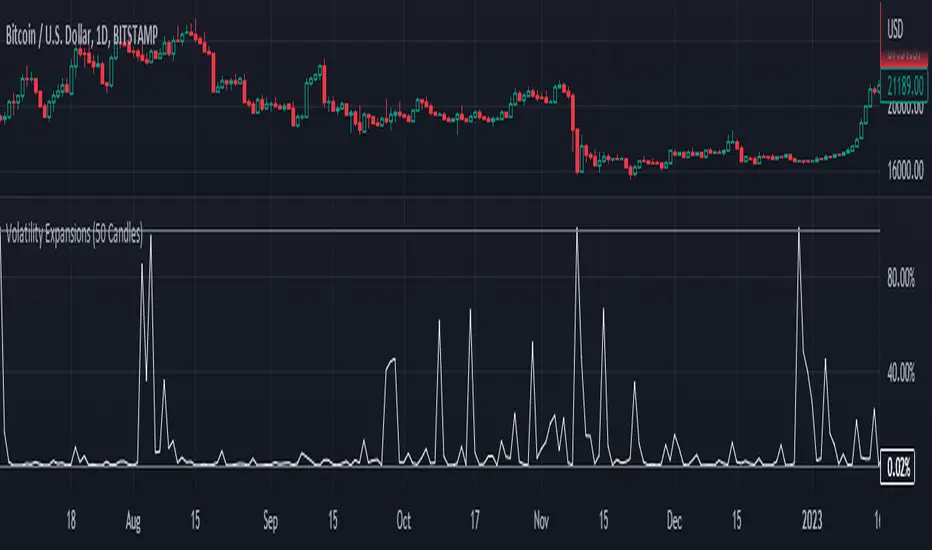
Fixed Volatility OscillatorA fixed volatility plotter set to a 0-100 range - Plots the current volatility % using the formula to calculate volatility and stdev (standard deviation) based on the candle lookback.
The indicator is Fixed, which means that regardless of the chart, the volatility will be plotted on a percentage of 0% - 100% with a 101% threshold set to indicate a volatility reset. While the volume of volatility will change depending on the chart, the volatility will ALWAYS stay within this range.
if a plot exceeds 100% it should be marked as volatility reset - not an expansion
and should also be noted that the volatility spikes are also very inconsistent in volume and vary greatly.
The candle lookbacks on standard are organized be from 10 candles to 100 candles. I found the best results using the 50 candles lookback, and therefore have set it as the default value. These different values can be used to pull the information from the # of candles on the selected option - and therefore the volatility will be calculated from the number of candles selected.
// note for other people versed in pinescript
While this indicator may be useful in trading or strategies, it is more meant to incorporated into other scripts or used as a basis that can be further expanded on. The visuals are not built at all - for that purpose.
This script has not been listed as a library for the fact that it can be used as an actual indicator within a strategy - hope you enjoy.
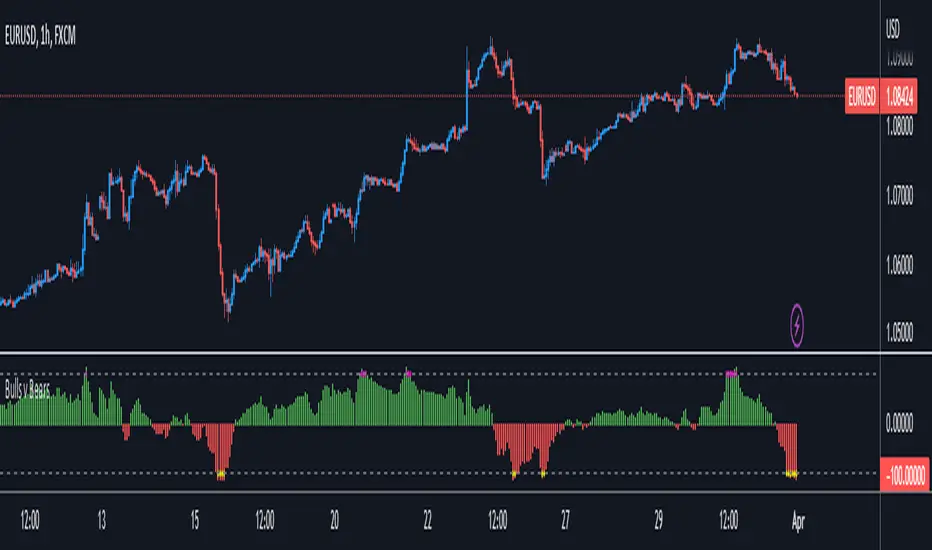
Bulls v BearsThis script helps you identify the relative strength of bulls and bears in the market. It calculates the difference between the high and the moving average for bulls, and the difference between the moving average and the low for bears. Then it normalizes the values between -100 and 100 using the highest and lowest values of the last "bars back" periods. This allows you to compare the current strength of bulls and bears relative to their historical strength.
The output of the script is a colored column chart that represents the difference between the normalized bulls and bears values. If the chart is mostly green, it means the bulls are currently stronger than the bears, and vice versa for a mostly red chart. Additionally, the script provides bullish and bearish signals based on when the normalized bulls cross above or below the user-defined "Line Height" value.
You can use this script to help you identify potential trend changes in the market, as well as to confirm existing trends.
MomentumIndicatorsLibrary "MomentumIndicators"
This is a library of 'Momentum Indicators', also denominated as oscillators.
The purpose of this library is to organize momentum indicators in just one place, making it easy to access.
In addition, it aims to allow customized versions, not being restricted to just the price value.
An example of this use case is the popular Stochastic RSI.
# Indicators:
1. Relative Strength Index (RSI):
Measures the relative strength of recent price gains to recent price losses of an asset.
2. Rate of Change (ROC):
Measures the percentage change in price of an asset over a specified time period.
3. Stochastic Oscillator (Stoch):
Compares the current price of an asset to its price range over a specified time period.
4. True Strength Index (TSI):
Measures the price change, calculating the ratio of the price change (positive or negative) in relation to the
absolute price change.
The values of both are smoothed twice to reduce noise, and the final result is normalized
in a range between 100 and -100.
5. Stochastic Momentum Index (SMI):
Combination of the True Strength Index with a signal line to help identify turning points in the market.
6. Williams Percent Range (Williams %R):
Compares the current price of an asset to its highest high and lowest low over a specified time period.
7. Commodity Channel Index (CCI):
Measures the relationship between an asset's current price and its moving average.
8. Ultimate Oscillator (UO):
Combines three different time periods to help identify possible reversal points.
9. Moving Average Convergence/Divergence (MACD):
Shows the difference between short-term and long-term exponential moving averages.
10. Fisher Transform (FT):
Normalize prices into a Gaussian normal distribution.
11. Inverse Fisher Transform (IFT):
Transform the values of the Fisher Transform into a smaller and more easily interpretable scale is through the
application of an inverse transformation to the hyperbolic tangent function.
This transformation takes the values of the FT, which range from -infinity to +infinity, to a scale limited
between -1 and +1, allowing them to be more easily visualized and compared.
12. Premier Stochastic Oscillator (PSO):
Normalizes the standard stochastic oscillator by applying a five-period double exponential smoothing average of
the %K value, resulting in a symmetric scale of 1 to -1
# Indicators of indicators:
## Stochastic:
1. Stochastic of RSI (Relative Strengh Index)
2. Stochastic of ROC (Rate of Change)
3. Stochastic of UO (Ultimate Oscillator)
4. Stochastic of TSI (True Strengh Index)
5. Stochastic of Williams R%
6. Stochastic of CCI (Commodity Channel Index).
7. Stochastic of MACD (Moving Average Convergence/Divergence)
8. Stochastic of FT (Fisher Transform)
9. Stochastic of Volume
10. Stochastic of MFI (Money Flow Index)
11. Stochastic of On OBV (Balance Volume)
12. Stochastic of PVI (Positive Volume Index)
13. Stochastic of NVI (Negative Volume Index)
14. Stochastic of PVT (Price-Volume Trend)
15. Stochastic of VO (Volume Oscillator)
16. Stochastic of VROC (Volume Rate of Change)
## Inverse Fisher Transform:
1.Inverse Fisher Transform on RSI (Relative Strengh Index)
2.Inverse Fisher Transform on ROC (Rate of Change)
3.Inverse Fisher Transform on UO (Ultimate Oscillator)
4.Inverse Fisher Transform on Stochastic
5.Inverse Fisher Transform on TSI (True Strength Index)
6.Inverse Fisher Transform on CCI (Commodity Channel Index)
7.Inverse Fisher Transform on Fisher Transform (FT)
8.Inverse Fisher Transform on MACD (Moving Average Convergence/Divergence)
9.Inverse Fisher Transfor on Williams R% (Williams Percent Range)
10.Inverse Fisher Transfor on CMF (Chaikin Money Flow)
11.Inverse Fisher Transform on VO (Volume Oscillator)
12.Inverse Fisher Transform on VROC (Volume Rate of Change)
## Stochastic Momentum Index:
1.Stochastic Momentum Index of RSI (Relative Strength Index)
2.Stochastic Momentum Index of ROC (Rate of Change)
3.Stochastic Momentum Index of VROC (Volume Rate of Change)
4.Stochastic Momentum Index of Williams R% (Williams Percent Range)
5.Stochastic Momentum Index of FT (Fisher Transform)
6.Stochastic Momentum Index of CCI (Commodity Channel Index)
7.Stochastic Momentum Index of UO (Ultimate Oscillator)
8.Stochastic Momentum Index of MACD (Moving Average Convergence/Divergence)
9.Stochastic Momentum Index of Volume
10.Stochastic Momentum Index of MFI (Money Flow Index)
11.Stochastic Momentum Index of CMF (Chaikin Money Flow)
12.Stochastic Momentum Index of On Balance Volume (OBV)
13.Stochastic Momentum Index of Price-Volume Trend (PVT)
14.Stochastic Momentum Index of Volume Oscillator (VO)
15.Stochastic Momentum Index of Positive Volume Index (PVI)
16.Stochastic Momentum Index of Negative Volume Index (NVI)
## Relative Strength Index:
1. RSI for Volume
2. RSI for Moving Average
rsi(source, length)
RSI (Relative Strengh Index). Measures the relative strength of recent price gains to recent price losses of an asset.
Parameters:
source : (float) Source of series (close, high, low, etc.)
length : (int) Period of loopback
Returns: (float) Series of RSI
roc(source, length)
ROC (Rate of Change). Measures the percentage change in price of an asset over a specified time period.
Parameters:
source : (float) Source of series (close, high, low, etc.)
length : (int) Period of loopback
Returns: (float) Series of ROC
stoch(kLength, kSmoothing, dSmoothing, maTypeK, maTypeD, almaOffsetKD, almaSigmaKD, lsmaOffSetKD)
Stochastic Oscillator. Compares the current price of an asset to its price range over a specified time period.
Parameters:
kLength
kSmoothing : (int) Period for smoothig stochastic
dSmoothing : (int) Period for signal (moving average of stochastic)
maTypeK : (int) Type of Moving Average for Stochastic Oscillator
maTypeD : (int) Type of Moving Average for Stochastic Oscillator Signal
almaOffsetKD : (float) Offset for Arnaud Legoux Moving Average for Oscillator and Signal
almaSigmaKD : (float) Sigma for Arnaud Legoux Moving Average for Oscillator and Signal
lsmaOffSetKD : (int) Offset for Least Squares Moving Average for Oscillator and Signal
Returns: A tuple of Stochastic Oscillator and Moving Average of Stochastic Oscillator
stoch(source, kLength, kSmoothing, dSmoothing, maTypeK, maTypeD, almaOffsetKD, almaSigmaKD, lsmaOffSetKD)
Stochastic Oscillator. Customized source. Compares the current price of an asset to its price range over a specified time period.
Parameters:
source : (float) Source of series (close, high, low, etc.)
kLength : (int) Period of loopback to calculate the stochastic
kSmoothing : (int) Period for smoothig stochastic
dSmoothing : (int) Period for signal (moving average of stochastic)
maTypeK : (int) Type of Moving Average for Stochastic Oscillator
maTypeD : (int) Type of Moving Average for Stochastic Oscillator Signal
almaOffsetKD : (float) Offset for Arnaud Legoux Moving Average for Stoch and Signal
almaSigmaKD : (float) Sigma for Arnaud Legoux Moving Average for Stoch and Signal
lsmaOffSetKD : (int) Offset for Least Squares Moving Average for Stoch and Signal
Returns: A tuple of Stochastic Oscillator and Moving Average of Stochastic Oscillator
tsi(source, shortLength, longLength, maType, almaOffset, almaSigma, lsmaOffSet)
TSI (True Strengh Index). Measures the price change, calculating the ratio of the price change (positive or negative) in relation to the absolute price change.
The values of both are smoothed twice to reduce noise, and the final result is normalized in a range between 100 and -100.
Parameters:
source : (float) Source of series (close, high, low, etc.)
shortLength : (int) Short length
longLength : (int) Long length
maType : (int) Type of Moving Average for TSI
almaOffset : (float) Offset for Arnaud Legoux Moving Average
almaSigma : (float) Sigma for Arnaud Legoux Moving Average
lsmaOffSet : (int) Offset for Least Squares Moving Average
Returns: (float) TSI
smi(sourceTSI, shortLengthTSI, longLengthTSI, maTypeTSI, almaOffsetTSI, almaSigmaTSI, lsmaOffSetTSI, maTypeSignal, smoothingLengthSignal, almaOffsetSignal, almaSigmaSignal, lsmaOffSetSignal)
SMI (Stochastic Momentum Index). A TSI (True Strengh Index) plus a signal line.
Parameters:
sourceTSI : (float) Source of series for TSI (close, high, low, etc.)
shortLengthTSI : (int) Short length for TSI
longLengthTSI : (int) Long length for TSI
maTypeTSI : (int) Type of Moving Average for Signal of TSI
almaOffsetTSI : (float) Offset for Arnaud Legoux Moving Average
almaSigmaTSI : (float) Sigma for Arnaud Legoux Moving Average
lsmaOffSetTSI : (int) Offset for Least Squares Moving Average
maTypeSignal
smoothingLengthSignal
almaOffsetSignal
almaSigmaSignal
lsmaOffSetSignal
Returns: A tuple with TSI, signal of TSI and histogram of difference
wpr(source, length)
Williams R% (Williams Percent Range). Compares the current price of an asset to its highest high and lowest low over a specified time period.
Parameters:
source : (float) Source of series (close, high, low, etc.)
length : (int) Period of loopback
Returns: (float) Series of Williams R%
cci(source, length, maType, almaOffset, almaSigma, lsmaOffSet)
CCI (Commodity Channel Index). Measures the relationship between an asset's current price and its moving average.
Parameters:
source : (float) Source of series (close, high, low, etc.)
length : (int) Period of loopback
maType : (int) Type of Moving Average
almaOffset : (float) Offset for Arnaud Legoux Moving Average
almaSigma : (float) Sigma for Arnaud Legoux Moving Average
lsmaOffSet : (int) Offset for Least Squares Moving Average
Returns: (float) Series of CCI
ultimateOscillator(fastLength, middleLength, slowLength)
UO (Ultimate Oscilator). Combines three different time periods to help identify possible reversal points.
Parameters:
fastLength : (int) Fast period of loopback
middleLength : (int) Middle period of loopback
slowLength : (int) Slow period of loopback
Returns: (float) Series of Ultimate Oscilator
ultimateOscillator(source, fastLength, middleLength, slowLength)
UO (Ultimate Oscilator). Customized source. Combines three different time periods to help identify possible reversal points.
Parameters:
source : (float) Source of series (close, high, low, etc.)
fastLength : (int) Fast period of loopback
middleLength : (int) Middle period of loopback
slowLength : (int) Slow period of loopback
Returns: (float) Series of Ultimate Oscilator
macd(source, fastLength, slowLength, signalLength, maTypeFast, maTypeSlow, maTypeMACD, almaOffset, almaSigma, lsmaOffSet)
MACD (Moving Average Convergence/Divergence). Shows the difference between short-term and long-term exponential moving averages.
Parameters:
source : (float) Source of series (close, high, low, etc.)
fastLength : (int) Period for fast moving average
slowLength : (int) Period for slow moving average
signalLength : (int) Signal length
maTypeFast : (int) Type of fast moving average
maTypeSlow : (int) Type of slow moving average
maTypeMACD : (int) Type of MACD moving average
almaOffset : (float) Offset for Arnaud Legoux Moving Average
almaSigma : (float) Sigma for Arnaud Legoux Moving Average
lsmaOffSet : (int) Offset for Least Squares Moving Average
Returns: A tuple with MACD, Signal, and Histgram
fisher(length)
Fisher Transform. Normalize prices into a Gaussian normal distribution.
Parameters:
length
Returns: A tuple with Fisher Transform and signal
fisher(source, length)
Fisher Transform. Customized source. Normalize prices into a Gaussian normal distribution.
Parameters:
source : (float) Source of series (close, high, low, etc.)
length
Returns: A tuple with Fisher Transform and signal
inverseFisher(source, length, subtrahend, denominator)
Inverse Fisher Transform.
Transform the values of the Fisher Transform into a smaller and more easily interpretable scale is
through the application of an inverse transformation to the hyperbolic tangent function.
This transformation takes the values of the FT, which range from -infinity to +infinity,
to a scale limited between -1 and +1, allowing them to be more easily visualized and compared.
Parameters:
source : (float) Source of series (close, high, low, etc.)
length : (int) Period for loopback
subtrahend : (int) Denominator. Useful in unbounded indicators. For example, in CCI.
denominator
Returns: (float) Series of Inverse Fisher Transform
premierStoch(length, smoothlen)
Premier Stochastic Oscillator (PSO).
Normalizes the standard stochastic oscillator by applying a five-period double exponential smoothing
average of the %K value, resulting in a symmetric scale of 1 to -1.
Parameters:
length : (int) Period for loopback
smoothlen : (int) Period for smoothing
Returns: (float) Series of PSO
premierStoch(source, smoothlen, subtrahend, denominator)
Premier Stochastic Oscillator (PSO) of custom source.
Normalizes the source by applying a five-period double exponential smoothing average.
Parameters:
source : (float) Source of series (close, high, low, etc.)
smoothlen : (int) Period for smoothing
subtrahend : (int) Denominator. Useful in unbounded indicators. For example, in CCI.
denominator
Returns: (float) Series of PSO
stochRsi(sourceRSI, lengthRSI, kLength, kSmoothing, dSmoothing, maTypeK, maTypeD, almaOffsetKD, almaSigmaKD, lsmaOffSetKD)
Parameters:
sourceRSI
lengthRSI
kLength
kSmoothing
dSmoothing
maTypeK
maTypeD
almaOffsetKD
almaSigmaKD
lsmaOffSetKD
stochRoc(sourceROC, lengthROC, kLength, kSmoothing, dSmoothing, maTypeK, maTypeD, almaOffsetKD, almaSigmaKD, lsmaOffSetKD)
Parameters:
sourceROC
lengthROC
kLength
kSmoothing
dSmoothing
maTypeK
maTypeD
almaOffsetKD
almaSigmaKD
lsmaOffSetKD
stochUO(fastLength, middleLength, slowLength, kLength, kSmoothing, dSmoothing, maTypeK, maTypeD, almaOffsetKD, almaSigmaKD, lsmaOffSetKD)
Parameters:
fastLength
middleLength
slowLength
kLength
kSmoothing
dSmoothing
maTypeK
maTypeD
almaOffsetKD
almaSigmaKD
lsmaOffSetKD
stochTSI(source, shortLength, longLength, maType, almaOffset, almaSigma, lsmaOffSet, kLength, kSmoothing, dSmoothing, maTypeK, maTypeD, almaOffsetKD, almaSigmaKD, lsmaOffSetKD)
Parameters:
source
shortLength
longLength
maType
almaOffset
almaSigma
lsmaOffSet
kLength
kSmoothing
dSmoothing
maTypeK
maTypeD
almaOffsetKD
almaSigmaKD
lsmaOffSetKD
stochWPR(source, length, kLength, kSmoothing, dSmoothing, maTypeK, maTypeD, almaOffsetKD, almaSigmaKD, lsmaOffSetKD)
Parameters:
source
length
kLength
kSmoothing
dSmoothing
maTypeK
maTypeD
almaOffsetKD
almaSigmaKD
lsmaOffSetKD
stochCCI(source, length, maType, almaOffset, almaSigma, lsmaOffSet, kLength, kSmoothing, dSmoothing, maTypeK, maTypeD, almaOffsetKD, almaSigmaKD, lsmaOffSetKD)
Parameters:
source
length
maType
almaOffset
almaSigma
lsmaOffSet
kLength
kSmoothing
dSmoothing
maTypeK
maTypeD
almaOffsetKD
almaSigmaKD
lsmaOffSetKD
stochMACD(source, fastLength, slowLength, signalLength, maTypeFast, maTypeSlow, maTypeMACD, almaOffset, almaSigma, lsmaOffSet, kLength, kSmoothing, dSmoothing, maTypeK, maTypeD, almaOffsetKD, almaSigmaKD, lsmaOffSetKD)
Parameters:
source
fastLength
slowLength
signalLength
maTypeFast
maTypeSlow
maTypeMACD
almaOffset
almaSigma
lsmaOffSet
kLength
kSmoothing
dSmoothing
maTypeK
maTypeD
almaOffsetKD
almaSigmaKD
lsmaOffSetKD
stochFT(length, kLength, kSmoothing, dSmoothing, maTypeK, maTypeD, almaOffsetKD, almaSigmaKD, lsmaOffSetKD)
Parameters:
length
kLength
kSmoothing
dSmoothing
maTypeK
maTypeD
almaOffsetKD
almaSigmaKD
lsmaOffSetKD
stochVolume(kLength, kSmoothing, dSmoothing, maTypeK, maTypeD, almaOffsetKD, almaSigmaKD, lsmaOffSetKD)
Parameters:
kLength
kSmoothing
dSmoothing
maTypeK
maTypeD
almaOffsetKD
almaSigmaKD
lsmaOffSetKD
stochMFI(source, length, kLength, kSmoothing, dSmoothing, maTypeK, maTypeD, almaOffsetKD, almaSigmaKD, lsmaOffSetKD)
Parameters:
source
length
kLength
kSmoothing
dSmoothing
maTypeK
maTypeD
almaOffsetKD
almaSigmaKD
lsmaOffSetKD
stochOBV(source, kLength, kSmoothing, dSmoothing, maTypeK, maTypeD, almaOffsetKD, almaSigmaKD, lsmaOffSetKD)
Parameters:
source
kLength
kSmoothing
dSmoothing
maTypeK
maTypeD
almaOffsetKD
almaSigmaKD
lsmaOffSetKD
stochPVI(source, kLength, kSmoothing, dSmoothing, maTypeK, maTypeD, almaOffsetKD, almaSigmaKD, lsmaOffSetKD)
Parameters:
source
kLength
kSmoothing
dSmoothing
maTypeK
maTypeD
almaOffsetKD
almaSigmaKD
lsmaOffSetKD
stochNVI(source, kLength, kSmoothing, dSmoothing, maTypeK, maTypeD, almaOffsetKD, almaSigmaKD, lsmaOffSetKD)
Parameters:
source
kLength
kSmoothing
dSmoothing
maTypeK
maTypeD
almaOffsetKD
almaSigmaKD
lsmaOffSetKD
stochPVT(source, kLength, kSmoothing, dSmoothing, maTypeK, maTypeD, almaOffsetKD, almaSigmaKD, lsmaOffSetKD)
Parameters:
source
kLength
kSmoothing
dSmoothing
maTypeK
maTypeD
almaOffsetKD
almaSigmaKD
lsmaOffSetKD
stochVO(shortLen, longLen, maType, almaOffset, almaSigma, lsmaOffSet, kLength, kSmoothing, dSmoothing, maTypeK, maTypeD, almaOffsetKD, almaSigmaKD, lsmaOffSetKD)
Parameters:
shortLen
longLen
maType
almaOffset
almaSigma
lsmaOffSet
kLength
kSmoothing
dSmoothing
maTypeK
maTypeD
almaOffsetKD
almaSigmaKD
lsmaOffSetKD
stochVROC(length, kLength, kSmoothing, dSmoothing, maTypeK, maTypeD, almaOffsetKD, almaSigmaKD, lsmaOffSetKD)
Parameters:
length
kLength
kSmoothing
dSmoothing
maTypeK
maTypeD
almaOffsetKD
almaSigmaKD
lsmaOffSetKD
iftRSI(sourceRSI, lengthRSI, lengthIFT)
Parameters:
sourceRSI
lengthRSI
lengthIFT
iftROC(sourceROC, lengthROC, lengthIFT)
Parameters:
sourceROC
lengthROC
lengthIFT
iftUO(fastLength, middleLength, slowLength, lengthIFT)
Parameters:
fastLength
middleLength
slowLength
lengthIFT
iftStoch(kLength, kSmoothing, dSmoothing, maTypeK, maTypeD, almaOffsetKD, almaSigmaKD, lsmaOffSetKD, lengthIFT)
Parameters:
kLength
kSmoothing
dSmoothing
maTypeK
maTypeD
almaOffsetKD
almaSigmaKD
lsmaOffSetKD
lengthIFT
iftTSI(source, shortLength, longLength, maType, almaOffset, almaSigma, lsmaOffSet, lengthIFT)
Parameters:
source
shortLength
longLength
maType
almaOffset
almaSigma
lsmaOffSet
lengthIFT
iftCCI(source, length, maType, almaOffset, almaSigma, lsmaOffSet, lengthIFT)
Parameters:
source
length
maType
almaOffset
almaSigma
lsmaOffSet
lengthIFT
iftFisher(length, lengthIFT)
Parameters:
length
lengthIFT
iftMACD(source, fastLength, slowLength, signalLength, maTypeFast, maTypeSlow, maTypeMACD, almaOffset, almaSigma, lsmaOffSet, lengthIFT)
Parameters:
source
fastLength
slowLength
signalLength
maTypeFast
maTypeSlow
maTypeMACD
almaOffset
almaSigma
lsmaOffSet
lengthIFT
iftWPR(source, length, lengthIFT)
Parameters:
source
length
lengthIFT
iftMFI(source, length, lengthIFT)
Parameters:
source
length
lengthIFT
iftCMF(length, lengthIFT)
Parameters:
length
lengthIFT
iftVO(shortLen, longLen, maType, almaOffset, almaSigma, lsmaOffSet, lengthIFT)
Parameters:
shortLen
longLen
maType
almaOffset
almaSigma
lsmaOffSet
lengthIFT
iftVROC(length, lengthIFT)
Parameters:
length
lengthIFT
smiRSI(source, length, shortLengthTSI, longLengthTSI, maTypeTSI, almaOffsetTSI, almaSigmaTSI, lsmaOffSetTSI, maTypeSignal, smoothingLengthSignal, almaOffsetSignal, almaSigmaSignal, lsmaOffSetSignal)
Parameters:
source
length
shortLengthTSI
longLengthTSI
maTypeTSI
almaOffsetTSI
almaSigmaTSI
lsmaOffSetTSI
maTypeSignal
smoothingLengthSignal
almaOffsetSignal
almaSigmaSignal
lsmaOffSetSignal
smiROC(source, length, shortLengthTSI, longLengthTSI, maTypeTSI, almaOffsetTSI, almaSigmaTSI, lsmaOffSetTSI, maTypeSignal, smoothingLengthSignal, almaOffsetSignal, almaSigmaSignal, lsmaOffSetSignal)
Parameters:
source
length
shortLengthTSI
longLengthTSI
maTypeTSI
almaOffsetTSI
almaSigmaTSI
lsmaOffSetTSI
maTypeSignal
smoothingLengthSignal
almaOffsetSignal
almaSigmaSignal
lsmaOffSetSignal
smiVROC(length, shortLengthTSI, longLengthTSI, maTypeTSI, almaOffsetTSI, almaSigmaTSI, lsmaOffSetTSI, maTypeSignal, smoothingLengthSignal, almaOffsetSignal, almaSigmaSignal, lsmaOffSetSignal)
Parameters:
length
shortLengthTSI
longLengthTSI
maTypeTSI
almaOffsetTSI
almaSigmaTSI
lsmaOffSetTSI
maTypeSignal
smoothingLengthSignal
almaOffsetSignal
almaSigmaSignal
lsmaOffSetSignal
smiWPR(source, length, shortLengthTSI, longLengthTSI, maTypeTSI, almaOffsetTSI, almaSigmaTSI, lsmaOffSetTSI, maTypeSignal, smoothingLengthSignal, almaOffsetSignal, almaSigmaSignal, lsmaOffSetSignal)
Parameters:
source
length
shortLengthTSI
longLengthTSI
maTypeTSI
almaOffsetTSI
almaSigmaTSI
lsmaOffSetTSI
maTypeSignal
smoothingLengthSignal
almaOffsetSignal
almaSigmaSignal
lsmaOffSetSignal
smiFT(length, shortLengthTSI, longLengthTSI, maTypeTSI, almaOffsetTSI, almaSigmaTSI, lsmaOffSetTSI, maTypeSignal, smoothingLengthSignal, almaOffsetSignal, almaSigmaSignal, lsmaOffSetSignal)
Parameters:
length
shortLengthTSI
longLengthTSI
maTypeTSI
almaOffsetTSI
almaSigmaTSI
lsmaOffSetTSI
maTypeSignal
smoothingLengthSignal
almaOffsetSignal
almaSigmaSignal
lsmaOffSetSignal
smiFT(source, length, shortLengthTSI, longLengthTSI, maTypeTSI, almaOffsetTSI, almaSigmaTSI, lsmaOffSetTSI, maTypeSignal, smoothingLengthSignal, almaOffsetSignal, almaSigmaSignal, lsmaOffSetSignal)
Parameters:
source
length
shortLengthTSI
longLengthTSI
maTypeTSI
almaOffsetTSI
almaSigmaTSI
lsmaOffSetTSI
maTypeSignal
smoothingLengthSignal
almaOffsetSignal
almaSigmaSignal
lsmaOffSetSignal
smiCCI(source, length, maTypeCCI, almaOffsetCCI, almaSigmaCCI, lsmaOffSetCCI, shortLengthTSI, longLengthTSI, maTypeTSI, almaOffsetTSI, almaSigmaTSI, lsmaOffSetTSI, maTypeSignal, smoothingLengthSignal, almaOffsetSignal, almaSigmaSignal, lsmaOffSetSignal)
Parameters:
source
length
maTypeCCI
almaOffsetCCI
almaSigmaCCI
lsmaOffSetCCI
shortLengthTSI
longLengthTSI
maTypeTSI
almaOffsetTSI
almaSigmaTSI
lsmaOffSetTSI
maTypeSignal
smoothingLengthSignal
almaOffsetSignal
almaSigmaSignal
lsmaOffSetSignal
smiUO(fastLength, middleLength, slowLength, shortLengthTSI, longLengthTSI, maTypeTSI, almaOffsetTSI, almaSigmaTSI, lsmaOffSetTSI, maTypeSignal, smoothingLengthSignal, almaOffsetSignal, almaSigmaSignal, lsmaOffSetSignal)
Parameters:
fastLength
middleLength
slowLength
shortLengthTSI
longLengthTSI
maTypeTSI
almaOffsetTSI
almaSigmaTSI
lsmaOffSetTSI
maTypeSignal
smoothingLengthSignal
almaOffsetSignal
almaSigmaSignal
lsmaOffSetSignal
smiMACD(source, fastLength, slowLength, signalLength, maTypeFast, maTypeSlow, maTypeMACD, almaOffset, almaSigma, lsmaOffSet, shortLengthTSI, longLengthTSI, maTypeTSI, almaOffsetTSI, almaSigmaTSI, lsmaOffSetTSI, maTypeSignal, smoothingLengthSignal, almaOffsetSignal, almaSigmaSignal, lsmaOffSetSignal)
Parameters:
source
fastLength
slowLength
signalLength
maTypeFast
maTypeSlow
maTypeMACD
almaOffset
almaSigma
lsmaOffSet
shortLengthTSI
longLengthTSI
maTypeTSI
almaOffsetTSI
almaSigmaTSI
lsmaOffSetTSI
maTypeSignal
smoothingLengthSignal
almaOffsetSignal
almaSigmaSignal
lsmaOffSetSignal
smiVol(shortLengthTSI, longLengthTSI, maTypeTSI, almaOffsetTSI, almaSigmaTSI, lsmaOffSetTSI, maTypeSignal, smoothingLengthSignal, almaOffsetSignal, almaSigmaSignal, lsmaOffSetSignal)
Parameters:
shortLengthTSI
longLengthTSI
maTypeTSI
almaOffsetTSI
almaSigmaTSI
lsmaOffSetTSI
maTypeSignal
smoothingLengthSignal
almaOffsetSignal
almaSigmaSignal
lsmaOffSetSignal
smiMFI(source, length, shortLengthTSI, longLengthTSI, maTypeTSI, almaOffsetTSI, almaSigmaTSI, lsmaOffSetTSI, maTypeSignal, smoothingLengthSignal, almaOffsetSignal, almaSigmaSignal, lsmaOffSetSignal)
Parameters:
source
length
shortLengthTSI
longLengthTSI
maTypeTSI
almaOffsetTSI
almaSigmaTSI
lsmaOffSetTSI
maTypeSignal
smoothingLengthSignal
almaOffsetSignal
almaSigmaSignal
lsmaOffSetSignal
smiCMF(length, shortLengthTSI, longLengthTSI, maTypeTSI, almaOffsetTSI, almaSigmaTSI, lsmaOffSetTSI, maTypeSignal, smoothingLengthSignal, almaOffsetSignal, almaSigmaSignal, lsmaOffSetSignal)
Parameters:
length
shortLengthTSI
longLengthTSI
maTypeTSI
almaOffsetTSI
almaSigmaTSI
lsmaOffSetTSI
maTypeSignal
smoothingLengthSignal
almaOffsetSignal
almaSigmaSignal
lsmaOffSetSignal
smiOBV(source, shortLengthTSI, longLengthTSI, maTypeTSI, almaOffsetTSI, almaSigmaTSI, lsmaOffSetTSI, maTypeSignal, smoothingLengthSignal, almaOffsetSignal, almaSigmaSignal, lsmaOffSetSignal)
Parameters:
source
shortLengthTSI
longLengthTSI
maTypeTSI
almaOffsetTSI
almaSigmaTSI
lsmaOffSetTSI
maTypeSignal
smoothingLengthSignal
almaOffsetSignal
almaSigmaSignal
lsmaOffSetSignal
smiPVT(source, shortLengthTSI, longLengthTSI, maTypeTSI, almaOffsetTSI, almaSigmaTSI, lsmaOffSetTSI, maTypeSignal, smoothingLengthSignal, almaOffsetSignal, almaSigmaSignal, lsmaOffSetSignal)
Parameters:
source
shortLengthTSI
longLengthTSI
maTypeTSI
almaOffsetTSI
almaSigmaTSI
lsmaOffSetTSI
maTypeSignal
smoothingLengthSignal
almaOffsetSignal
almaSigmaSignal
lsmaOffSetSignal
smiVO(shortLen, longLen, maType, almaOffset, almaSigma, lsmaOffSet, shortLengthTSI, longLengthTSI, maTypeTSI, almaOffsetTSI, almaSigmaTSI, lsmaOffSetTSI, maTypeSignal, smoothingLengthSignal, almaOffsetSignal, almaSigmaSignal, lsmaOffSetSignal)
Parameters:
shortLen
longLen
maType
almaOffset
almaSigma
lsmaOffSet
shortLengthTSI
longLengthTSI
maTypeTSI
almaOffsetTSI
almaSigmaTSI
lsmaOffSetTSI
maTypeSignal
smoothingLengthSignal
almaOffsetSignal
almaSigmaSignal
lsmaOffSetSignal
smiPVI(source, shortLengthTSI, longLengthTSI, maTypeTSI, almaOffsetTSI, almaSigmaTSI, lsmaOffSetTSI, maTypeSignal, smoothingLengthSignal, almaOffsetSignal, almaSigmaSignal, lsmaOffSetSignal)
Parameters:
source
shortLengthTSI
longLengthTSI
maTypeTSI
almaOffsetTSI
almaSigmaTSI
lsmaOffSetTSI
maTypeSignal
smoothingLengthSignal
almaOffsetSignal
almaSigmaSignal
lsmaOffSetSignal
smiNVI(source, shortLengthTSI, longLengthTSI, maTypeTSI, almaOffsetTSI, almaSigmaTSI, lsmaOffSetTSI, maTypeSignal, smoothingLengthSignal, almaOffsetSignal, almaSigmaSignal, lsmaOffSetSignal)
Parameters:
source
shortLengthTSI
longLengthTSI
maTypeTSI
almaOffsetTSI
almaSigmaTSI
lsmaOffSetTSI
maTypeSignal
smoothingLengthSignal
almaOffsetSignal
almaSigmaSignal
lsmaOffSetSignal
rsiVolume(length)
Parameters:
length
rsiMA(sourceMA, lengthMA, maType, almaOffset, almaSigma, lsmaOffSet, lengthRSI)
Parameters:
sourceMA
lengthMA
maType
almaOffset
almaSigma
lsmaOffSet
lengthRSI

Colorful Moving Averageswhat is Colorful Moving Averages?
This indicator allows you to use your favorite moving averages in their advanced form.
what it does?
It gives you easy access to the following information with a single indicator: the direction and momentum of the price,
rate of change of momentum (acceleration),
time-dependent change in momentum,
and all the other information a moving average provides.
it paints the selected moving average type according to the momentum it has, and also shows the momentum and acceleration values in a table. colors are interpreted as follows: the color of the moving average is red, the momentum is negative; A green color means the momentum is positive, and a yellow color means the momentum is 0. As the momentum changes, the moving average takes on different shades of these 3 colors. how it actually works can be easily understood at a glance.
"Δ" sign indicates momentum compressed between 100 and -100.
"Γ" sign indicates the momentum of the momentum, that is the acceleration. its values are compressed between 100 and -100.
how it does it?
it uses this formulas:
how to use it?
First, select the moving average type you want to use. then set the length and source. Now, with a single indicator, you can observe both the distance of the price from the mean, its instantaneous momentum relative to the last candle by looking at the symbol "Δ", the current change of momentum by looking at the symbol "Γ", and the time-dependent change in its momentum by looking at the colors. you can also see the maximum and minimum points where the momentum is equal to 0.

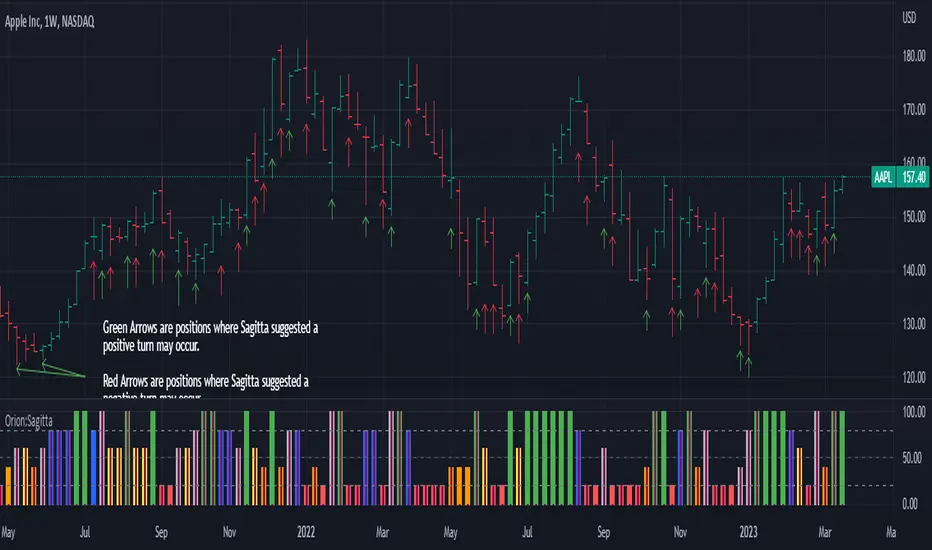
Orion:SagittaSagitta
Sagitta is an indicator the works to assist in the validation of potential long entries and to place stop-loss orders. Sagitta is not a "golden indicator" but more of a confirmation indicator of what prices might be suggesting.
The concept is that while stocks can turn in one bar, it usually takes two bars or more to signal a turn. So, using a measurement of two bars help determine the potential turning of prices.
Behind the scenes, Sagitta is nothing more than a 2 period stochastic which has had its values divided into five specific zones.
Dividing the range of the two bars in five sections, the High is equal to 100 and the Low is equal to 0.
The zones are:
20 = bearish (red) – This is when the close is the lower 20% of the two bars
40 = bearish (orange) – This is when the close is between the lower 20% and 40% of the two bars.
60 = neutral (yellow) – This is when the close is between the middle 40% - 60% of the two bars.
80 = bullish (blue) – This is when the close is between the upper 60% - 80% of the two bars.
100 = bullish (green) – This is when the close is above the upper 80% of the bar.
The general confirmation concept works as such:
When the following bar is of a higher value than the previous bar, there is potential for further upward price movement. Conversely when the following bar is lower than the previous bar, there is potential for further downward movement.
Going from a red bar to orange bar Might be an indication of a positive turn in direction of prices.
Going from a green bar to an orange bar would also be considered a negative directional turn of prices.
When the follow on bar decreases (ie, green to blue, blue to yellow, etc) placing a stop-loss would be prudent.
Maroon lines in the middle of a bar is an indication that prices are currently caught in consolidation.
Silver/Gray bars indicate that a high potential exists for a strong upward turn in prices exists.
Consolidation is calculated by determining if the close of one bar is between the high and low of another bar. This then establishes the range high and low. As long as closes continue with this range, the high and low of the range can expand. When the close is outside of the range, the consolidation is reset.
Signals in areas of consolidation (maroon center bar) should be looked upon as if the prices are going to challenge the high of the consolidation range and not necessarily break through.
The entry technique used is:
The greater of the following two calculations:
High of signal bar * 1.002 or High of signal bar + .03
The stop-loss technique used is:
The lesser of the following two calculations:
Low of signal bar * .998 or Low of signal bar - .03
IF an entry signal is generated and the price doesn’t reach the entry calculation. It is considered a failed entry and is not considered a negative or that you missed out on something. This has saved you from losing money since the prices are not ready to commit to the direction.
When placing a stop-loss, it is never suggested that you lower the value of a stop-loss. Always move your stop-losses higher in order to lock in profit in case of a negative turn.
Bar Magnified Volume Profile/Fixed Range [ChartPrime]This indicator draws a volume profile by utilizing data from the lower timeframe to get a more accurate representation of where volume occurred on a bar to bar basis. The indicator creates a price range, and then splits that price range into 100 grids by default. The indicator then drops down to the lower timeframe, approximately 16 times lower than the current timeframe being viewed on the chart, and then parses through all of the lower timeframe bars, and attributes the lower timeframe bar volume to all grids that it is touching. The volume is dispersed proportionally to the grids which it is touching by whatever percent of the candle is inside each grid. For example, if one of the lower timeframe bars is interacting with "2" of the grids in the profile, and 60% of the candle is inside of the top grid, 60% of the volume from said candle will be attributed to the grid.
To make all of this magic happen, this script utilizes a quadratic time complexity algorithm while parsing and attributing the volume to all of the grids. Due to this type of algorithm being used in the script, many of the user inputs have been limited to allow for simplicity, but also to prevent possible errors when executing loops. For the most part, all of the settings have been thoroughly tested and configured with the right amount of limitations to prevent these errors, but also still give the user a broad range of flexibility to adjust the script to their liking.
📗 SETTINGS
Lookback Period: The lookback period determines how many bars back the script will search for the "highest high" and the "lowest low" which will then be used to generate the grids in-between
Number Of Levels: This setting determines how many grids there will be within the volume profile/fixed range. This is personal preference, however it is capped at 100 to prevent time complexity issues
Profile Length: This setting allows you to stretch or thin the volume profile. A higher number will stretch it more, vise versa a smaller number will thin it further. This does not change the volume profiles results or values, only its visual appearance.
Profile Offset: This setting allows you to offset the profile to the left or right, in the event the user does not appreciate the positioning of the default location of the profile. A higher number will shift it to the right, vise versa a lower number will shift it to the left. This is personal preference and does not affect the results or values of the profile.
🧰 UTILITY
The volume profile/fixed range can be used in many ways. One of the most popular methods is to identify high volume areas on the chart to be used as trade entries or exits in the event of the price revisiting the high volume areas. Take this picture as an example. The image clearly demonstrates how the 2 highest areas of volume within this magnified volume profile also line up to great areas of support and resistance in the market.
Here are some other useful methods of using the volume profile/fixed range
Identify Key Support and Resistance Levels for Setups
Determine Logical Take Profits and Stop Losses
Calculate Initial R Multiplier
Identify Balanced vs Imbalanced Markets
Determine Strength of Trends

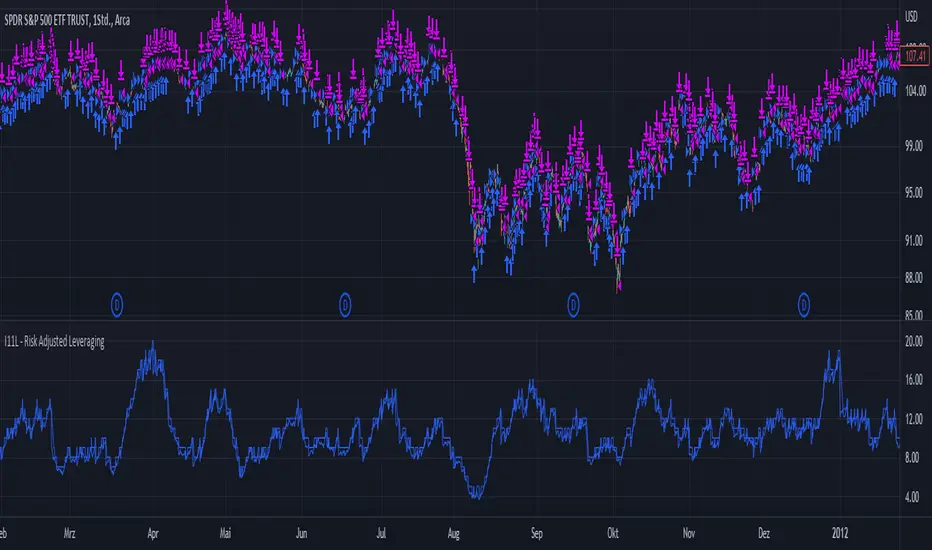
I11L - Risk Adjusted LeveragingThis trading system, called "I11L - Risk Adjusted Leveraging", is designed to manage trades based on the current market volatility relative to its historical average. The system calculates the target number of open trades based on the ATR (Average True Range) indicator and adjusts the leverage accordingly. The system opens and closes trades using a pyramiding approach, allowing multiple positions to be opened at the same time.
Here's a step-by-step explanation of the system:
1. Calculate the ATR with a 14-day period and normalize it by dividing it by the current closing price.
2. Calculate the 100-day simple moving average (SMA) of the normalized ATR.
3. Calculate the ratio of the normalized ATR to its 100-day SMA.
4. Determine the target leverage based on the inverse of the ratio (2 / ratio).
5. Calculate the target number of open trades by multiplying the target leverage by 5.
6. Plot the target number of open trades and the current number of open trades on the chart.
7. Check if there's an opportunity to buy (if the current number of open trades is less than the target) or close a trade (if the current number of open trades is more than the target plus 1).
8. If there's an opportunity to buy, open a long trade and add the trade's name to the openTrades array.
9. If there's an opportunity to close a trade and there are trades in the openTrades array, close the most recent trade by referencing the array and remove it from the array.
This system aims to capture trends in the market by dynamically adjusting the number of open trades and leverage based on the market's volatility. It uses an array to keep track of open trades, allowing for better control over the opening and closing of individual trades.
Modified Mannarino Market Risk Indicator MMMRI MMRIModified Mannarino Market Risk Indicator MMMRI was developed by "Nobody Special Finance" as an enhancement to the original MMRI developed by Gregory Mannarino. The original and modified version were created as a way to gauge current level of risk in the market. This published indicator includes both versions along with ability to customize the symbols, denominators, and ratio factors that are used within their formulas. Additional options have been included to colorize the candles, plot, and level fills, as well as the option to show or hide a table containing the realtime values for both versions, along with the current dollar strength and 10Y yield.
Levels of market risk are denoted by dashed lines which represent the following levels: 0-50 slight risk, 50-100 low risk, 100-200 moderate risk, 200-300 high risk, 300+ extreme risk. The plot displays whichever of the following two formulas has been selected in the indicator settings, the default choice has been set to MMMRI:
MMRI = (USD Strength * USD Interest Rate) / 1.61
MMMRI = (Debt / GDP) * (USD Strength * USD Interest Rate) / 1.61
NOTICE: This is an example script and not meant to be used as an actual strategy. By using this script or any portion thereof, you acknowledge that you have read and understood that this is for research purposes only and I am not responsible for any financial losses you may incur by using this script!

RSI is in Normal Distribution?Does RSI Follow a Normal Distribution?
The value of RSI was converted to a value between 0~2, 2~4, ..., 98~100, and the number of samples was graphed.
The Z values are expressed so that the values corresponding to 30 and 70 of the RSI can be compared with the standard normal distribution.
Additionally, when using the RSI period correction function of the 'RSI Candle Advanced V2' indicator that I made before, it shows no change in standard deviation.
RSI는 정규분포를 따를까요
RSI의 값을 0~2, 2~4, ..., 98~100 사이 값으로 변환하고 그 표본 갯수를 그래프로 표현하였습니다.
Z 값은 RSI의 30, 70에 해당하는 값을 표준정규분포와 비교할 수 있도록 표현하였습니다.
추가적으로 제가 예전에 만들었던 'RSI Candle Advanced V2' 지표의 RSI 기간 보정 함수를 사용할 경우 표준편차의 변화가 없음을 보입니다.

Negroni MA & RSI Strategy, plus trade entry and SL/TP optionsI will start with the context, and some things to think about when using a strategy tool to back-test ideas.
CONTEXT
FIRST: This is derived from other people's work, but I honestly hadn't found a mixed indicator MA strategy tool that does what this now does. If it is out there, apologies!!
This tool can help back-test various MA trends (SMA, EMA, HMA, VWMA); as well as factoring in RSI levels (or not); and can factor in a fixed HTF MA (or not). You can apply a 'retest entry' or a 'breakout entry', and you can also apply various risk mgt for SL/TP orders: 1) No SL/TP; or 2) a fixed %, or 3) dynamic ATR multipliers.
Find below, some details explaining what this tool is attempting to do.
Thank you, tack, salute!
THINGS TO REVIEW (it is not just about 'profitability'!!)
Whilst discretion is always highly encouraged as a trader, and a 100% indicator-driven strategy is VERY unlikely to yield sustainable results going forward, at the very least back-testing your strategies can help provide some guidance, not just on win rate Vs profit factor, but other things including:
a) Trade frequency: if a strategy has an 75% win rate and profit factor of 4, with all your parameters and confluence checks, but only triggers 3 trades every 5 years, is that realistically implementable to your trading situation if you have a $10,000 account?
b) Trade entry type: is it consistently better to wait for a retest of an 'MA zone', or is it better to market buy/sell on breakout of the 'MA zone'?
c) Risk management (SL/TP): is it consistently better to have a fixed static % for SL/TP ("I always place my stops 2% away, whether it is EURUSD or BTCUSDT"), or would you be better placed to try using an ATR multiplier of the respective assets?
d) Moving average type: is your old faithful 100 EMA really serving you well, or is the classic SMA more reliable, or how about the HMA, or the VWMA? Is the 100/200 cross holding up, or do you need something more sensitive? Is there any significant difference between a 10 EMA/20 EMA trend zone compared to a 13 EMA /25 EMA zone?
e) Confluence: Do added confluence checks (RSI, higher timeframe MA) actually improve profitability? But even if they do, is at the cost of cutting too many trades?
INPUTS AND PARAMETERS
Choice 1) Entry Strategy: Retest or Breakout - You can select both!
[ ]:
a) RETEST entry strat: price crosses UNDER FastMA INTO the 'MA trend zone'.
b) BREAKOUT entry strat: price crosses OVER FastMA OUT the 'MA trend zone'.
Choice 2) Risk Management (SL and TP) - You can select more than 1 strategy!
a) No SL/TP: Long trades are closed when the LOW crosses back UNDER the fastMA again, and shorts are closed when the HIGH crosses back OVER the fastMA again.
b) Static % SL/TP: Your SL/TP will be a fixed % away from avg. position price... WARNING: You should change this for various asset classes; FX vol is not the same as crypto altcoin vol!
c) Dynamic ATR SL/TP: Your SL/TP is a multiple of your selected ATR range (default is 50, see 'info' when you select ATR range). ATR accounts for the change in vol of different asset classes somewhat, HOWEVER... you should probably still not have the same multiplier trading S&P500 as you would trading crypto altcoins!
Then select your preferred parameters: EMA, SMA, HMA, VWMA, etc. You can mix and match, and most options have a info/tooltip guide.
RSI note: If you don't care for RSI levels, then set buy signal at 1... i.e always buys! Similarly set sell signal at 99.
ATR note: standard ATR length is usually 14, however... your SL/TP will move POST entry, and can tighten or widen your initial SL/TP... for better AND usually for worse! Go find a trade (strat 3) on the chart, look at the SL/TP lines, now change the number to 5, you'll see.
Fixed HTF MA note: If you don't care for HTF MA confluence, just change the timeframe/options to match the 'Slow MA' options you've chosen.

Smart QQE ModSmart QQE - Chart Overlay
Smart QQE shows QQE Trend and RSI plot on chart to determine the trend direction and eliminate false signals.
QQE is obtained from original code by Glaz and rescaled to fit on chart. RSI 50 level acts as Zero which is plotted as a Bollinger on chart.
This is not a Bollinger band . its an RSI channel with levels 0-100 plotted around the mid band. The RSI Mid Band is calculated based on RSI value.
Trend:
Price above RSI Mid band is uptrend
Price below RSI Mid band is Down Trend
The Green line - Discount Zone - 0-RSI level - Oversold Zone
The Red Line - Premium Zone - 100 - RSI level - Overbought Zone
Buy / Sell signals
QQE Buy and Sell signals are plotted based on crossovers of RSI and Fast RSI crossovers.
QQE trend is colored based on the crossover.
Candle color:
candle color determines the Original QQE Trend.
Blue - QQE line above Threshold level in Buy Zone
Pink - QQE line below Threshold level in Sell Zone
Entries are to be made with proper confirmation.
HULL MA is provided as a MA Ribbon for additional confirmation. This MA can be changed to various forms Like EMA , SMA , WMA , HMA , RMA the open and close of the MA are plotted so it determines the exact Trend reversal of the price.
Credits to @Glaz QQE Threshold

Dynamo
╭━━━╮
╰╮╭╮┃
╱┃┃┃┣╮╱╭┳━╮╭━━┳╮╭┳━━╮
╱┃┃┃┃┃╱┃┃╭╮┫╭╮┃╰╯┃╭╮┃
╭╯╰╯┃╰━╯┃┃┃┃╭╮┃┃┃┃╰╯┃
╰━━━┻━╮╭┻╯╰┻╯╰┻┻┻┻━━╯
╱╱╱╱╭━╯┃
╱╱╱╱╰━━╯
Overview
Dynamo is built to be the Swiss-knife for price-movement & strength detection, it aims to provide a holistic view of the current price across multiple dimensions. This is achieved by combining 3 very specific indicators(RSI, Stochastic & ADX) into a single view. Each of which serve a different purpose, and collectively provide a simple, yet powerful tool to gauge the true nature of price-action.
Background
Dynamo uses 3 technical analysis tools in conjunction to provide better insights into price movement, they are briefly explained below:
Relative Strength Index(RSI)
RSI is a popular indicator that is often used to measure the velocity of price change & the intensity of directional moves. RSI computes the relative strength of the current price by comparing the security’s bullish strength versus bearish strength for a given period, i.e. by comparing average gain to average loss.
It is a range bound(0-100) variable that generates a bullish reading if average gain is higher, and a bullish reading if average loss is higher. Values over 50 are generally considered bullish & values less than 50 indicate a bearish market. Values over 70 indicate an overbought condition, and values below 30 indicate oversold condition.
Stochastic
Stochastic is an indicator that aims to measure the momentum in the market, by comparing most recent closing price of the security to its price range for a given period. It is based on the assumption that price tends to close near the recent high in an up trend, and it closes near the recent low during a down trend.
It is also range bound(0-100), values over 80 indicate overbought condition and values below 20 indicate oversold condition.
Average Directional Index(ADX)
ADX is an indicator that can quantify trend strength, it is derived from two underlying indices, known as Directional Movement Index(DMI). +DMI represents strength of the up trend, and -DMI represents strength of the down trend, and ADX is the average of the two.
ADX is non-directional or trend-neutral, which means, it does not follow the direction of the price, instead ADX will rise only when there is a strong trend, it does not matter if it’s an up trend or a down trend. Typical ranges of ADX are 25-50 for a strong trend, anything below 25 is considered as no trend or weak trend. ADX can frequently shoot upto higher values, but it generally finds exhaustion levels around the 60-75 range.
About the script
All these indicators are very powerful tools, but just like any other indicator they have their limitations. Stochastic & ADX can generate false signals in volatile markets, meaning price wouldn’t always follow through with what’s being indicated. ADX may even fail to generate a signal in less volatile markets, simply because it is based on moving averages, it tends to react slower to price changes. RSI can also lose it’s effectiveness when markets are trending strong, as it can stay in the overbought or oversold ranges for an extended period of time.
Dynamo aims to provide the trader with a much broader perspective by bringing together these contrasting indicators into a single simplified view. When Stochastic becomes less reliable in highly volatile conditions, one can cross validate their deduction by looking at RSI patterns. When RSI gets stuck in overbought or oversold range, one can refer to ADX to get better picture about the current trend. Similarly, various combinations of rules & setups can be formulated to get a more deterministic view, when working with either of these indicators.
There many possible use cases for a tool like this, and it totally depends on how you want to use it. An obvious option is to use it to trigger signals only after it has been confirmed by two or more indicators, for example, RSI & Stochastic make a great combination for cross-over or cross-under strategies. Some of the other options include trend detection, strength detection, reversals or price rejection points, possible duration of a trend, and all of these can very easily be translated into effective entry and exit points for trades.
How to use it
Dynamo is an easy-to-use tool, just add it to your chart and you’re good to start with your market analysis. Output consists of three overlapping plots, each of which tackle price movement from a slightly different angle.
Stochastic: A momentum indicator that plots the current closing price in relation to the price-range over a given period of time.
Can be used to detect the direction of the price movement, potential reversals, or duration of an up/down move.
Plotted as grey coloured histograms in the background.
Relative Strength Index(RSI): RSI is also a momentum indicator that measures the velocity with which the price changes.
Can be used to detect the speed of the price movement, RSI divergences can be a nice way to detect directional changes.
Plotted as an aqua coloured line.
Average Directional Index(ADX): ADX is an indicator that is used to measure the strength of the current trend.
Can be used to measure how strong the price movement is, both up and down, or to establish long terms trends.
Plotted as an orange coloured line.
Features
Provides a well-rounded view of the market movement by amalgamating some of the best strength indicators, helping traders make better informed decisions with minimal effort.
Simplistic plots that aim to convey clean signals, as a result, reducing clutter on the chart, and hopefully in the trader's head too.
Combines different types of indicators into a single view, which leads to an optimised use of the precious screen real-estate.
Final Note
Dynamo is designed to be minimalistic in functionality and in appearance, as it is being built to be a general purpose tool that is not only beginner friendly, but can also be highly-configurable to meet the needs of pro traders.
Thresholds & default values for the indicators are only suggestions based on industry standards, they may not be an exact match for all markets & conditions. Hence, it is advisable for the user to test & adjust these values according their securities and trading styles.
The chart highlights one of many possible setups using this tool, and it can used to create various types of setups & strategies, but it is also worth noting that the usability & the effectiveness of this tool also depends on the user’s understanding & interpretation of the underlying indicators.
Lastly, this tool is only an indicator and should only be perceived that way. It does not guarantee anything, and the user should do their own research before committing to trades based on any indicator.

Crypto McClellan Oscillator (SLN Fix)This is an adaption of the Mcclellan Oscillator for crypto. Instead of tracking the S&P500 it tracks a selection of cryptos to make sure the indicator follows this sector instead.
Full credit goes to the creator of this indicator: Fadior. It has since been fixed by SLN.
The following description explains the standard McClellan Oscillator. Full credit to Investopedia , my fav source of financial explanations.
The same principles applies to its use in the crypto sector, but please be cautious of the last point, the limitations. Since crypto is more volatile, that could amplify choppy behavior.
This is not financial advice, please be extremely cautious. This indicator is only suitable as a confirmation signal and needs support of other signals to be profitable.
This indicator usually produces the best signals on slightly above daily time frame. I personally like 2 or 3 day, but you have to find the settings suitable for your trading style.
What Is the McClellan Oscillator?
The McClellan Oscillator is a market breadth indicator that is based on the difference between the number of advancing and declining issues on a stock exchange, such as the New York Stock Exchange (NYSE) or NASDAQ.
The indicator is used to show strong shifts in sentiment in the indexes, called breadth thrusts. It also helps in analyzing the strength of an index trend via divergence or confirmation.
The McClellan Oscillator formula can be applied to any stock exchange or group of stocks.
A reading above zero helps confirm a rise in the index, while readings below zero confirm a decline in the index.
When the index is rising but the oscillator is falling, that warns that the index could start declining too. When the index is falling and the oscillator is rising, that indicates the index could start rising soon. This is called divergence.
A significant change, such as moving 100 points or more, from a negative reading to a positive reading is called a breadth thrust. It may indicate a strong reversal from downtrend to uptrend is underway on the stock exchange.
How to Calculate the McClellan Oscillator
To get the calculation started, track Advances - Declines on a stock exchange for 19 and 39 days. Calculate a simple average for these, not exponential moving average (EMA).
Use these simple values as the Prior Day EMA values in the 19- and 39-day EMA formulas.
Calculate the 19- and 39-day EMAs.
Calculate the McClellan Oscillator value.
Now that the value has been calculated, on the next calculation use this value for the Prior Day EMA. Start calculating EMAs for the formula instead of simple averages.
If using the adjusted formula, the steps are the same, except use ANA instead of using Advances - Declines.
What Does the McClellan Oscillator Tell You?
The McClellan Oscillator is an indicator based on market breadth which technical analysts can use in conjunction with other technical tools to determine the overall state of the stock market and assess the strength of its current trend.
Since the indicator is based on all the stocks in an exchange, it is compared to the price movements of indexes that reflect that exchange, or compared to major indexes such as the S&P 500.
Positive and negative values indicate whether more stocks, on average, are advancing or declining. The indicator is positive when the 19-day EMA is above the 39-day EMA, and negative when the 19-day EMA is below the 39-day EMA.
A positive and rising indicator suggests that stocks on the exchange are being accumulated. A negative and falling indicator signals that stocks are being sold. Typically such action confirms the current trend in the index.
Crossovers from positive to negative, or vice versa, may signal the trend has changed in the index or exchange being tracked. When the indicator makes a large move, typically of 100 points or more, from negative to positive territory, that is called a breadth thrust.
It means a large number of stocks moved up after a bearish move. Since the stock market tends to rise over time, this a positive signal and may indicate that a bottom in the index is in and prices are heading higher overall.
When index prices and the indicator are moving in different directions, then the current index trend may lack strength. Bullish divergence occurs when the oscillator is rising while the index is falling. This indicates the index could head higher soon since more stocks are starting to advance.
Bearish divergence is when the index is rising and the indicator is falling. This means fewer stocks are keeping the advance going and prices may start to head lower.
Limitations of Using the McClellan Oscillator
The indicator tends to produce lots of signals. Breadth thrusts, divergence, and crossovers all occur with some frequency, but not all these signals will result in the price/index moving in the expected direction.
The indicator is prone to producing false signals and therefore should be used in conjunction with price action analysis and other technical indicators.
The indicator can also be quite choppy, moving between positive and negative territory rapidly. Such action indicates a choppy market, but this isn't evident until the indicator has made this whipsaw move a few times.
Good luck and a big thanks to Fadior!

TOMMAR#TOMMAR #MultiMovingAverages #MMAR
Dear fellow traders, this is Tommy, and today I'd like to introduce you to the Multi-Moving Averages Ribbon (MMAR) indicator, which I believe to be one of the best MMAR indicators available on TradingView. Moving Averages is a popular technical analysis tool used to smooth out price data by creating an average of past price data points over a specified time period. They can be used to identify trends and provide a clearer view of price action, as well as generate buy and sell signals by observing crossovers between different moving average lines.
In the MMAR indicator, we have incorporated 12 different types of Moving Averages, including Simple Moving Averages (SMA), Exponential Moving Averages (EMA), Weighted Moving Averages (WMA), Hull Moving Averages (HMA), and Smoothed Moving Averages (SMMA), among others. This allows traders to choose the optimal type for their preferred trading commodities.
One common technique in technical analysis is using multiple Moving Averages with varying lengths, which provides a more comprehensive view of price action. By analyzing multiple Moving Averages with different timeframes, traders can better understand both short- and long-term trends and make more informed trading decisions. Some of the well-known combinations of multiple moving averages used by traders are (5, 9, 14, 21, 45), (6, 11, 16, 22, 51), [8, 13, 21, 55), (50, 100, 200), and (60, 120, 240).
Another way to gauge the strength of the market trend is to look for the arrangement of the Moving Averages. If they are in a sequential order, with the shortest on top and the longest on the bottom, it is most likely a bullish trend. On the other hand, if they are arranged in reverse order, with the shortest on the bottom and the longest on top, it is most likely a bearish trend. The 'Trend Light' in the indicator settings will automatically signal when the Moving Averages are in either an orderly or reverse arrangement.
Lastly, I have added a useful feature to the indicator: the 'MA Projection'. This feature projects and forecasts the Moving Averages in the future, allowing traders to easily identify confluence zones in future candlesticks. Please note that the projection levels may change in the case of extreme price action that significantly affects the Moving Averages.
This is free so any Tradingview users can use this indicator. Just search TOMMAR in the indicator section located on top of the chart.
#TOMMAR #MultiMovingAverages #MMAR
안녕하세요 트레이더 여러분, 토미입니다. 오늘 여러분들에게 소개드릴 지표는 다양한 길이의 이동평균선 조합을 사용할 수 있는 MMAR (Multiple Moving Averages Ribbon)입니다. 아마 제가 만든 MMAR 지표가 트레이딩뷰에서 가장 쓸만할 겁니다. 이동평균선, 줄여서 이평선은 말 그대로 특정 기간 범위 내의 주가들을 평균한 값들로 이루어진 선입니다. 제가 이평선 관련된 강의 자료는 예전에 올려드린 바 있으니 더 자세한 내용이 궁금하신 분들은 아래 링크/이미지 클릭하시길 바랍니다.
본 지표는 Simple Moving Averages (SMA), Exponential Moving Averages (EMA), Weighted Moving Averages (WMA), Hull Moving Averages (HMA), 그리고 Smoothed Moving Averages (SMMA) 등을 포함해 총 12개 종류의 이평선 지표를 사용할 수 있습니다. 또한 각 이평선의 길이들도 하나하나 일일이 설정하실 수 있습니다. 예를 들어 요즘에 자주 보이는 이평선들의 조합이 , , , , 그리고 등등이 존재하는데 여러분의 취향에 맞게 설정하여 사용하시면 됩니다.
몇 가지 주요 기능에 대해서 설명 드리겠습니다. 설정에서 ‘Trend Light’를 키면 이평선들의 정배열 혹은 역배열 여부를 쉽게 볼 수 있습니다. 이평선이 정배열일때는 맨 아래의 이평선에 초록불이, 역배열일때는 맨 위의 이평선에 빨간불이 켜지며 둘 다 아닐 땐 아무 불도 켜지지 않습니다. 또한 ‘MA Projection’을 키면 이평선들의 미래 예측 값들을 확장해줍니다. 당연히 가격 변동이 갑자기 크게 나오면 이평선 예측 확장 레벨들이 확 바뀌겠죠.
지표창에 TOMMAR 검색하시거나 아래 즐겨찾기 인디케이터에 넣기 클릭하시면 누구나 사용하실 수 있습니다~ 여러분의 구독, 좋아요, 댓글은 저에게 큰 힘이 됩니다.

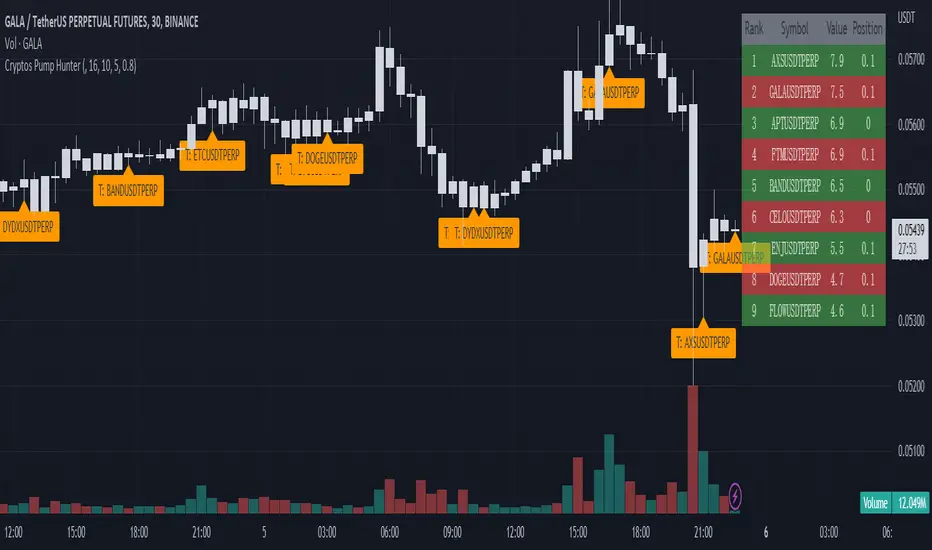
Cryptos Pump Hunter[liwei666]🔥 Cryptos Pump Hunter captured high volatility symbols in real-time, Up to 40 symbols can be monitored at same time.
Help you find the most profitable symbol with excellent visualization.
🔥 Indicator Design logic
🎯 The core pump/dump logic is quite simple
1. calc past bars highest and lowest High price, get movement by this formula
" movement = (highest - lowest) / lowest * 100 "
2. order by 'movement' value descending, you will get a volatility List
3. use Table tool display List, The higher the 'movement', the higher the ranking.
🔥 Settings
🎯 2 input properties impact on the results, 2 input impact on display effects, others look picture below.
pump_bars_cnt : lookback bar to calc pump/dump
resolution for pump : 1min to 1D
show_top1 : when ranking list top1 change, will draw a label
show pump : when symbol over threhold, draw a pump lable
🔥 How TO USE
🎯 only trade high volatility symbols
1. focus on top1 symbol on Table panel at top-right postion, trading symbols at label in chart.
2. Short when 'postion' ~ 0, Long when 'postion' ~ 1 on Table Cell
🎯 Monitor the symbols you like
1. 100+ symbols added in script, cancel remarks in code line if symbol is your want
2. add 1 line code if symbol not exist. if you want monitor 'ETHUSDTPERP ', then add
" ETHUSDTPERP = create_symbol_obj('BINANCE:ETHUSDTPERP'), array.unshift(symbol_a, ETHUSDTPERP ) "
🎯 Alert will be add soon, any questions or suggestion please comment below, I would appreciate it greatly.
Hope this indicator will be useful for you :)
enjoy! 🚀🚀🚀
Machine Learning: Lorentzian Classification█ OVERVIEW
A Lorentzian Distance Classifier (LDC) is a Machine Learning classification algorithm capable of categorizing historical data from a multi-dimensional feature space. This indicator demonstrates how Lorentzian Classification can also be used to predict the direction of future price movements when used as the distance metric for a novel implementation of an Approximate Nearest Neighbors (ANN) algorithm.
█ BACKGROUND
In physics, Lorentzian space is perhaps best known for its role in describing the curvature of space-time in Einstein's theory of General Relativity (2). Interestingly, however, this abstract concept from theoretical physics also has tangible real-world applications in trading.
Recently, it was hypothesized that Lorentzian space was also well-suited for analyzing time-series data (4), (5). This hypothesis has been supported by several empirical studies that demonstrate that Lorentzian distance is more robust to outliers and noise than the more commonly used Euclidean distance (1), (3), (6). Furthermore, Lorentzian distance was also shown to outperform dozens of other highly regarded distance metrics, including Manhattan distance, Bhattacharyya similarity, and Cosine similarity (1), (3). Outside of Dynamic Time Warping based approaches, which are unfortunately too computationally intensive for PineScript at this time, the Lorentzian Distance metric consistently scores the highest mean accuracy over a wide variety of time series data sets (1).
Euclidean distance is commonly used as the default distance metric for NN-based search algorithms, but it may not always be the best choice when dealing with financial market data. This is because financial market data can be significantly impacted by proximity to major world events such as FOMC Meetings and Black Swan events. This event-based distortion of market data can be framed as similar to the gravitational warping caused by a massive object on the space-time continuum. For financial markets, the analogous continuum that experiences warping can be referred to as "price-time".
Below is a side-by-side comparison of how neighborhoods of similar historical points appear in three-dimensional Euclidean Space and Lorentzian Space:
This figure demonstrates how Lorentzian space can better accommodate the warping of price-time since the Lorentzian distance function compresses the Euclidean neighborhood in such a way that the new neighborhood distribution in Lorentzian space tends to cluster around each of the major feature axes in addition to the origin itself. This means that, even though some nearest neighbors will be the same regardless of the distance metric used, Lorentzian space will also allow for the consideration of historical points that would otherwise never be considered with a Euclidean distance metric.
Intuitively, the advantage inherent in the Lorentzian distance metric makes sense. For example, it is logical that the price action that occurs in the hours after Chairman Powell finishes delivering a speech would resemble at least some of the previous times when he finished delivering a speech. This may be true regardless of other factors, such as whether or not the market was overbought or oversold at the time or if the macro conditions were more bullish or bearish overall. These historical reference points are extremely valuable for predictive models, yet the Euclidean distance metric would miss these neighbors entirely, often in favor of irrelevant data points from the day before the event. By using Lorentzian distance as a metric, the ML model is instead able to consider the warping of price-time caused by the event and, ultimately, transcend the temporal bias imposed on it by the time series.
For more information on the implementation details of the Approximate Nearest Neighbors (ANN) algorithm used in this indicator, please refer to the detailed comments in the source code.
█ HOW TO USE
Below is an explanatory breakdown of the different parts of this indicator as it appears in the interface:
Below is an explanation of the different settings for this indicator:
General Settings:
Source - This has a default value of "hlc3" and is used to control the input data source.
Neighbors Count - This has a default value of 8, a minimum value of 1, a maximum value of 100, and a step of 1. It is used to control the number of neighbors to consider.
Max Bars Back - This has a default value of 2000.
Feature Count - This has a default value of 5, a minimum value of 2, and a maximum value of 5. It controls the number of features to use for ML predictions.
Color Compression - This has a default value of 1, a minimum value of 1, and a maximum value of 10. It is used to control the compression factor for adjusting the intensity of the color scale.
Show Exits - This has a default value of false. It controls whether to show the exit threshold on the chart.
Use Dynamic Exits - This has a default value of false. It is used to control whether to attempt to let profits ride by dynamically adjusting the exit threshold based on kernel regression.
Feature Engineering Settings:
Note: The Feature Engineering section is for fine-tuning the features used for ML predictions. The default values are optimized for the 4H to 12H timeframes for most charts, but they should also work reasonably well for other timeframes. By default, the model can support features that accept two parameters (Parameter A and Parameter B, respectively). Even though there are only 4 features provided by default, the same feature with different settings counts as two separate features. If the feature only accepts one parameter, then the second parameter will default to EMA-based smoothing with a default value of 1. These features represent the most effective combination I have encountered in my testing, but additional features may be added as additional options in the future.
Feature 1 - This has a default value of "RSI" and options are: "RSI", "WT", "CCI", "ADX".
Feature 2 - This has a default value of "WT" and options are: "RSI", "WT", "CCI", "ADX".
Feature 3 - This has a default value of "CCI" and options are: "RSI", "WT", "CCI", "ADX".
Feature 4 - This has a default value of "ADX" and options are: "RSI", "WT", "CCI", "ADX".
Feature 5 - This has a default value of "RSI" and options are: "RSI", "WT", "CCI", "ADX".
Filters Settings:
Use Volatility Filter - This has a default value of true. It is used to control whether to use the volatility filter.
Use Regime Filter - This has a default value of true. It is used to control whether to use the trend detection filter.
Use ADX Filter - This has a default value of false. It is used to control whether to use the ADX filter.
Regime Threshold - This has a default value of -0.1, a minimum value of -10, a maximum value of 10, and a step of 0.1. It is used to control the Regime Detection filter for detecting Trending/Ranging markets.
ADX Threshold - This has a default value of 20, a minimum value of 0, a maximum value of 100, and a step of 1. It is used to control the threshold for detecting Trending/Ranging markets.
Kernel Regression Settings:
Trade with Kernel - This has a default value of true. It is used to control whether to trade with the kernel.
Show Kernel Estimate - This has a default value of true. It is used to control whether to show the kernel estimate.
Lookback Window - This has a default value of 8 and a minimum value of 3. It is used to control the number of bars used for the estimation. Recommended range: 3-50
Relative Weighting - This has a default value of 8 and a step size of 0.25. It is used to control the relative weighting of time frames. Recommended range: 0.25-25
Start Regression at Bar - This has a default value of 25. It is used to control the bar index on which to start regression. Recommended range: 0-25
Display Settings:
Show Bar Colors - This has a default value of true. It is used to control whether to show the bar colors.
Show Bar Prediction Values - This has a default value of true. It controls whether to show the ML model's evaluation of each bar as an integer.
Use ATR Offset - This has a default value of false. It controls whether to use the ATR offset instead of the bar prediction offset.
Bar Prediction Offset - This has a default value of 0 and a minimum value of 0. It is used to control the offset of the bar predictions as a percentage from the bar high or close.
Backtesting Settings:
Show Backtest Results - This has a default value of true. It is used to control whether to display the win rate of the given configuration.
█ WORKS CITED
(1) R. Giusti and G. E. A. P. A. Batista, "An Empirical Comparison of Dissimilarity Measures for Time Series Classification," 2013 Brazilian Conference on Intelligent Systems, Oct. 2013, DOI: 10.1109/bracis.2013.22.
(2) Y. Kerimbekov, H. Ş. Bilge, and H. H. Uğurlu, "The use of Lorentzian distance metric in classification problems," Pattern Recognition Letters, vol. 84, 170–176, Dec. 2016, DOI: 10.1016/j.patrec.2016.09.006.
(3) A. Bagnall, A. Bostrom, J. Large, and J. Lines, "The Great Time Series Classification Bake Off: An Experimental Evaluation of Recently Proposed Algorithms." ResearchGate, Feb. 04, 2016.
(4) H. Ş. Bilge, Yerzhan Kerimbekov, and Hasan Hüseyin Uğurlu, "A new classification method by using Lorentzian distance metric," ResearchGate, Sep. 02, 2015.
(5) Y. Kerimbekov and H. Şakir Bilge, "Lorentzian Distance Classifier for Multiple Features," Proceedings of the 6th International Conference on Pattern Recognition Applications and Methods, 2017, DOI: 10.5220/0006197004930501.
(6) V. Surya Prasath et al., "Effects of Distance Measure Choice on KNN Classifier Performance - A Review." .
█ ACKNOWLEDGEMENTS
@veryfid - For many invaluable insights, discussions, and advice that helped to shape this project.
@capissimo - For open sourcing his interesting ideas regarding various KNN implementations in PineScript, several of which helped inspire my original undertaking of this project.
@RikkiTavi - For many invaluable physics-related conversations and for his helping me develop a mechanism for visualizing various distance algorithms in 3D using JavaScript
@jlaurel - For invaluable literature recommendations that helped me to understand the underlying subject matter of this project.
@annutara - For help in beta-testing this indicator and for sharing many helpful ideas and insights early on in its development.
@jasontaylor7 - For helping to beta-test this indicator and for many helpful conversations that helped to shape my backtesting workflow
@meddymarkusvanhala - For helping to beta-test this indicator
@dlbnext - For incredibly detailed backtesting testing of this indicator and for sharing numerous ideas on how the user experience could be improved.

On Balance Volume Scaled - OBV ScaledThe main idea of this oscillator is to place the OBV oscillator and its oscillation around the range of 0 and around -50 to +50 and for this scaling of the "On Balance Volume" oscillator, I have used Min-max normalization.
Since this oscillator does not have a specific minimum and maximum, just setting the maximum and minimum does not seem the best thing to do. As in this case, we will constantly observe sudden changes and we will have problems such as volatility. On the one hand, we will constantly deal with sudden changes and problems such as volatility. Also on the other hand, the continuous collisions of the high/low(+50 & -50) and index and returning from that is another thing that we are going to deal with.
Therefore, to solve these problems and create more flexible maximum and minimum ranges, another similar method has been used. Choosing the maximum of our normalization to the size of the moving average of 100 candles of the index maximum and choosing the minimum of normalization to the size of the moving average of 100 candles of the minimums of the OBV index, and then normalizing the OBV index with the Min-max method with those ranges, is the recommended method ,which has been used to eliminate problems. In this case, we will not have any problem hitting 50 and returning or hitting -50 and returning. Also, our scaled OBV index will have the ability to touch and cross 50 and -50 and can fluctuate without problems.
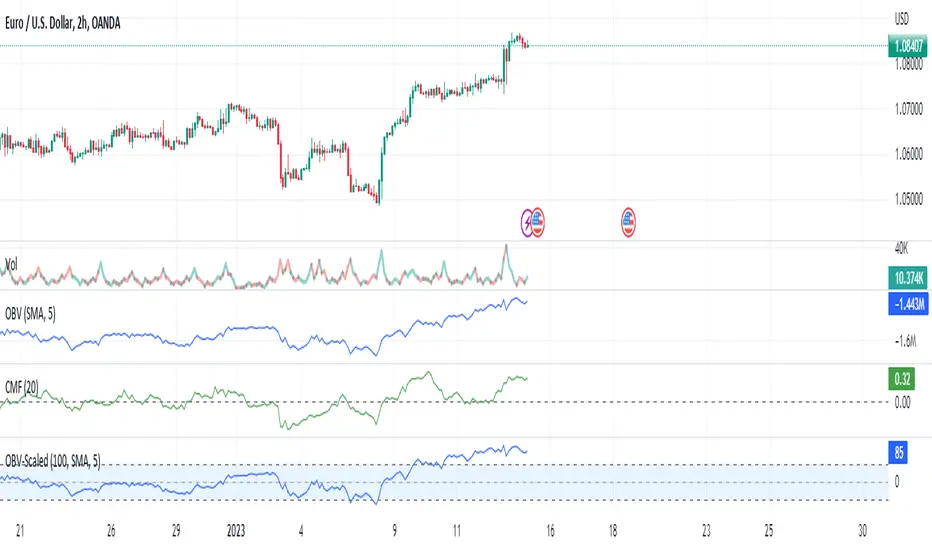
Stockbee Momentum BurstThis is a script to color code bars based on the bullish- and bearish combination.
Bullish Combination
Percent: Price >= 4% from yesterday and Volume today > Yesterday
Dollar: Price >= 0.9 dollar from open
Base Requirements
- Price > Yesterday's close
- Price > Open
- Price is within 30% of high
- Todays price range >= Yesterdays price range
- Yesterday's move <= 2%
- Volume >= 100 000
Bearish Combination
Percent: Price <= 4% from yesterday and Volume today > Yesterday
Dollar: Price <= 0.9 dollar from open
Base Requirements
- Price < Yesterday's close
- Price < Open
- Price is within 30% of low
- Todays price range >= Yesterdays price range
- Yesterday's move >= -2%
- Minimum volume for each of last 3 days >= 100 000
Momentum Filter
These are based on the 10 and 20 EMA crossover, where the former above would indicate upward momentum and below downward momentum. This can help to narrow down the color code to continuation phases. The linked option will override all other momentum filters, bullish candles will be displayed when EMA 10 > 20 and bearish candles when EMA 10 < 20.
