Trailing Stops/Choose a Day of the WeekThis would be my second ever published strategy. It is almost the same as my first ever published script . I've been working primarily on UGAZ and DGAZ .
This is basically a statistical trade. It buys every morning near market open (or by choosing a "time constraint"), then immediately places a trailing stop at a specified amount in ticks (if used on UGAZ a tick = $0.01, if used on NG at tick = $0.001). I've found between 2% and 3% works well for the trailing stop (ie. if UGAZ = $75, a 3% trailing stop = $2.25)
-----What is different from my first strategy?------
You can test the trailing stop strategy one 1 day of the week. Days of the week are assigned numbers. Sunday=1, Monday=2, Tuesday=3 and so on. Just choose a number that correlates to the day of the week you want to test. The Trailing stop may go past that day, that's a good thing if it's making money.
-- Go long/Short is just that, it will buy shares/contracts or short them.
-- Trades per day. This may not be a good choice, when left on "2", it will trade once per day. If set above 2 and there is time left for another trade, an order will enter on the open of the next candle. I'm am still working on ideas for this.
-- Time constraints. When you select this check box, the strategy will limit an entry to the time specified below the "Use Time Constraints" check box. An Exit order will still continue past this window of time until it is stopped out.
---- very important ----
Due to decay, leveraged ETFs will give false results if the price gets far out of range. For example, your ETF is trading around $20 and you choose a 1 hour chart, it may back test back to a time before a reverse split. If the price gets to be too large, like $200, or $1200, the movement on the chart creates false indication of profit/loss.
--- Most important. ---
Do not trade off this strategy, you may lose lots of money. This is for educational use only.
Good luck
Cari dalam skrip untuk "文华财经tick价格"

MY_DXY corrected pricePlots the current ticker's price in "DXY corrected dollar". Overlay mode.
Default resolution is 60 mins, can be modified by input (*)
Works with every ticker: GC/SI/XAUUSD etc

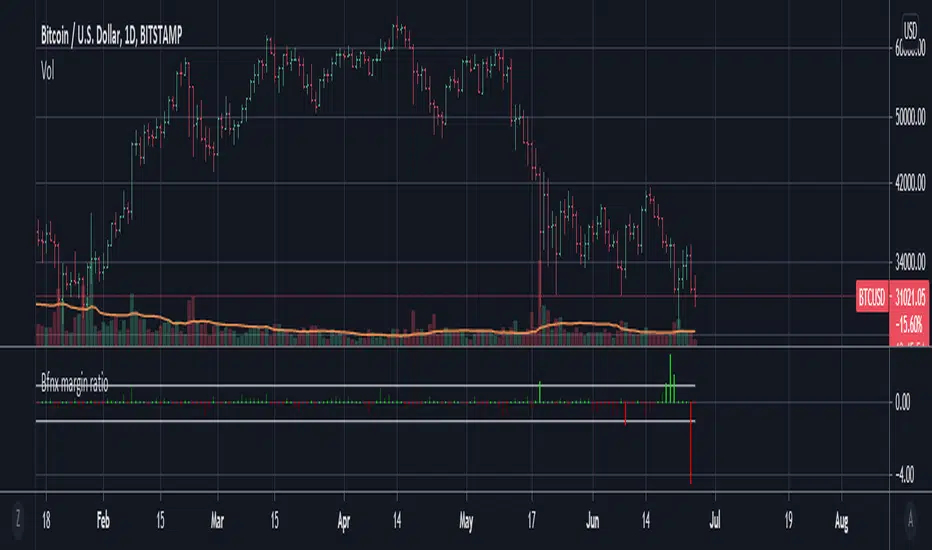
Bitfinex margin change / total volumeThis script tracks the net Bitfinex margin sizes from candle to candle (longs - shorts), and divide it by the total volume from the previous candle. This should give you a ratio of net margin trading volume over total volume on Bitfinex.
Note that assuming the delay is not severe, this ratio should never exceed 1 or -1 (since margin traded volume should strictly be lower than total traded volume during any time interval). As you can see clearly however, the ratio exceeds 1 and -1 quite frequently. Thanks to @CryptoTrendy on Twitter for bringing this issue to attention. Our trading group has noticed this issue ever since they introduced the tickers, and we suspect there are severe inaccuracies in either one, or both of the margin and total volume tickers.
Volume Area 80 Rule Pro - Adaptive RTHSummary in one paragraph
Adaptive value area 80 percent rule for index futures large cap equities liquid crypto and major FX on intraday timeframes. It focuses activity only when multiple context gates align. It is original because the classic prior day value area traverse is fused with a daily regime classifier that remaps the operating parameters in real time.
Scope and intent
• Markets. ES NQ SPY QQQ large cap equities BTC ETH major FX pairs and other liquid RTH instruments
• Timeframes. One minute to one hour with daily regime context
• Default demo used in the publication. ES1 on five minutes
• Purpose. Trade only the balanced days where the 80 percent traverse has edge while standing aside or tightening rules during trend or shock
Originality and usefulness
• Unique fusion. Prior day value area logic plus a rolling daily regime classifier using percentile ranks of realized volatility and ADX. The regime remaps hold time end of window stop buffer and value area coverage on each session
• Failure mode addressed. False starts during strong trend or shock sessions and weak traverses during quiet grind
• Testability. All gates are visible in Inputs and debug flags can be plotted so users can verify why a suggestion appears
• Portable yardstick. The regime uses ATR divided by close and ADX percent ranks which behave consistently across symbols
Method overview in plain language
The script builds the prior session profile during regular trading hours. At the first regular bar it freezes yesterday value area low value area high and point of control. It then evaluates the current session open location the first thirty minute volume rank the open gap rank and an opening drive test. In parallel a daily series classifies context into Calm Balance Trend or Shock from rolling percentile ranks of realized volatility and ADX. The classifier scales the rules. Calm uses longer holds and a slightly wider value area. Trend and Shock shorten the window reduce holds and enlarge stop buffers.
Base measures
• Range basis. True Range smoothed over a configurable length on both the daily and intraday series
• Return basis. Not required. ATR over close is the unit for regime strength
Components
• Prior Value Area Engine. Builds yesterday value area low value area high and point of control from a binned volume profile with automatic TPO fallback and minimum integrity guards
• Opening Location. Detects whether the session opens above the prior value area or below it
• Inside Hold Counter. Counts consecutive bars that hold inside the value area after a re entry
• Volume Gate. Percentile of the first thirty minutes volume over a rolling sample
• Gap Gate. Percentile rank of the regular session open gap over a rolling sample
• Drive Gate. Opening drive check using a multiple of intraday ATR
• Regime Classifier. Percentile ranks of daily ATR over close and daily ADX classify Calm Balance Trend Shock and remap parameters
• Session windows optional. Windows follow the chart exchange time
Fusion rule
Minimum satisfied gates approach. A re entry must hold inside the value area for a regime scaled number of bars while the volume gap and drive gates allow the setup. The regime simultaneously scales value area coverage end minute time stop and stop buffer.
Signal rule
• Long suggestion appears when price opens below yesterday value area then re enters and holds for the required bars while all gates allow the setup
• Short suggestion appears when price opens above yesterday value area then re enters and holds for the required bars while all gates allow the setup
• WAIT shows implicitly when any required gate is missing
• Exit labels mark target touch stop touch or a time based close
Inputs with guidance
Setup
• Signal timeframe. Uses the chart by default
• Session windows optional. Start and end minutes inside regular trading hours
• Invert direction is not used. The logic is symmetric
Logic
• Hold bars inside value area. Typical range 3 to 12. Raising it reduces trades and favors better traverses. Lowering it increases frequency and risk of false starts
• Earliest minute since RTH open and Latest minute since RTH open. Typical range 0 to 390. Reducing the latest minute cuts late session trades
• Time stop bars after entry. Typical range 6 to 30. Larger values give setups more room
Filters
• Value area coverage. Typical range 0.70 to 0.85. Higher coverage narrows the traverse but accepts fewer days
• Bin size in ticks. Typical range 1 to 8. Larger bins stabilize noisy profiles
• Stop buffer ticks beyond edge. Typical range 2 to 20. Larger buffers survive noise
• First thirty minute volume percentile. Typical range 0.30 to 0.70. Higher values require more active opens
• Gap filter percentile. Typical range 0.70 to 0.95. Lower values block more gap days
• Opening drive multiple and bars. Higher multiple or longer bars block strong directional opens
Adaptivity
• Lookback days for regime ranks. Typical 150 to 500
• Calm RV percentile. Typical 25 to 45
• Trend ADX percentile. Typical 55 to 75
• Shock RV percentile. Typical 75 to 90
• End minute ratio in Trend and Shock. Typical 0.5 to 0.8
• Hold and Time stop scales per regime. Use values near one to keep behavior close to static settings
Realism and responsible publication
• No performance claims. Past results never guarantee future outcomes
• Shapes can move while a bar forms and settle on close
• Sessions use the chart exchange time
Honest limitations and failure modes
• Economic releases and thin liquidity can break the balance premise
• Gap heavy symbols may work better with stronger gap filters and a True Range focus
• Very quiet regimes reduce signal contrast. Consider longer windows or higher thresholds
Legal
Education and research only. Not investment advice. Test in simulation before any live use.

Simple FloatFloat Display Indicator
A simple, clean indicator that displays the current float (shares outstanding float) for any stock directly in your indicator status line at the top left of the chart.
Features:
- Shows the float value with automatic K/M formatting for thousands and millions
- No chart clutter - value only appears in the status line, nothing plotted on the chart
- Works on any stock that has float data available
- Lightweight and efficient
Perfect for traders who want quick access to float information without switching between windows or cluttering their charts.
Note: Float data availability depends on TradingView's financial data for the specific ticker. Some tickers may not have this data available.

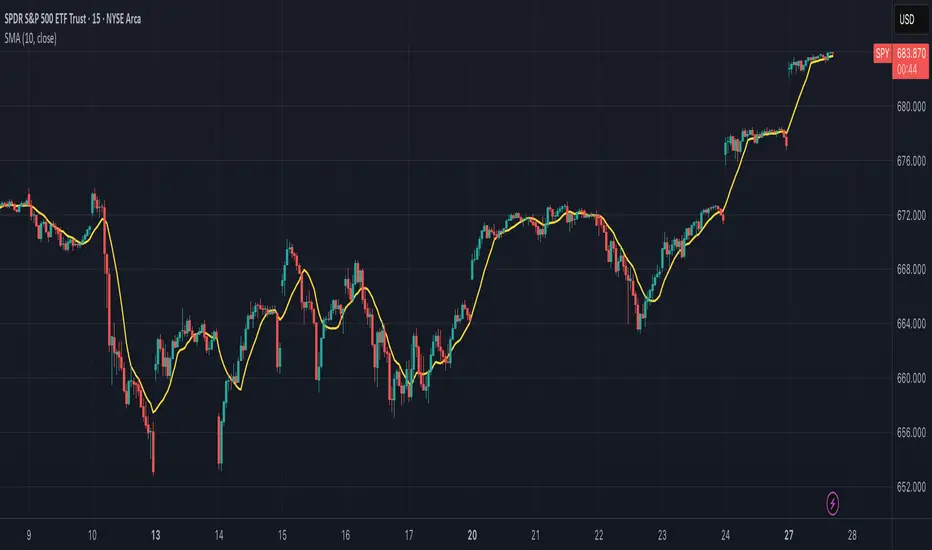
Simple Moving Average (SMA)## Overview and Purpose
The Simple Moving Average (SMA) is one of the most fundamental and widely used technical indicators in financial analysis. It calculates the arithmetic mean of a selected range of prices over a specified number of periods. Developed in the early days of technical analysis, the SMA provides traders with a straightforward method to identify trends by smoothing price data and filtering out short-term fluctuations. Due to its simplicity and effectiveness, it remains a cornerstone indicator that forms the basis for numerous other technical analysis tools.
## What’s Different in this Implementation
- **Constant streaming update:**
On each bar we:
1) subtract the value leaving the window,
2) add the new value,
3) divide by the number of valid samples (early) or by `period` (once full).
- **Deterministic lag, same as textbook SMA:**
Once full, lag is `(period - 1)/2` bars—identical to the classic SMA. You just **don’t lose the first `period-1` bars** to `na`.
- **Large windows without penalty:**
Complexity is constant per tick; memory is bounded by `period`. Very long SMAs stay cheap.
## Behavior on Early Bars
- **Bars < period:** returns the arithmetic mean of **available** samples.
Example (period = 10): bar #3 is the average of the first 3 inputs—not `na`.
- **Bars ≥ period:** behaves exactly like standard SMA over a fixed-length window.
> Implication: Crosses and signals can appear earlier than with `ta.sma()` because you’re not suppressing the first `period-1` bars.
## When to Prefer This
- Backtests needing early bars: You want signals and state from the very first bars.
- High-frequency or very long SMAs: O(1) updates avoid per-bar CPU spikes.
- Memory-tight scripts: Single circular buffer; no large temp arrays per tick.
## Caveats & Tips
Backtest comparability: If you previously relied on na gating from ta.sma(), add your own warm-up guard (e.g., only trade after bar_index >= period-1) for apples-to-apples.
Missing data: The function treats the current bar via nz(source); adjust if you need strict NA propagation.
Window semantics: After warm-up, results match the textbook SMA window; early bars are a partial-window mean by design.
## Math Notes
Running-sum update:
sum_t = sum_{t-1} - oldest + newest
SMA_t = sum_t / k where k = min(#valid_samples, period)
Lag (full window): (period - 1) / 2 bars.
## References
- Edwards & Magee, Technical Analysis of Stock Trends
- Murphy, Technical Analysis of the Financial Markets
Hyper SAR Reactor Trend StrategyHyperSAR Reactor Adaptive PSAR Strategy
Summary
Adaptive Parabolic SAR strategy for liquid stocks, ETFs, futures, and crypto across intraday to daily timeframes. It acts only when an adaptive trail flips and confirmation gates agree. Originality comes from a logistic boost of the SAR acceleration using drift versus ATR, plus ATR hysteresis, inertia on the trail, and a bear-only gate for shorts. Add to a clean chart and run on bar close for conservative alerts.
Scope and intent
• Markets: large cap equities and ETFs, index futures, major FX, liquid crypto
• Timeframes: one minute to daily
• Default demo: BTC on 60 minute
• Purpose: faster yet calmer PSAR that resists chop and improves short discipline
• Limits: this is a strategy that places simulated orders on standard candles
Originality and usefulness
• Novel fusion: PSAR AF is boosted by a logistic function of normalized drift, trail is monotone with inertia, entries use ATR buffers and optional cooldown, shorts are allowed only in a bear bias
• Addresses false flips in low volatility and weak downtrends
• All controls are exposed in Inputs for testability
• Yardstick: ATR normalizes drift so settings port across symbols
• Open source. No links. No solicitation
Method overview
Components
• Adaptive AF: base step plus boost factor times logistic strength
• Trail inertia: one sided blend that keeps the SAR monotone
• Flip hysteresis: price must clear SAR by a buffer times ATR
• Volatility gate: ATR over its mean must exceed a ratio
• Bear bias for shorts: price below EMA of length 91 with negative slope window 54
• Cooldown bars optional after any entry
• Visual SAR smoothing is cosmetic and does not drive orders
Fusion rule
Entry requires the internal flip plus all enabled gates. No weighted scores.
Signal rule
• Long when trend flips up and close is above SAR plus buffer times ATR and gates pass
• Short when trend flips down and close is below SAR minus buffer times ATR and gates pass
• Exit uses SAR as stop and optional ATR take profit per side
Inputs with guidance
Reactor Engine
• Start AF 0.02. Lower slows new trends. Higher reacts quicker
• Max AF 1. Typical 0.2 to 1. Caps acceleration
• Base step 0.04. Typical 0.01 to 0.08. Raises speed in trends
• Strength window 18. Typical 10 to 40. Drift estimation window
• ATR length 16. Typical 10 to 30. Volatility unit
• Strength gain 4.5. Typical 2 to 6. Steepness of logistic
• Strength center 0.45. Typical 0.3 to 0.8. Midpoint of logistic
• Boost factor 0.03. Typical 0.01 to 0.08. Adds to step when strength rises
• AF smoothing 0.50. Typical 0.2 to 0.7. Adds inertia to AF growth
• Trail smoothing 0.35. Typical 0.15 to 0.45. Adds inertia to the trail
• Allow Long, Allow Short toggles
Trade Filters
• Flip confirm buffer ATR 0.50. Typical 0.2 to 0.8. Raise to cut flips
• Cooldown bars after entry 0. Typical 0 to 8. Blocks re entry for N bars
• Vol gate length 30 and Vol gate ratio 1. Raise ratio to trade only in active regimes
• Gate shorts by bear regime ON. Bear bias window 54 and Bias MA length 91 tune strictness
Risk
• TP long ATR 1.0. Set to zero to disable
• TP short ATR 0.0. Set to 0.8 to 1.2 for quicker shorts
Usage recipes
Intraday trend focus
Confirm buffer 0.35 to 0.5. Cooldown 2 to 4. Vol gate ratio 1.1. Shorts gated by bear regime.
Intraday mean reversion focus
Confirm buffer 0.6 to 0.8. Cooldown 4 to 6. Lower boost factor. Leave shorts gated.
Swing continuation
Strength window 24 to 34. ATR length 20 to 30. Confirm buffer 0.4 to 0.6. Use daily or four hour charts.
Properties visible in this publication
Initial capital 10000. Base currency USD. Order size Percent of equity 3. Pyramiding 0. Commission 0.05 percent. Slippage 5 ticks. Process orders on close OFF. Bar magnifier OFF. Recalculate after order filled OFF. Calc on every tick OFF. No security calls.
Realism and responsible publication
No performance claims. Past results never guarantee future outcomes. Shapes can move while a bar forms and settle on close. Strategies execute only on standard candles.
Honest limitations and failure modes
High impact events and thin books can void assumptions. Gap heavy symbols may prefer longer ATR. Very quiet regimes can reduce contrast and invite false flips.
Open source reuse and credits
Public domain building blocks used: PSAR concept and ATR. Implementation and fusion are original. No borrowed code from other authors.
Strategy notice
Orders are simulated on standard candles. No lookahead.
Entries and exits
Long: flip up plus ATR buffer and all gates true
Short: flip down plus ATR buffer and gates true with bear bias when enabled
Exit: SAR stop per side, optional ATR take profit, optional cooldown after entry
Tie handling: stop first if both stop and target could fill in one bar

MA Dist% Screener [Pineify]MA Distance Screener: Multi-Asset Market Scanner for TradingView
Screen multiple symbols and multiple timeframes on TradingView with the MA Distance Screener. Compare asset prices to flexible moving average types. Visual table view, custom assets, timeframes, and MA types. Supercharge your TradingView screener, optimize your workflow, and catch opportunities across assets in real time.
Key Features
Screen up to 10 custom symbols simultaneously across four configurable timeframes.
Choose from multiple Moving Average types: EMA, SMA, WMA, HMA, RMA, VWMA for flexible market context.
Visualize real-time % distance between price and moving average per asset/timeframe in a clean, color-coded table.
Highly customizable: Set your own symbol list, timeframes, MA length and type.
Alerts for symbol/MA deviations—instantly see overbought/oversold status with intuitive background coloring.
Optimized for crypto, FX, and traditional assets – all asset types supported.
How It Works
The MA Distance Screener acts as a dynamic multi-symbol, multi-timeframe scanner. For each selected symbol and timeframe, it calculates the percentage distance between the latest close price and the selected type of moving average (EMA/SMA/etc.). This is achieved by making secure `request.security` calls per asset/timeframe combination, retrieving updated values for each matrix cell. The computed distance (%) is displayed in a color-coded table: a positive value signals price above the MA (potential trend strength), while negatives indicate price below the MA (potential weakness or retracement). Custom colors highlight extreme overbought/oversold readings for quick visual cues.
Trading Ideas and Insights
Quickly spot assets showing the largest deviation from their moving averages – ideal for mean reversion or trend-following entries.
Identify clusters of assets and timeframes lining up in overbought or oversold states; optimize entries with multi-timeframe confirmation.
Scan the market in one glance—reduce chart-hopping and never miss an opportunity when multiple assets align for signals.
The ability to scan distance-to-MA across assets and periods gives traders a statistical edge, surfacing hidden pivots, breakouts, and mean-reversion trades that single-chart analysis may miss.
How Multiple Indicators Work Together
At its core, this screener allows the trader to configure what gets scanned—pick your top 10 assets and favorite 4 timeframes. With each matrix cell, the selected MA (e.g., 14-period EMA) is recalculated, and the current price's distance (%) from that value is computed. By offering six distinct moving average algorithms (EMA, SMA, RMA, HMA, WMA, VWMA), traders can choose their preferred method, adapting the screener for trend, swing, or mean-reversion style. All values are visualized in a single table, creating a true "market dashboard" effect for real-time cross-asset assessment.
Unique Aspects
True cross-asset, cross-timeframe screening in a unified table—rare for Pine Script indicators.
Full flexibility—customizable list of assets, timeframes, and MA parameters to suit any market/trading plan.
Intuitive color-coding and table display eliminates guesswork, enabling “at-a-glance” screening and rapid decision-making.
Efficient, optimized Pine v6 codebase—minimal lag even with 40+ concurrent streams.
How to Use
Add the indicator to your TradingView chart (overlay: off, use a clean chart).
In the settings panel, enter up to 10 symbols (tickers) you want to screen—crypto, stocks, FX, or indices.
Set the 4 timeframes to scan (e.g., 1m, 5m, 15m, 1h), plus your preferred moving average length and type.
Review the results in the pop-up table, where each cell shows "% Distance" from MA for each symbol/timeframe.
Monitor table background/text color for overbought vs. oversold cues.
Customization
Symbol List: Track any asset by typing its TradingView ticker.
Timeframes: Full freedom to select 4 timeframes per scan, from 1min to monthly.
MA Config: Choose period length and MA algorithm (classic or exotic types).
Color Themes: Easily spot signals with dynamic color backgrounds and customizable thresholds.
Conclusion
The MA Distance Screener is a must-have tool for systematic traders, portfolio managers, and retail chartists seeking a true multi-asset edge. With real-time cross-checking against multiple moving averages and timeframes, it empowers faster, more confident decision-making, while reducing chart fatigue and missed setups.
Unlock new insights, catch broad and hidden opportunities, and optimize your market workflow—all in a single TradingView panel.

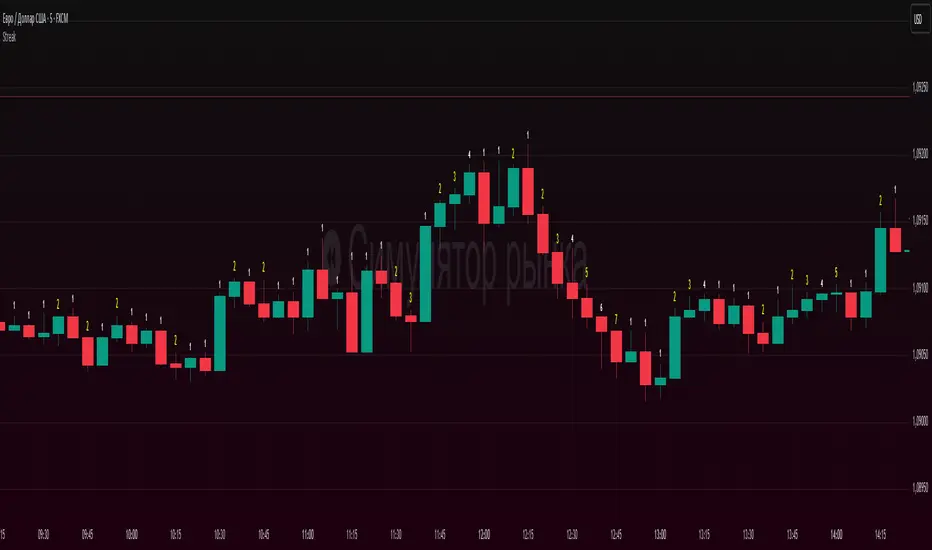
Candle count, with simple numberWhat it does
Counts the length of same-color candle streaks (consecutive bullish or bearish bars) and prints the running number above each bar:
e.g., “1, 2, 3…”; when color flips, it restarts at “1”.
Prime numbers (2, 3, 5, 7, 11, 13) are emphasized by rendering one size step larger and with a user-selected color.
Labels are pinned to each bar (anchored by bar index and price), so they do not drift when you pan or zoom the chart.
How it works
Determines candle direction: bullish if close > open, bearish if close < open.
If the current bar has the same direction as the previous bar, the counter increments; otherwise it resets to 1.
For values 2, 3, 5, 7, 11, 13 the number is highlighted (bigger + custom color).
Each number is drawn just above the bar’s High with a configurable offset.
The script does not repaint on history. During the live bar, the number updates in real time (as expected).
Settings
Digits size — Base text size (Tiny / Small / Normal / Large / Huge).
Prime numbers are automatically shown one step larger than the base size.
Offset above bar (ticks) — Vertical offset from the bar’s High, in instrument ticks.
Prime numbers color — Text color used specifically for prime numbers (non-prime digits are white).
How to read & use it
Rising momentum. Long streaks (e.g., 5–7+) suggest strong directional moves with few pullbacks.
Early pause/mean-reversion hints. After a long streak, the appearance of the opposite color (counter resets to “1”) often coincides with a pause or minor retrace.
Research & statistics. Quickly see which streak lengths are common on your market/timeframe (e.g., “How often do 3–5 bar runs occur?”).
Trade management. You can tie partial exits to specific streak lengths (2, 3, 5…) or reduce risk when the counter flips back to “1”.
Why it’s useful
Provides a clean, numeric view of momentum with zero smoothing or lag.
Works on any symbol and timeframe.
Prime-number emphasis makes important counts pop at a glance.
Pinned labels stay exactly above their bars, ensuring stable, readable visuals at any zoom level.
Notes
Doji bars (close == open) are treated as no direction and reset the streak.
This is a context tool, not a standalone buy/sell signal. Combine it with your entry/exit framework.
Very dense charts may hit platform label limits; the script raises the limit, but extremely long histories on very low timeframes can still be heavy.
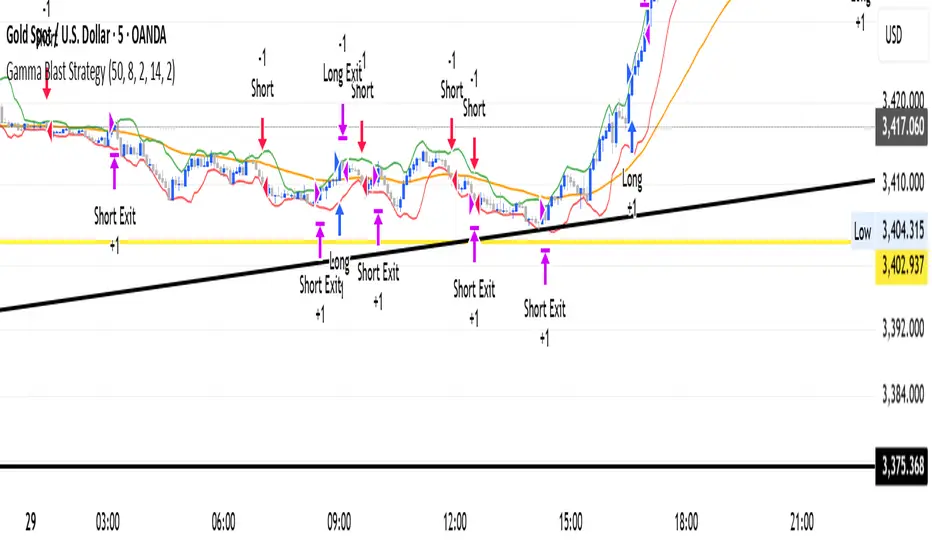
Gamma Blast StrategyGamma Blast Strategy used for quick 2-5 ticks on Buys, but on a sideways market can get up to 15-20 ticks.
IBS markerIndicator Description
This indicator provides a detailed analysis of the structure and volatility of each candlestick. It is designed to help traders better understand the balance between buying and selling pressure within individual bars, as well as the short-term volatility environment.
📌 Features
Candlestick Structure Analysis
Calculates the relative percentage of the upper wick, lower wick, and real body of each candle.
Helps traders visually and numerically evaluate whether a candle is dominated by bullish, bearish, or indecisive pressure.
IBS (Intraday Bar Strength)
Computes the Intraday Bar Strength value, showing where the close is located relative to the high-low range.
A high IBS indicates strong closing near the high, while a low IBS indicates weakness near the low.
Range Measurements
Displays the candlestick range in both price units and ticks.
Useful for traders who need precise range data for scalping or range-based strategies.
ATR (Average True Range) Volatility Filter
ATR is included with a configurable period setting.
Provides a contextual measure of volatility, helping traders compare current bar size against recent market behavior.
Dynamic Chart Labels
Key values (such as wick percentages, IBS, and range) are displayed directly on the chart through dynamic labels.
This allows for quick interpretation without opening extra panels or indicators.
📈 How to Use
Add the indicator to any chart and configure the settings (ATR period, label visibility, etc.) according to your trading style.
Use wick/body ratios to spot candles with unusual buying/selling pressure.
Combine IBS with ATR to identify potential exhaustion or continuation setups.
The dynamic labels are best used on lower timeframes for scalpers, but they can also provide insights on higher timeframes for swing traders.
🔍 Practical Applications
Identify reversal candles where one wick dominates.
Measure strength of breakouts by comparing candle body % and IBS values.
Detect volatility shifts by monitoring when bar ranges deviate from the ATR baseline.
Support scalping strategies that rely on tick-based range detection.
✅ Notes
This is a standalone indicator and does not require any other script to function.
Works on all markets (stocks, futures, forex, crypto).
For best results, use in conjunction with price action analysis or your preferred trading strategy.

IBS_WickandBody_ATRIndicator Description
This indicator provides a detailed analysis of the structure and volatility of each candlestick. It is designed to help traders better understand the balance between buying and selling pressure within individual bars, as well as the short-term volatility environment.
📌 Features
Candlestick Structure Analysis
Calculates the relative percentage of the upper wick, lower wick, and real body of each candle.
Helps traders visually and numerically evaluate whether a candle is dominated by bullish, bearish, or indecisive pressure.
IBS (Intraday Bar Strength)
Computes the Intraday Bar Strength value, showing where the close is located relative to the high-low range.
A high IBS indicates strong closing near the high, while a low IBS indicates weakness near the low.
Range Measurements
Displays the candlestick range in both price units and ticks.
Useful for traders who need precise range data for scalping or range-based strategies.
ATR (Average True Range) Volatility Filter
ATR is included with a configurable period setting.
Provides a contextual measure of volatility, helping traders compare current bar size against recent market behavior.
Dynamic Chart Labels
Key values (such as wick percentages, IBS, and range) are displayed directly on the chart through dynamic labels.
This allows for quick interpretation without opening extra panels or indicators.
📈 How to Use
Add the indicator to any chart and configure the settings (ATR period, label visibility, etc.) according to your trading style.
Use wick/body ratios to spot candles with unusual buying/selling pressure.
Combine IBS with ATR to identify potential exhaustion or continuation setups.
The dynamic labels are best used on lower timeframes for scalpers, but they can also provide insights on higher timeframes for swing traders.
🔍 Practical Applications
Identify reversal candles where one wick dominates.
Measure strength of breakouts by comparing candle body % and IBS values.
Detect volatility shifts by monitoring when bar ranges deviate from the ATR baseline.
Support scalping strategies that rely on tick-based range detection.
✅ Notes
This is a standalone indicator and does not require any other script to function.
Works on all markets (stocks, futures, forex, crypto).
For best results, use in conjunction with price action analysis or your preferred trading strategy.
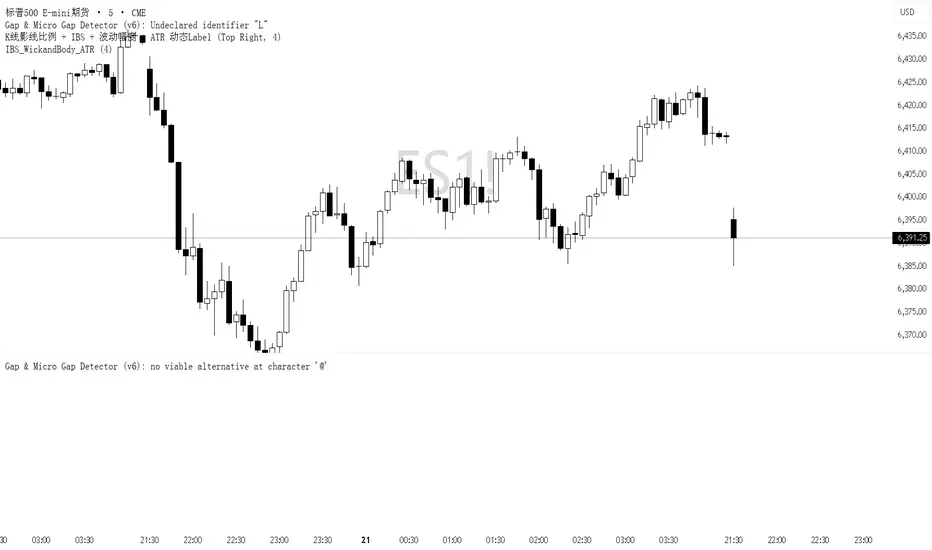
Candle Body Size AlertThis indicator monitors the body size of each candle (close minus open, ignoring wicks) and compares it to a user-defined threshold measured in ticks. If the candle body exceeds the threshold, the indicator triggers an alert condition at the close of the candle.
Features:
1. Adjustable threshold in ticks (default: 4000)
2. Adjustable timeframe (or use chart timeframe)
3. Alerts only at candle close (no intrabar signals)
Use Case:
Designed for traders who want to be notified when unusually large candles form, helping to identify strong momentum moves or volatility spikes.
Portfolio Tracker ARJO (V-01)Portfolio Tracker ARJO (V-01)
This indicator is a user-friendly portfolio tracking tool designed for TradingView charts. It overlays a customizable table on your chart to monitor up to 15 stocks or symbols in your portfolio. It calculates real-time metrics like current market price (CMP), gains/losses, and stoploss breaches, helping you stay on top of your investments without switching between multiple charts. The table uses color-coding for quick visual insights: green for profits, red for losses, and highlights breached stoplosses in red for alerts. It also shows portfolio-wide totals for overall performance.
Key Features
Supports up to 15 Symbols: Enter stock tickers (e.g., NSE:RELIANCE or BSE:TCS) with details like buy price, date, units, and stoploss.
Symbol: The stock ticker and description.
Buy Date: When you purchased it.
Units: Number of shares/units held.
Buy Price: Your entry price.
Stop Loss: Your set stoploss level (highlighted in red if breached by CMP).
CMP: Current market price (fetched from the chart's timeframe).
% Gain/Loss: Percentage change from buy price (color-coded: green for positive, red for negative).
Gain/Loss: Total monetary gain/loss based on units.
Optional Timeframe Columns: Toggle to show % change over 1 Week (1W), 1 Month (1M), 3 Months (3M), and 6 Months (6M) for historical performance.
Portfolio Summary: At the top of the table, see total % gain/loss and absolute gain/loss for your entire portfolio.
Visual Customizations: Adjust table position (e.g., Top Right), size, colors for positive/negative values, and intensity cutoff for gradients.
Benchmark Index-Based Header: The title row's background color reflects NIFTY's weekly trend (green if above 10-week SMA, red if below) for market context.
Benchmark Index-Based Header: The title row's background color reflects NIFTY's weekly trend (green if above 10-week SMA, red if below) for market context.
How to Use It: Step-by-Step Guide
Add the Indicator to Your Chart: Search for "Portfolio Tracker ARJO (V-01)" in TradingView's indicator library and add it to any chart (preferably Daily timeframe for accuracy).
Input Your Portfolio Symbols:
Open the indicator settings (gear icon).
In the "Symbol 1" to "Symbol 15" groups, fill in:
Symbol: Enter the ticker (e.g., NSE:INFY).
Year/Month/Day: Select your buy date (e.g., 2024-07-01).
Buy Price: Your purchase price per unit.
Stoploss: Your exit price if things go south.
Units: How many shares you own.
Only fill what you need—leave extras blank. The table auto-adjusts to show only entered symbols.
Customize the Table (Optional):
In "Table settings":
Choose position (e.g., Top Right) and size (% of chart).
Toggle "Show Timeframe Columns" to add 1W/1M/3M/6M performance.
In "Color settings":
Pick colors for positive (green) and negative (red) cells.
Set "Color intensity cutoff (%)" to control how strong the colors get (e.g., 10% means changes above 10% max out the color).
Interpret the Table on Your Chart:
The table appears overlaid—scan rows for each symbol's stats.
Look at colors: Greener = better gains; redder = bigger losses.
Check CMP cell: Red means stoploss breached—consider selling!
Portfolio Gain/Loss at the top gives a quick overall health check.
For Best Results:
Use on a Daily chart to avoid CMP errors (the script will warn if on Weekly/Monthly).
Refresh the chart or wait for a new bar if data doesn't update immediately.
For Indian stocks, prefix with NSE: or BSE: (e.g., BSE:RELIANCE).
This is for tracking only—not trading signals. Combine with your strategy.
If no symbols show, ensure inputs are valid (e.g., buy price > 0, valid date).
Finally, this tool makes it quite easy for beginners to track their portfolios, while also giving advanced traders powerful and customizable insights. I'd love to hear your feedback—happy trading!

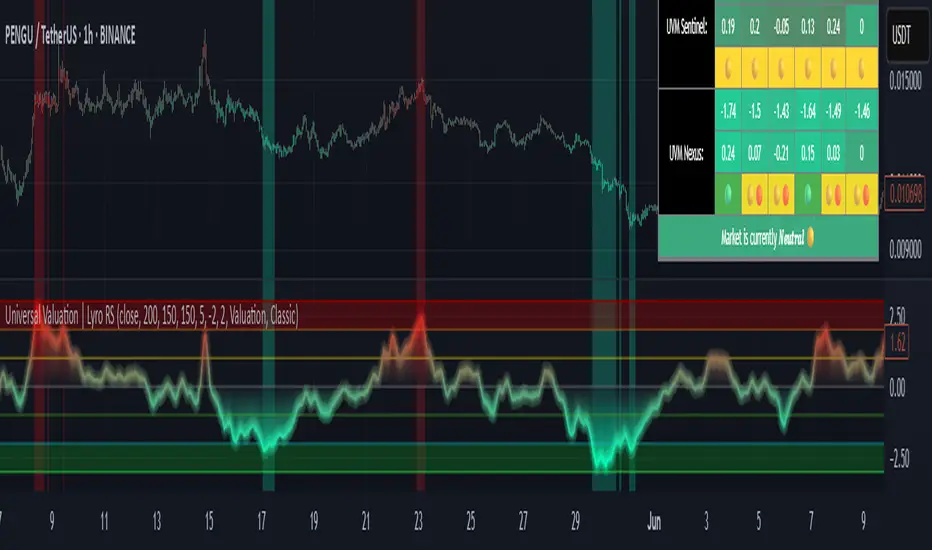
Universal Valuation | Lyro RSUniversal Valuation
⚠️Disclaimer: This indicator is a tool for technical analysis and does not provide guaranteed results. It should be used in conjunction with other analysis methods and proper risk management practices. The creators of this indicator are not responsible for any financial decisions made based on its signals.
Overview
The Universal Valuation indicator helps identify whether the market is undervalued/cheap or overvalued/expensive. And another mode this indicator offers is This cutting-edge tool works flawlessly ACROSS ALL TIMEFRAMES & TICKERS/CHARTS.
By combining regular TradingView indicators & some of our valuation indicators basic/simple with advanced statistical functions, this indicator offers a powerful, universal valuation tool.
Key Features
INPUTS: The Universal Valuation indicator offers flexibility through its customizable input sections. The "Indicator Settings" let you adjust lengths for the raw indicators and statistical functions. The "Signals" section defines thresholds for background color changes, helping you visually spot key market moments. The "Colors" section allows you to pick from pre-defined schemes or personalize colors for better clarity. Lastly, the "Tables" section gives you full control over the UV table’s size and positioning, including options to overlay it on the chart or place it in the allocated space.
A DEEPER INSIGHT: This indicator is built around three distinct categories: "UVM Andromeda," "UVM Sentinel," and "UVM Nexus." Each category has three different drivers. The statistical function powering this indicator is the Z-score. The Z-score is an incredibly powerful tool that helps determine if the market is overvalued/expensive or undervalued/cheap, offering critical insights for traders."
Plotting: The plotted value represents the average of all the drivers. In other words, it is the combined average of all 9 Z-scored indicators, providing a balanced and comprehensive market valuation.
What is Z-score? & Why does this system use it?
Z-score is an advanced statistical function used to measure how far a value deviates from the average in a data set. The formula for Z-score is: (x - h) / o, where x is the observed value, h is the average (mean) of the data set, and o is the standard deviation.
This system uses the Z-score because it helps determine whether the market is overvalued or undervalued based on historical data and how we apply the calculation. By measuring how far a value deviates from the average, the Z-score provides a clearer and more objective valuation of market conditions. In our case, a Z-score of -3 indicates an undervalued market, while a Z-score of 3 signals an overvalued market.
UVM Andromeda:
UVM stands for Universal Valuation Model, which is the core of this indicator. Andromeda, one of the most stunning galaxies in the universe, inspired by its name. We chose this name because a powerful indicator should not only be effective but also visually appealing.
You might be wondering what drives UVM Andromeda. The three key drivers are Price, RSI, and ROC. These indicators are pre-defined, while the "Indicator Settings" allow you to adjust the length of the Z-score calculation, refining how the model analyzes market conditions.
UVM Sentinel:
Sentinel, refers to a guard or watchman, someone or something that keeps watch and provides protection. In our case this name refers to a model that actively observes market conditions, acting as a vigilant tool that signals important shifts in valuation.
Wondering what drives UVM Sentinel? The three key drivers are BB%, CCI, and Crosby. While these indicators are simple on their own, applying our Z-score function elevates them to a whole new level, enhancing their ability to detect market conditions with greater accuracy.
UVM Nexus:
We chose the name Nexus simply because it sounds cool—there’s no deeper meaning behind it for us. However, the word itself does have a meaning; it refers to a connection or link between multiple things.
The three key drivers for UVM Nexus are the Sharpe, Sortino, and Omega ratios. These are all asset performance metrics, but by applying the Z-score, we transform them into powerful valuation indicators/drivers, giving you a deeper insight into market conditions.
Why do we use 9 different indicators instead of 1?
That's a great question, and the answer is quite simple. Think of it like this: if you have one super soldier, and they miss a shot, it’s game over. But if you have many soldiers, even if one misses, the others can step in and take the shot. The strength of using multiple indicators lies in their collective power – if one misses, the others still provide valuable insights, making the overall system more reliable.
Final Thoughts:
In our Universal Valuation indicator, you have the flexibility to customize it however you like using our inputs. The system is divided into three distinct categories, with each category containing three indicators. The value plotted on the chart is the average of all nine indicators. We apply the Z-score, an advanced statistical function, to each of these nine indicators. The final plotted average is the average of all the Z-scores, giving you a comprehensive and refined market valuation. This indicator can work on any timeframe & chart ticker.
Sector SPDR ETFsThis script automatically identifies the SPDR sector ETF that corresponds to the currently viewed US stock ticker. It maps over 500 US-listed stocks to their respective SPDR sector ETFs — such as XLK (Technology), XLF (Financials), XLY (Consumer Discretionary), and others — based on pre-defined symbol lists.
When applied to a chart, the script displays a label below the last candle showing the SPDR sector symbol (e.g., "XLE" for Energy stocks like XOM). This allows traders and investors to quickly understand the sector classification of any stock they analyze.
Key Features:
Maps tickers to SPDR sector ETFs: XLC, XLY, XLP, XLE, XLF, XLV, XLI, XLB, XLRE, XLK, and XLU.
Displays the corresponding sector label on the chart.
Helpful for sector rotation strategies, macro analysis, or thematic investing.

log.info() - 5 Exampleslog.info() is one of the most powerful tools in Pine Script that no one knows about. Whenever you code, you want to be able to debug, or find out why something isn’t working. The log.info() command will help you do that. Without it, creating more complex Pine Scripts becomes exponentially more difficult.
The first thing to note is that log.info() only displays strings. So, if you have a variable that is not a string, you must turn it into a string in order for log.info() to work. The way you do that is with the str.tostring() command. And remember, it's all lower case! You can throw in any numeric value (float, int, timestamp) into str.string() and it should work.
Next, in order to make your output intelligible, you may want to identify whatever value you are logging. For example, if an RSI value is 50, you don’t want a bunch of lines that just say “50”. You may want it to say “RSI = 50”.
To do that, you’ll have to use the concatenation operator. For example, if you have a variable called “rsi”, and its value is 50, then you would use the “+” concatenation symbol.
EXAMPLE 1
━━━━━━━━━━━━━━━━━━━━━━━━━━━━━━━━━
//@version=6
indicator("log.info()")
rsi = ta.rsi(close,14)
log.info(“RSI= ” + str.tostring(rsi))
Example Output =>
RSI= 50
Here, we use double quotes to create a string that contains the name of the variable, in this case “RSI = “, then we concatenate it with a stringified version of the variable, rsi.
Now that you know how to write a log, where do you view them? There isn’t a lot of documentation on it, and the link is not conveniently located.
Open up the “Pine Editor” tab at the bottom of any chart view, and you’ll see a “3 dot” button at the top right of the pane. Click that, and right above the “Help” menu item you’ll see “Pine logs”. Clicking that will open that to open a pane on the right of your browser - replacing whatever was in the right pane area before. This is where your log output will show up.
But, because you’re dealing with time series data, using the log.info() command without some type of condition will give you a fast moving stream of numbers that will be difficult to interpret. So, you may only want the output to show up once per bar, or only under specific conditions.
To have the output show up only after all computations have completed, you’ll need to use the barState.islast command. Remember, barState is camelCase, but islast is not!
EXAMPLE 2
━━━━━━━━━━━━━━━━━━━━━━━━━━━━━━━━━
//@version=6
indicator("log.info()")
rsi = ta.rsi(close,14)
if barState.islast
log.info("RSI=" + str.tostring(rsi))
plot(rsi)
However, this can be less than ideal, because you may want the value of the rsi variable on a particular bar, at a particular time, or under a specific chart condition. Let’s hit these one at a time.
In each of these cases, the built-in bar_index variable will come in handy. When debugging, I typically like to assign a variable “bix” to represent bar_index, and include it in the output.
So, if I want to see the rsi value when RSI crosses above 0.5, then I would have something like
EXAMPLE 3
━━━━━━━━━━━━━━━━━━━━━━━━━━━━━━━━━
//@version=6
indicator("log.info()")
rsi = ta.rsi(close,14)
bix = bar_index
rsiCrossedOver = ta.crossover(rsi,0.5)
if rsiCrossedOver
log.info("bix=" + str.tostring(bix) + " - RSI=" + str.tostring(rsi))
plot(rsi)
Example Output =>
bix=19964 - RSI=51.8449459867
bix=19972 - RSI=50.0975830828
bix=19983 - RSI=53.3529808079
bix=19985 - RSI=53.1595745146
bix=19999 - RSI=66.6466337654
bix=20001 - RSI=52.2191767466
Here, we see that the output only appears when the condition is met.
A useful thing to know is that if you want to limit the number of decimal places, then you would use the command str.tostring(rsi,”#.##”), which tells the interpreter that the format of the number should only be 2 decimal places. Or you could round the rsi variable with a command like rsi2 = math.round(rsi*100)/100 . In either case you’re output would look like:
bix=19964 - RSI=51.84
bix=19972 - RSI=50.1
bix=19983 - RSI=53.35
bix=19985 - RSI=53.16
bix=19999 - RSI=66.65
bix=20001 - RSI=52.22
This would decrease the amount of memory that’s being used to display your variable’s values, which can become a limitation for the log.info() command. It only allows 4096 characters per line, so when you get to trying to output arrays (which is another cool feature), you’ll have to keep that in mind.
Another thing to note is that log output is always preceded by a timestamp, but for the sake of brevity, I’m not including those in the output examples.
If you wanted to only output a value after the chart was fully loaded, that’s when barState.islast command comes in. Under this condition, only one line of output is created per tick update — AFTER the chart has finished loading. For example, if you only want to see what the the current bar_index and rsi values are, without filling up your log window with everything that happens before, then you could use the following code:
EXAMPLE 4
━━━━━━━━━━━━━━━━━━━━━━━━━━━━━━━━━
//@version=6
indicator("log.info()")
rsi = ta.rsi(close,14)
bix = bar_index
if barstate.islast
log.info("bix=" + str.tostring(bix) + " - RSI=" + str.tostring(rsi))
Example Output =>
bix=20203 - RSI=53.1103309071
This value would keep updating after every new bar tick.
The log.info() command is a huge help in creating new scripts, however, it does have its limitations. As mentioned earlier, only 4096 characters are allowed per line. So, although you can use log.info() to output arrays, you have to be aware of how many characters that array will use.
The following code DOES NOT WORK! And, the only way you can find out why will be the red exclamation point next to the name of the indicator. That, and nothing will show up on the chart, or in the logs.
// CODE DOESN’T WORK
//@version=6
indicator("MW - log.info()")
var array rsi_arr = array.new()
rsi = ta.rsi(close,14)
bix = bar_index
rsiCrossedOver = ta.crossover(rsi,50)
if rsiCrossedOver
array.push(rsi_arr, rsi)
if barstate.islast
log.info("rsi_arr:" + str.tostring(rsi_arr))
log.info("bix=" + str.tostring(bix) + " - RSI=" + str.tostring(rsi))
plot(rsi)
// No code errors, but will not compile because too much is being written to the logs.
However, after putting some time restrictions in with the i_startTime and i_endTime user input variables, and creating a dateFilter variable to use in the conditions, I can limit the size of the final array. So, the following code does work.
EXAMPLE 5
━━━━━━━━━━━━━━━━━━━━━━━━━━━━━━━━━
// CODE DOES WORK
//@version=6
indicator("MW - log.info()")
i_startTime = input.time(title="Start", defval=timestamp("01 Jan 2025 13:30 +0000"))
i_endTime = input.time(title="End", defval=timestamp("1 Jan 2099 19:30 +0000"))
var array rsi_arr = array.new()
dateFilter = time >= i_startTime and time <= i_endTime
rsi = ta.rsi(close,14)
bix = bar_index
rsiCrossedOver = ta.crossover(rsi,50) and dateFilter // <== The dateFilter condition keeps the array from getting too big
if rsiCrossedOver
array.push(rsi_arr, rsi)
if barstate.islast
log.info("rsi_arr:" + str.tostring(rsi_arr))
log.info("bix=" + str.tostring(bix) + " - RSI=" + str.tostring(rsi))
plot(rsi)
Example Output =>
rsi_arr:
bix=20210 - RSI=56.9030578034
Of course, if you restrict the decimal places by using the rounding the rsi value with something like rsiRounded = math.round(rsi * 100) / 100 , then you can further reduce the size of your array. In this case the output may look something like:
Example Output =>
rsi_arr:
bix=20210 - RSI=55.6947486019
This will give your code a little breathing room.
In a nutshell, I was coding for over a year trying to debug by pushing output to labels, tables, and using libraries that cluttered up my code. Once I was able to debug with log.info() it was a game changer. I was able to start building much more advanced scripts. Hopefully, this will help you on your journey as well.

Options Strategy V1.3📈 Options Strategy V1.3 — EMA Crossover + RSI + ATR + Opening Range
Overview:
This strategy is designed for short-term directional trades on large-cap stocks or ETFs, especially when trading options. It combines classic trend-following signals with momentum confirmation, volatility-based risk management, and session timing filters to help identify high-probability entries with predefined stop-loss and profit targets.
🔍 Strategy Components:
EMA Crossover (Fast/Slow)
Entry signals are triggered by the crossover of a short EMA above or below a long EMA — a traditional trend-following method to detect shifts in momentum.
RSI Filter
RSI confirms the signal by avoiding entries in overbought/oversold zones unless certain momentum conditions are met.
Long entry requires RSI ≥ Long Threshold
Short entry requires RSI ≤ Short Threshold
ATR-Based SL & TP
Stop-loss is set dynamically as a multiple of ATR below (long) or above (short) the entry price.
Take-profit is placed as a ratio (TP/SL) of the stop distance, ensuring consistent reward/risk structure.
Opening Range Filter (Optional)
If enabled, the strategy only triggers trades after price breaks out of the 09:30–09:45 EST range, ensuring participation in directional moves.
Session Filters
No trades from 04:00 to 09:30 and from 16:00 to 20:00 EST, avoiding low-liquidity periods.
All open trades are closed at 15:55 EST, to avoid overnight risk or expiration issues for options.
⚙️ Built-in Presets:
You can choose one of the built-in ticker-specific presets for optimal conditions:
Ticker EMAs RSI (Long/Short) ATR SL×ATR TP/SL
SPY 8/28 56 / 26 14 1.4× 4.0×
TSLA 23/27 56 / 33 13 1.4× 3.6×
AAPL 6/13 61 / 26 23 1.4× 2.1×
MSFT 25/32 54 / 26 14 1.2× 2.2×
META 25/32 53 / 26 17 1.8× 2.3×
AMZN 28/32 55 / 25 16 1.8× 2.3×
You can also choose "Custom" to fully configure all parameters to your own market and strategy preferences.
📌 Best Use Case:
This strategy is especially suited for intraday options trading, where timing and risk control are critical. It works best on liquid tickers with strong trends or clear breakout behavior.

Simple Risk-to-Reward (R) Indicator (TP1–TP2)What this indicator does:
This tool helps traders clearly visualize their risk and reward on any trade by plotting their entry, stop loss, and take-profit (TP) levels directly on the chart. It’s designed to make manual trade planning more visual and systematic.
How it works:
You set your planned entry price, whether you want to plot a Long or Short setup, and your stop-loss distance (in ticks).
The indicator calculates your stop-loss level and automatically plots it on the chart.
It then draws take-profit levels at 1R and 2R (where “R” is your risk, the distance between entry and stop).
You can toggle the TP1 and TP2 lines on or off to suit your preference.
How to use it:
Open the settings and enter your intended entry price.
Select “Long Setup” for a buy trade, or turn it off for a sell/short trade.
Enter your desired stop loss in ticks.
Choose which take-profit levels to display by toggling TP1 and TP2.
The indicator will show entry, stop, and take-profit levels right on your chart so you can easily see your planned risk/reward.
What makes it unique and useful:
This indicator is designed for manual trade planning, giving you full control over your inputs and letting you instantly see your risk/reward on any instrument or timeframe. Unlike some built-in tools, it supports both long and short trades, lets you set all levels manually, and keeps your charts clean and easy to interpret.

Long/Short/Exit/Risk management Strategy # LongShortExit Strategy Documentation
## Overview
The LongShortExit strategy is a versatile trading system for TradingView that provides complete control over entry, exit, and risk management parameters. It features a sophisticated framework for managing long and short positions with customizable profit targets, stop-loss mechanisms, partial profit-taking, and trailing stops. The strategy can be enhanced with continuous position signals for visual feedback on the current trading state.
## Key Features
### General Settings
- **Trading Direction**: Choose to trade long positions only, short positions only, or both.
- **Max Trades Per Day**: Limit the number of trades per day to prevent overtrading.
- **Bars Between Trades**: Enforce a minimum number of bars between consecutive trades.
### Session Management
- **Session Control**: Restrict trading to specific times of the day.
- **Time Zone**: Specify the time zone for session calculations.
- **Expiration**: Optionally set a date when the strategy should stop executing.
### Contract Settings
- **Contract Type**: Select from common futures contracts (MNQ, MES, NQ, ES) or custom values.
- **Point Value**: Define the dollar value per point movement.
- **Tick Size**: Set the minimum price movement for accurate calculations.
### Visual Signals
- **Continuous Position Signals**: Implement 0 to 1 visual signals to track position states.
- **Signal Plotting**: Customize color and appearance of position signals.
- **Clear Visual Feedback**: Instantly see when entry conditions are triggered.
### Risk Management
#### Stop Loss and Take Profit
- **Risk Type**: Choose between percentage-based, ATR-based, or points-based risk management.
- **Percentage Mode**: Set SL/TP as a percentage of entry price.
- **ATR Mode**: Set SL/TP as a multiple of the Average True Range.
- **Points Mode**: Set SL/TP as a fixed number of points from entry.
#### Advanced Exit Features
- **Break-Even**: Automatically move stop-loss to break-even after reaching specified profit threshold.
- **Trailing Stop**: Implement a trailing stop-loss that follows price movement at a defined distance.
- **Partial Profit Taking**: Take partial profits at predetermined price levels:
- Set first partial exit point and percentage of position to close
- Set second partial exit point and percentage of position to close
- **Time-Based Exit**: Automatically exit a position after a specified number of bars.
#### Win/Loss Streak Management
- **Streak Cutoff**: Automatically pause trading after a series of consecutive wins or losses.
- **Daily Reset**: Option to reset streak counters at the start of each day.
### Entry Conditions
- **Source and Value**: Define the exact price source and value that triggers entries.
- **Equals Condition**: Entry signals occur when the source exactly matches the specified value.
### Performance Analytics
- **Real-Time Stats**: Track important performance metrics like win rate, P&L, and largest wins/losses.
- **Visual Feedback**: On-chart markers for entries, exits, and important events.
### External Integration
- **Webhook Support**: Compatible with TradingView's webhook alerts for automated trading.
- **Cross-Platform**: Connect to external trading systems and notification platforms.
- **Custom Order Execution**: Implement advanced order flows through external services.
## How to Use
### Setup Instructions
1. Add the script to your TradingView chart.
2. Configure the general settings based on your trading preferences.
3. Set session trading hours if you only want to trade specific times.
4. Select your contract specifications or customize for your instrument.
5. Configure risk parameters:
- Choose your preferred risk management approach
- Set appropriate stop-loss and take-profit levels
- Enable advanced features like break-even, trailing stops, or partial profit taking as needed
6. Define entry conditions:
- Select the price source (such as close, open, high, or an indicator)
- Set the specific value that should trigger entries
### Entry Condition Examples
- **Example 1**: To enter when price closes exactly at a whole number:
- Long Source: close
- Long Value: 4200 (for instance, to enter when price closes exactly at 4200)
- **Example 2**: To enter when an indicator reaches a specific value:
- Long Source: ta.rsi(close, 14)
- Long Value: 30 (triggers when RSI equals exactly 30)
### Best Practices
1. **Always backtest thoroughly** before using in live trading.
2. **Start with conservative risk settings**:
- Small position sizes
- Reasonable stop-loss distances
- Limited trades per day
3. **Monitor and adjust**:
- Use the performance table to track results
- Adjust parameters based on how the strategy performs
4. **Consider market volatility**:
- Use ATR-based stops during volatile periods
- Use fixed points during stable markets
## Continuous Position Signals Implementation
The LongShortExit strategy can be enhanced with continuous position signals to provide visual feedback about the current position state. These signals can help you track when the strategy is in a long or short position.
### Adding Continuous Position Signals
Add the following code to implement continuous position signals (0 to 1):
```pine
// Continuous position signals (0 to 1)
var float longSignal = 0.0
var float shortSignal = 0.0
// Update position signals based on your indicator's conditions
longSignal := longCondition ? 1.0 : 0.0
shortSignal := shortCondition ? 1.0 : 0.0
// Plot continuous signals
plot(longSignal, title="Long Signal", color=#00FF00, linewidth=2, transp=0, style=plot.style_line)
plot(shortSignal, title="Short Signal", color=#FF0000, linewidth=2, transp=0, style=plot.style_line)
```
### Benefits of Continuous Position Signals
- Provides clear visual feedback of current position state (long/short)
- Signal values stay consistent (0 or 1) until condition changes
- Can be used for additional calculations or alert conditions
- Makes it easier to track when entry conditions are triggered
### Using with Custom Indicators
You can adapt the continuous position signals to work with any custom indicator by replacing the condition with your indicator's logic:
```pine
// Example with moving average crossover
longSignal := fastMA > slowMA ? 1.0 : 0.0
shortSignal := fastMA < slowMA ? 1.0 : 0.0
```
## Webhook Integration
The LongShortExit strategy is fully compatible with TradingView's webhook alerts, allowing you to connect your strategy to external trading platforms, brokers, or custom applications for automated trading execution.
### Setting Up Webhooks
1. Create an alert on your chart with the LongShortExit strategy
2. Enable the "Webhook URL" option in the alert dialog
3. Enter your webhook endpoint URL (from your broker or custom trading system)
4. Customize the alert message with relevant information using TradingView variables
### Webhook Message Format Example
```json
{
"strategy": "LongShortExit",
"action": "{{strategy.order.action}}",
"price": "{{strategy.order.price}}",
"quantity": "{{strategy.position_size}}",
"time": "{{time}}",
"ticker": "{{ticker}}",
"position_size": "{{strategy.position_size}}",
"position_value": "{{strategy.position_value}}",
"order_id": "{{strategy.order.id}}",
"order_comment": "{{strategy.order.comment}}"
}
```
### TradingView Alert Condition Examples
For effective webhook automation, set up these alert conditions:
#### Entry Alert
```
{{strategy.position_size}} != {{strategy.position_size}}
```
#### Exit Alert
```
{{strategy.position_size}} < {{strategy.position_size}} or {{strategy.position_size}} > {{strategy.position_size}}
```
#### Partial Take Profit Alert
```
strategy.order.comment contains "Partial TP"
```
### Benefits of Webhook Integration
- **Automated Trading**: Execute trades automatically through supported brokers
- **Cross-Platform**: Connect to custom trading bots and applications
- **Real-Time Notifications**: Receive trade signals on external platforms
- **Data Collection**: Log trade data for further analysis
- **Custom Order Management**: Implement advanced order types not available in TradingView
### Compatible External Applications
- Trading bots and algorithmic trading software
- Custom order execution systems
- Discord, Telegram, or Slack notification systems
- Trade journaling applications
- Risk management platforms
### Implementation Recommendations
- Test webhook delivery using a free service like webhook.site before connecting to your actual trading system
- Include authentication tokens or API keys in your webhook URL or payload when required by your external service
- Consider implementing confirmation mechanisms to verify trade execution
- Log all webhook activities for troubleshooting and performance tracking
## Strategy Customization Tips
### For Scalping
- Set smaller profit targets (1-3 points)
- Use tighter stop-losses
- Enable break-even feature after small profit
- Set higher max trades per day
### For Day Trading
- Use moderate profit targets
- Implement partial profit taking
- Enable trailing stops
- Set reasonable session trading hours
### For Swing Trading
- Use longer-term charts
- Set wider stops (ATR-based often works well)
- Use higher profit targets
- Disable daily streak reset
## Common Troubleshooting
### Low Win Rate
- Consider widening stop-losses
- Verify that entry conditions aren't triggering too frequently
- Check if the equals condition is too restrictive; consider small tolerances
### Missing Obvious Trades
- The equals condition is extremely precise. Price must exactly match the specified value.
- Consider using floating-point precision for more reliable triggers
### Frequent Stop-Outs
- Try ATR-based stops instead of fixed points
- Increase the stop-loss distance
- Enable break-even feature to protect profits
## Important Notes
- The exact equals condition is strict and may result in fewer trade signals compared to other conditions.
- For instruments with decimal prices, exact equality might be rare. Consider the precision of your value.
- Break-even and trailing stop calculations are based on points, not percentage.
- Partial take-profit levels are defined in points distance from entry.
- The continuous position signals (0 to 1) provide valuable visual feedback but don't affect the strategy's trading logic directly.
- When implementing continuous signals, ensure they're aligned with the actual entry conditions used by the strategy.
---
*This strategy is for educational and informational purposes only. Always test thoroughly before using with real funds.*

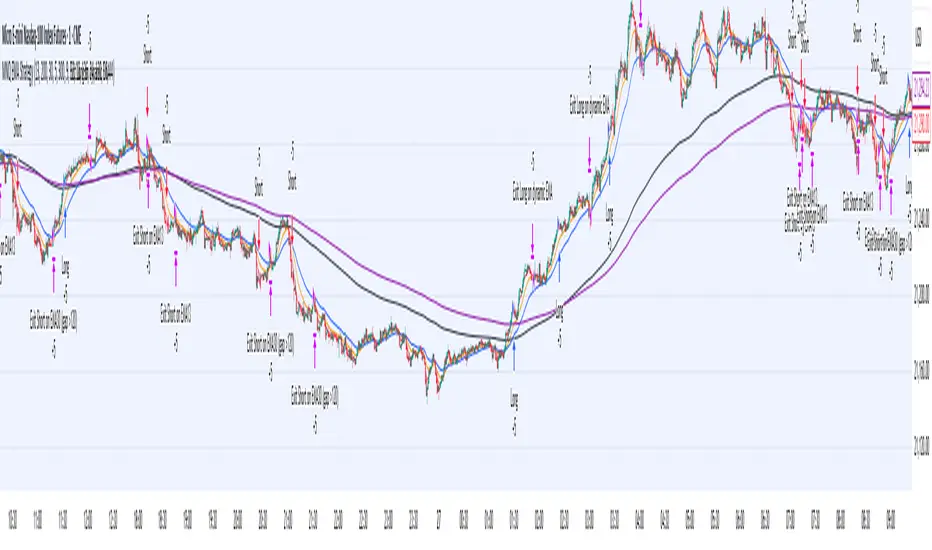
MNQ EMA StrategyThis strategy is not perfected yet. ONE MINUTE TIMEFRAME
The goal is to take Longs above the 5 ema when price is above all the 200, 30, and 5 ema.
Short side is when candle closes below the 5 ema and price is below the 300, 30, and 5 ema.
I use candle range blocks for different time zones to avoid excess orders from being triggered. As well as blocks when stoploss is hit or after a profitable trade of certain ticks.
There is an RSI to avoid trades when there isn't too much movement.
My goal is to get an entry when price trades above the 5 ema and then next candle passes it by .25 instead of entering immediately. The stoploss as the low of candle before entry and TP as 3 times the stoploss. I've tried a million times to make it like this but I don't know how to use pine script or Code.
The sell side is basically the same, enter at candle close below 5 ema wait for low to get swept to enter and stoploss above previous high, with TP 3 times the stoploss.
Publishing in hopes anyone knows how to adjust this
CAUTION THIS STRATEGY WORKS WITH CURRENT PRICE ACTION DUE TO ME USING RECENT TICK COUNT RATHER THAN BASED ON CANDLES OR PERCENTAGES. THIS WILL ONLY WORK AS LONG AS MARKET MOVES AS IT HAS BEEN SINCE 2024. CME_MINI:MNQ1!
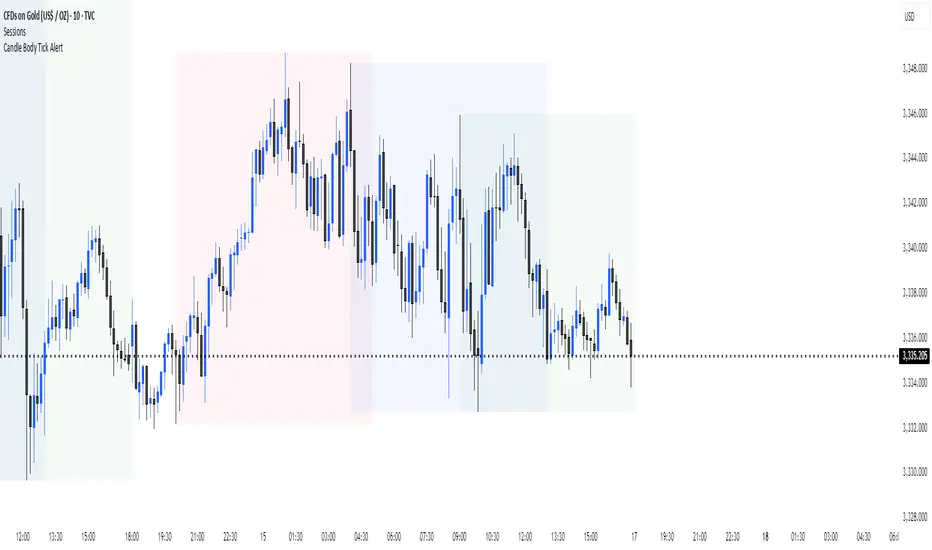
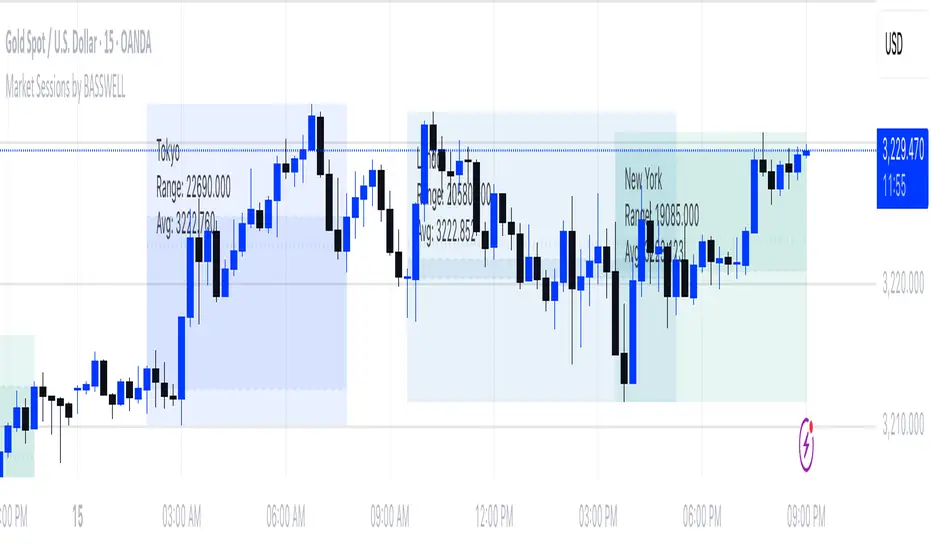
Market Sessions by BASSWELLThis TradingView indicator visually highlights major global trading sessions (Tokyo, London, New York) directly on intraday charts. It provides a clear, color-coded display of session activity and key statistics to help traders better understand session dynamics and overlaps.
✅ Key Features:
Visual Session Boxes: Draws background boxes for each session with configurable colors.
Session Names: Displays the name of each session as a label above the session box.
Open/Close Lines: Optionally shows dashed lines at session open and close prices.
Average Price Line: Plots the average session price as a dotted line.
Tick Range Display: Calculates and shows the high-low range in ticks.
Time Zone Support: Fully timezone-aware via IANA definitions (e.g. "Europe/London").
Overlap Handling: Automatically dims older sessions when a new one starts for visual clarity.
🔧 Configurable Parameters:
Show/hide each session individually.
Set session times and timezones.
Customize label visibility and box contents.
Adjust session colors with transparency.
Includes basic visual styling for better chart readability.
⚠️ Note: Works only on intraday timeframes. Daily/weekly/monthly charts are not supported.
Retirement Portfolio Dashboard1. Set It Up
Paste the script into the Pine Script editor in TradingView
Add to chart (use a daily chart for any TSX ticker)
Configure the inputs on the right panel:
Choose your ETF tickers (default: VFV, XAW, XIC)
Enter your target allocations (U.S., Global, Canada, Cash)
Set your current portfolio value and contribution plan
Adjust your expected return and rebalance trigger
📊 2. What It Tracks
💼 Allocation Overview
Target vs. actual % for each asset class
CAD value of each component
Performance YTD based on Jan 2nd start
Drift % to see how far each asset has deviated
📈 Growth Forecast
Future value projection with contributions
Weighted return (based on typical historical returns)
Inflation-adjusted real return (assuming 2% inflation)
⚠ Rebalancing
If any drift exceeds your set threshold (e.g., 5%), the script:
Highlights the issue in red
Displays "⚠ Rebalance Suggested"
Triggers a TradingView alert if you've activated it
🔔 3. Set Up Alerts
Go to Alerts > Create Alert
Choose your script from the dropdown
Under Condition, select "Rebalance Alert"
Choose your desired alert type (popup, email, webhook, etc.)
✅ 4. How to Use It Effectively
Task What to Do
Monitor allocations Check dashboard weekly or monthly
Spot imbalances Use Drift % and Status (green/red)
Forecast retirement growth Adjust contributions, return rate, and horizon
Prepare to rebalance Use alerts when drift > threshold
Tune assumptions Change expected returns or inflation rate as needed
💡 Tips
You can edit return assumptions (e.g., make Global equity more conservative)
Use this on a “blank” ticker (like TSX:XIC) so you don't overlay the chart
Copy values from your broker or retirement account to update real allocations
