LANZ Strategy 2.0 [Backtest]🔷 LANZ Strategy 2.0 — Structural Breakout Logic with Dynamic Swing Protection
LANZ Strategy 2.0 is a precision-focused backtesting system built for intraday traders who rely on structural confirmations before the London session to guide directional bias. This tool uses smart swing detection, risk-defined position sizing, and strict time-based execution to simulate real trading conditions with clarity and control.
🧠 Core Components:
Structural Confirmation (Trend & BoS): Detects trend direction and break of structure (BoS) using a three-swing logic, aligning trade entries with valid structural movement.
Time-Based Execution: Trades are triggered exclusively at 02:00 a.m. New York time, ensuring disciplined and repeatable intraday testing.
Swing-Based SL Models: Traders can select between three stop-loss protection types:
First Swing: Most recent structural level
Second Swing: Prior level
Full Coverage: All recent swing levels + configurable pip buffer
Dynamic TP Calculation: Take-Profit is projected as a risk-based multiple (RR), fully adjustable via input.
Capital-Based Risk Management: Risk is defined as a percentage of a fixed account size (e.g., $100 per trade from $10,000), and lot size is automatically calculated based on SL distance.
Fallback Entry Logic: If structural breakout is present but trend is not confirmed, a secondary entry is triggered.
End-of-Session Management: Any open trades are automatically closed at 11:45 a.m. NY time, with optional manual labeling or review.
📊 Visual Features (Optional in Indicator Version):
(Note: Visuals apply to the indicator version of LANZ 2.0, not this backtest script)
Swing level labels (1st, 2nd) and dynamic SL/TP lines.
Real-time session coloring for clarity: Pre-London, Entry Window, and NY Close.
Outcome labels: +RR, -RR, or net % at close.
Auto-cleanup of previous drawings for a clean chart per session.
⚙️ How It Works:
Detects last trend and BoS using swing logic before 02:00 a.m. NY.
At 02:00 a.m., evaluates directional bias and executes BUY or SELL if confirmed.
Applies selected SL logic (1st, 2nd, or full swing protection).
Sets TP based on the RR multiplier.
Closes the trade either on SL, TP, or at 11:45 a.m. NY manually.
🔔 Alerts:
Time-of-day alert at 02:00 a.m. NY to monitor execution.
Can be extended to cover SL/TP triggers or new BoS events.
📝 Notes:
Designed for backtesting precision and discretionary decision-making.
Ideal for Forex pairs, indices, or assets active during the London session.
Fully customizable: session timing, swing logic, SL buffer, and RR.
👤 Credits:
Strategy built by @rau_u_lanz using Pine Script v6, combining structural logic, capital-based risk control, and London-session timing in a backtest-ready framework for traders who demand accuracy and structure.
Cari dalam skrip untuk "沪深主板45度上升的股票"

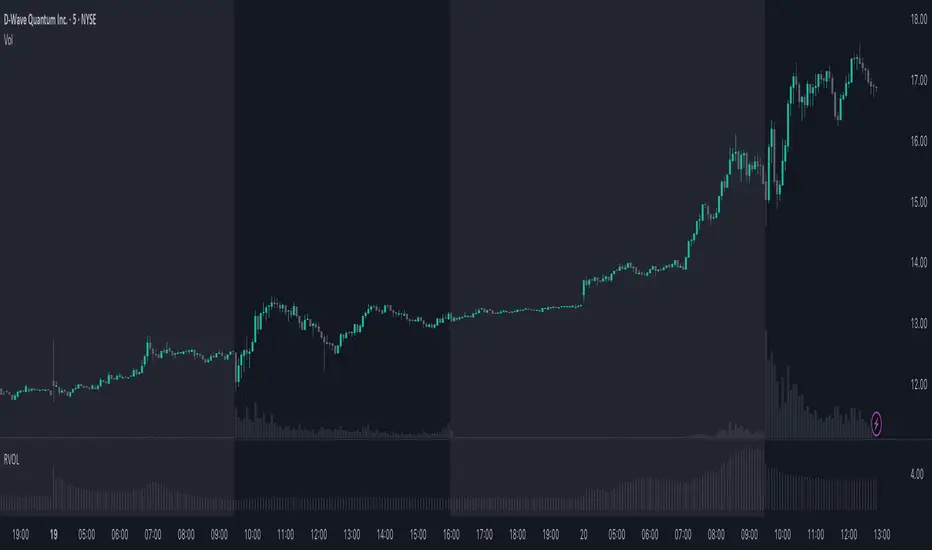
RVOL - Relative Volume IntradayIn the context of intraday trading, RVOL stands for Relative Volume. It is a technical indicator that compares the current volume of a stock to its average volume over a specified period. A RVOL above 1 suggests higher than average trading volume, potentially indicating increased interest and volatility.
The precise definition of real time relative volume is current cumulative volume up to the time of day divided by average cumulative volume up to this time of day. It means for example taking the volume from 09:45 to 10:00 and comparing it to what it does from 09:45 to 10:00 every day.
This indicator supports all timeframes from1 minute to 4 hours.
ORB-HL1. Opening Range Detection
Automatically calculates the high and low of the first 15 minutes after the selected session opens.
Supported sessions:
New York (Futures): 08:30–08:45 EST
New York (Equities): 09:30–09:45 EST
London: 03:00–03:15 GMT
Asia: 19:00–19:15 JST
Plots ORB high/low lines for the rest of the day.
2. Breakout Signals
Highlights the first valid breakout above or below the ORB range on the:
5-minute timeframe
15-minute timeframe
Green arrows = breakout up (long)
Red arrows = breakout down (short)
3. 1-Minute Projection
When a breakout is confirmed on a higher timeframe (5m or 15m), a projection label (e.g., "5m", "15m") appears on the 1-minute chart.
Purple label = 5m breakout
Teal label = 15m breakout
Helps you confirm momentum in real time while on the 1-minute chart.
4. Trailing Stop System
Uses ATR to create an adaptive trailing stop after breakout.
Turns green when price is above stop (bullish), red when below (bearish).
Optional Buy / Sell signal labels appear on crossover events.
5. Session High/Low Visualization
Tracks and displays the previous session’s High and Low for:
Tokyo
London
New York
Lines extend into the current session to act as S/R reference.
Labels like "NY High", "Asia Low" are placed at the end of each line.
6. Alerts
Built-in alerts for:
First 5m or 15m breakout (long/short)
Trailing stop Buy/Sell crossover
7. Customization Options
Turn session H/L lines on/off per session
Customize projection visibility
Adjust ATR period and sensitivity
Set how far each session line extends using bar offsets

LANZ Strategy 2.0🔷 LANZ Strategy 2.0 — London Breakout Confirmation with Structural Swing Protection
LANZ Strategy 2.0 is a structured trading system that leverages the last confirmed market direction before the London session to define directional bias and manage trades based on key structural swing levels. It is tailored for intraday traders looking to capitalize on early London volatility with built-in risk management and visual clarity.
🧠 Core Components:
Directional Confirmation (Pre-London Bias): Validates the last breakout or structural move from the 15-minute timeframe before 02:15 a.m. New York time (start of the London session), establishing the expected market direction.
Time-Based Execution: Executes potential entries strictly at 02:15 a.m. NY time, using market structure to support Long or Short bias.
Dynamic Swing-Based SL System: Allows user to select between three SL protection models: First Swing (most recent structural point) Second Swing (prior level) Total Coverage (includes both swings + extra buffer) This supports flexibility based on trader profile or market conditions.
Visual Risk Mapping: All SL and TP levels are clearly plotted.
End-of-Session Management: Positions are automatically evaluated for closure at 11:45 a.m. NY time. SL, TP, or manual close outcomes are labeled accordingly.
📊 Visual Features:
Labels for 1st and 2nd swing levels upon entry.
Dynamic lines projecting SL/TP levels toward the end of the session.
Session background coloring for Pre-London, Execution, and NY sessions.
Real-time percentage outcome labels (+2.00%, -1.00%, or net % at session end).
Automatic deletion of previous visuals on new entries for clean charting.
⚙️ How It Works:
Detects last structural breakout on the 15m timeframe before 02:15 a.m. NY.
On the 02:15 a.m. candle, executes a Long or Short logic entry.
Plots corresponding SL and TP based on selected swing model.
Monitors price action: If TP or SL is hit, labels it accordingly. If no exit is hit, trade closes manually at 11:45 a.m. NY with net result shown.
Optional logic to reverse entries if market structure breaks before execution.
🔔 Alerts:
Daily execution alert at 02:15 a.m. NY (prompting manual review or action).
Optional alert logic can be extended for SL/TP hits or structure breaks.
📝 Notes:
Designed for semi-automated or discretionary intraday trading.
Best used on Forex pairs or indices with strong London session behavior.
Adjustable parameters include session hours, swing SL type, and buffer settings.
Credits:
Developed by LANZ, this script combines time-based execution with dynamic structure protection, offering a disciplined framework for participating in the London session breakout with clear visuals and risk logic.

ICT Macro and Daye QT ShiftEST Vertical Lines - Auto DST Adjustment
Overview
This indicator draws customizable vertical lines at specific Eastern Time (EST/EDT) points throughout the trading day, automatically adjusting for daylight savings time. Designed for precision trading on 1-minute and 5-minute charts, it highlights key intraday moments when price action tends to accelerate.
Features
- **18 pre-configured NY session times** (09:50-15:45 ET)
- **Auto timezone conversion** - Always shows correct EST/EDT regardless of your local timezone
- **3 line styles** - Choose between solid/dashed/dotted lines
- **Clean labeling** - Optional time markers above each line
- **1m/5m optimized** - Perfect for scalpers and day traders
- **Visual alerts** - "TOUCH" labels when price interacts with lines
Inputs
| Parameter | Description | Default |
|-----------|-------------|---------|
| Line Times | Comma-separated HH:MM times | 09:50,10:10,...15:45 |
| Line Color | Line color | Black |
| Line Width | 1-5px thickness | 2 |
| Line Style | Solid/Dashed/Dotted | Solid |
| Show Labels | Display time markers | true |
How To Use
1. Apply to 1m or 5m charts
2. Lines appear automatically at specified EST times
3. Watch for price reactions at these key levels
4. Customize styles via indicator settings
Ideal For
- NY open/London close traders
- Earnings/News traders
- Breakout traders
- Market open/close strategies
Updates
v1.1 - Added line style customization
v1.0 - Initial release

DEMA Trend Oscillator Strategy📌 Overview
The DEMA Trend Oscillator Strategy is a dynamic trend-following approach based on the Normalized DEMA Oscillator SD.
It adapts in real-time to market volatility with the goal of improving entry accuracy and optimizing risk management.
⚠️ This strategy is provided for educational and research purposes only.
Past performance does not guarantee future results.
🎯 Strategy Objectives
The main goal of this strategy is to respond quickly to sudden price movements and trend reversals,
by combining momentum-based signals with volatility filters.
It is designed to be user-friendly for traders of all experience levels.
✨ Key Features
Normalized DEMA Oscillator: A momentum indicator that normalizes DEMA values on a 0–100 scale, allowing intuitive identification of trend strength
Two-Bar Confirmation Filter: Requires two consecutive bullish or bearish candles to reduce noise and enhance entry reliability
ATR x2 Trailing Stop: In addition to fixed stop-loss levels, a trailing stop based on 2× ATR is used to maximize profits during strong trends
📊 Trading Rules
Long Entry:
Normalized DEMA > 55 (strong upward momentum)
Candle low is above the upper SD band
Two consecutive bullish candles appear
Short Entry:
Normalized DEMA < 45 (downward momentum)
Candle high is below the lower SD band
Two consecutive bearish candles appear
Exit Conditions:
Take-profit at a risk-reward ratio of 1.5
Stop-loss triggered if price breaks below (long) or above (short) the SD band
Trailing stop activated based on 2× ATR to secure and extend profits
💰 Risk Management Parameters
Symbol & Timeframe: Any (AUDUSD 5M example)
Account size (virtual): $3000
Commission: 0.4PIPS(0.0004)
Slippage: 2 pips
Risk per trade: 5%
Number of trades (backtest):534
All parameters can be adjusted based on broker specifications and individual trading profiles.
⚙️ Trading Parameters & Considerations
Indicator: Normalized DEMA Oscillator SD
Parameter settings:
DEMA Period (len_dema): 40
Base Length: 20
Long Threshold: 55
Short Threshold: 45
Risk-Reward Ratio: 1.5
ATR Multiplier for Trailing Stop: 2.0
🖼 Visual Support
The chart displays the following visual elements:
Upper and lower SD bands (±2 standard deviations)
Entry signals shown as directional arrows
🔧 Strategy Improvements & Uniqueness
This strategy is inspired by “Normalized DEMA Oscillator SD” by QuantEdgeB,
but introduces enhancements such as a two-bar confirmation filter and an ATR-based trailing stop.
Compared to conventional trend-following strategies, it offers superior noise filtering and profit optimization.
✅ Summary
The DEMA Trend Oscillator Strategy is a responsive and practical trend-following method
that combines momentum detection with adaptive risk management.
Its visual clarity and logical structure make it a powerful and repeatable tool
for traders seeking consistent performance in trending markets.
⚠️ Always apply appropriate risk management. This strategy is based on historical data and does not guarantee future results.

[blackcat] L3 Ehlers DFT-Adapted RSIOVERVIEW
The L3 Ehlers DFT-Adapted RSI is an advanced technical indicator that combines Digital Fourier Transform (DFT) analysis with traditional RSI calculations to provide enhanced market trend identification and trading signals.
FEATURES
• DFT-based frequency analysis of price movements
• Adaptive RSI calculation using dominant cycle detection
• Fast and slow moving average lines
• Color-coded candlestick visualization
• Horizontal reference lines at 45 and 55
• Intelligent sideways detection and label management
• Customizable parameter inputs
HOW TO USE
Configure the following inputs:
• Price source (default: HL2)
• Window size (default: 50)
• Overbought threshold (default: 70)
• Oversold threshold (default: 30)
• Fraction multiplier (default: 0.5)
Interpret the indicator:
• Yellow candles indicate bullish momentum
• Fuchsia candles indicate bearish momentum
• Crosses between fast and slow lines suggest potential trend changes
• Position relative to the 45/55 lines indicates overall market sentiment
• Labels appear only when sideways conditions break
SIDESWAYS DETECTION
• Sideways conditions are identified when:
The difference between fast and slow lines is less than 0.5
Both lines show minimal movement (< 0.1) • During sideways periods:
Existing labels are removed
No new labels are generated • When sideways ends:
If trend reverses, opposite label is generated
If trend continues, no new label is created
LIMITATIONS
• Requires sufficient historical data for accurate calculations
• Performance may vary across different market conditions
• Parameter sensitivity requires careful calibration
NOTES
• The indicator uses Ehlers' proprietary DFT methodology
• Default settings are optimized for general market conditions
• Consider adjusting parameters based on your trading timeframe and strategy

RSI + MA + Divergence + SnR + Price levelOverview
This indicator combines several technical analysis tools to give traders a comprehensive view based on the RSI indicator. Its main features include:
RSI & Moving Averages on RSI:
RSI: Calculates the RSI based on the closing price (or a user-selected source) with a configurable period (default is 14).
EMA and WMA: Computes and plots an Exponential Moving Average (EMA with a period of 9) and a Weighted Moving Average (WMA with a period of 45) on the RSI, helping to smooth out signals and better identify trends.
Price Ladder Based on RSI:
Draws horizontal lines at specified target RSI levels (from targetRSI1 to targetRSI7, default levels ranging from 20 to 80).
Calculates a target price based on the price change relative to the averaged gains and losses, providing an estimated price level when the RSI reaches those critical levels.
Divergence Detection:
Identifies divergence between price and RSI:
Bullish Divergence: Detected when the price forms a lower low but RSI fails to confirm with a corresponding lower low, with the RSI falling under a configurable threshold (d_below).
Bearish Divergence: Detected when the price forms a higher high while the RSI does not, with the RSI exceeding a configurable upper threshold (d_upper).
Optionally displays labels on the chart to alert the trader when divergence signals are detected.
Auto Support & Resistance on RSI:
Automatically calculates and plots support and resistance lines based on the RSI over different lookback periods (e.g., 34, 89, 200 bars).
Helps traders identify key RSI levels where price reversals or breakouts might occur.
Benefits for the Trader
This indicator is designed to assist traders in their decision-making process by integrating multiple technical analysis elements:
Identifying Market Trends:
By combining the RSI with its moving averages (EMA, WMA), traders can better assess market trends and the strength of these trends, thereby improving trade entry accuracy.
Early Reversal Signals via Divergence:
Divergence signals (both bullish and bearish) can help forecast potential reversals in the market, allowing traders to adjust their strategies timely.
Determining RSI-Based Support/Resistance Levels:
Automatic identification of support and resistance levels on the RSI provides key areas where a price reversal or breakout may occur, assisting traders in setting stop-loss and take-profit levels strategically.
Price Target Forecasting with the Price Ladder:
The target price labels calculated at important RSI levels provide insights into potential price objectives, aiding in risk management and profit planning.
Flexible Configuration:
Traders can customize key parameters such as the RSI period, lengths for EMA and WMA, target RSI levels, divergence conditions, and support/resistance settings. This flexibility allows the indicator to adapt to different trading styles and strategies.
How to read data
Some use-cases
Used to estimate price according to the RSI level.
When you trade using RSI, you want to set your stop-loss or take-profit levels based on RSI. By looking at the price ladder, you know the corresponding price level to enter a trade.
Used to determine the entry zone.
RSI often reacts to its own previously established support/resistance levels. Use the Auto SnR feature to identify those zones.
Used to determine the trend.
RSI and its moving averages help identify the price trend:
Uptrend: 3 lines separate and point upward.
Downtrend: 3 lines separate and point downward.
Use WMA45 to determine the trend:
Uptrend: WMA45 is moving upward or trading above the 50 level.
Downtrend: WMA45 is moving downward or trading below the 50 level.
Sideways: WMA45 is trading around the 50 level.
Use EMA9 to confirm the trend: A crossover of EMA9 through WMA45 confirms the formation of a new trend.
Configuration
The script allows users to configure a number of important parameters to suit their analytical preferences:
RSI Settings:
RSI Length (rsiLengthInput): The number of periods used to compute the RSI (default is 14, adjustable as needed).
RSI Source (rsiSourceInput): Select the price source (default is the closing price).
RSI Color (rsiClr): The color used to display the RSI line.
Moving Averages on RSI:
EMA Length (emaLength): The period for calculating the EMA on RSI (default is 9).
WMA Length (wmaLength): The period for calculating the WMA on RSI (default is 45).
EMA Color (emaClr) and WMA Color (wmaClr): Customize the colors of the EMA and WMA lines.
Price Ladder Settings:
Toggle Price Ladder (showPrice): Enable or disable the display of the price ladder.
Target RSI Levels: targetRSI1 through targetRSI7: RSI values at which target prices are calculated (default values range from 20, 30, 40, 50, 60, 70 to 80).
Price Label Color (priceColor): The text color for displaying the target price labels.
Divergence Settings:
Divergence Toggle (calculateDivergence): Option to enable or disable divergence calculation and display.
Divergence Conditions:
d_below: RSI level below which bullish divergence is considered.
d_upper: RSI level above which bearish divergence is considered.
Display Divergence Labels (showDivergenceLabel): Option to display labels on the chart when divergence is detected.
Auto Support & Resistance on RSI:
Toggle Auto S&R (enableAutoSnR): Enable or disable automatic plotting of support and resistance levels.
Lookback Periods for Support/Resistance:
L1_lookback: Lookback period for level 1 (e.g., 34 bars).
L2_lookback: Lookback period for level 2 (e.g., 89 bars).
L3_lookback: Lookback period for level 3 (e.g., 200 bars).
Support and Resistance Colors:
rsiSupportClr: Color for the support line.
rsiResistanceClr: Color for the resistance line.
Alerts:
Divergence Alerts: Alert conditions are set up to notify the trader when bullish or bearish divergence is detected, aiding in timely decision-making.

Gold Opening 15-Min ORB INDICATOR by AdéThis indicator is designed for trading Gold (XAUUSD) during the first 15 minutes of major market openings: Asian, European, and US sessions. It highlights these key time windows, plots the high and low ranges of each session, and generates breakout-based buy/sell signals. Ideal for traders focusing on volatility at market opens.
Features:Session Windows:
Asian: 1:00–1:15 AM Barcelona time (23:00–23:15 UTC, CEST-adjusted).
European: 9:00–9:15 AM Barcelona time (07:00–07:15 UTC).
US: 3:30–3:45 PM Barcelona time (13:30–13:45 UTC).
Marked with yellow (Asian), green (Europe), and blue (US) triangles below bars.
High/Low Ranges:Plots horizontal lines showing the highest high and lowest low of each session’s first 15 minutes.Lines appear after each session ends and persist until the next day, color-coded to match the sessions.Breakout Signals:Buy (Long): Triggers when the closing price breaks above the highest high of the previous 5 bars during a session window (lime triangle above bar).Sell (Short): Triggers when the closing price breaks below the lowest low of the previous 5 bars during a session window (red triangle below bar).
Signals are restricted to the 15-minute session periods for focused trading.Usage:Timeframe: Optimized for 1-minute XAUUSD charts.Timezone: Set your chart to UTC for accurate session timing (script uses UTC internally, based on Barcelona CEST, UTC+2 in April).Strategy:
Use buy/sell signals for breakout trades during volatile market opens, with session ranges as support/resistance levels.Customization: Adjust the lookback variable (default: 5) to tweak signal sensitivity.Notes:Tested for April 2025 (CEST, UTC+2).
Adjust timestamp values if using outside daylight saving time (CET, UTC+1) or for different broker timezones.Best for scalping or short-term trades during high-volatility periods. Combine with other indicators for confirmation if desired.How to Use:Apply to a 1-minute XAUUSD chart.Watch for session markers (triangles) and breakout signals during the 15-minute windows.Use the high/low lines to gauge potential breakout targets or reversals.

Gann Percentage of High & Low Prices for Options - Keanu_RiTzThis Indicator is based on the text from Chapter 4 "Percentage of High & Low Prices" page number "30" from the book "WD Gann 45 years in Wall Street".
This Indicator is to be used on Intraday Timeframes and only on Options Charts (CALL & PUT) and not on any other chart.
The following is the text from that page :-
One of the greatest discoveries I ever made was how to figure the percentage of high and low prices on the averages and individual stocks.
The percentages of extreme high and low levels indicate future resistance levels.
There is a relation between every low price to some future high price and a percentage of the low price indicates what levels to expect the next high price.
At this price you can sell out long stocks and sell short with a limited risk.
The extreme high price or any minor tops are related to future bottoms er low levels.
The percentage of the high price tells where to expect low prices in the future and gives you resistance levels where you can buy with a limited risk.
The most important resistance level is 50% of any high or low price.
Second in importance is 100% on the lowest selling price on the averages or individual stocks.
You must also use 200%, 300%, 400%, 500%, 600% or more, depending upon the price and the Time Periods from High and Low.
Third in importance is 25% of the Lowest price or the Highest price.
Fourth in importance is 121/2% of the extreme Low or extreme High price.
Fifth in importance is 61/4% of the Highest price, but this is only to be used when the averages or individual stocks are selling at very high levels.
Sixth in importance is 33 1/3 and 66 2/3%. These percentages should be calculated and watched for resistance next after 25% and after 50%.
You should always have percentage tables made up on the Industrial Averages and on the individual stocks you trade in in order to know where these important resistance levels are located.
Description :
It plots the Intraday % levels from the highest high and lowest low of that day.
The calculation of these levels is based on the text from Chapter 4 "Percentage of High & Low Prices" page number "30" from the book "WD Gann 45 years in Wall Street".
I developed this indicator to see if those percentages work on Options prices or not,
and from my observation I found that it works wonderfully in Options as well.
These % levels work like magic and act as great Dynamic Support and Resistance levels.
Don't trust my words blindly and see for yourself.
This indicator is for educational and research purpose only.
It does not provide any BUY/SELL signals.

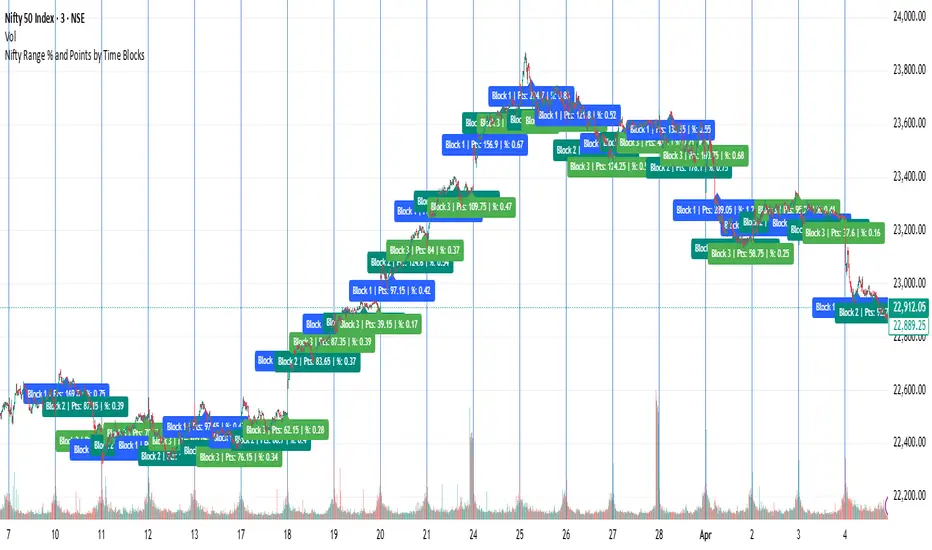
Nifty Range % and Points by Time BlocksPine Script that gives you day-wise intraday range percentage for these 3 time blocks (9:16–10:45, 10:45–1:15, 1:15–3:15), we can:
Detect time blocks during the day
Track High/Low for each block
Calculate range % for each block:
\text{Range %} = \frac{(High - Low)}{\text{Previous Day Close}} \times 100
Plot / Label it on the chart at the end of each block
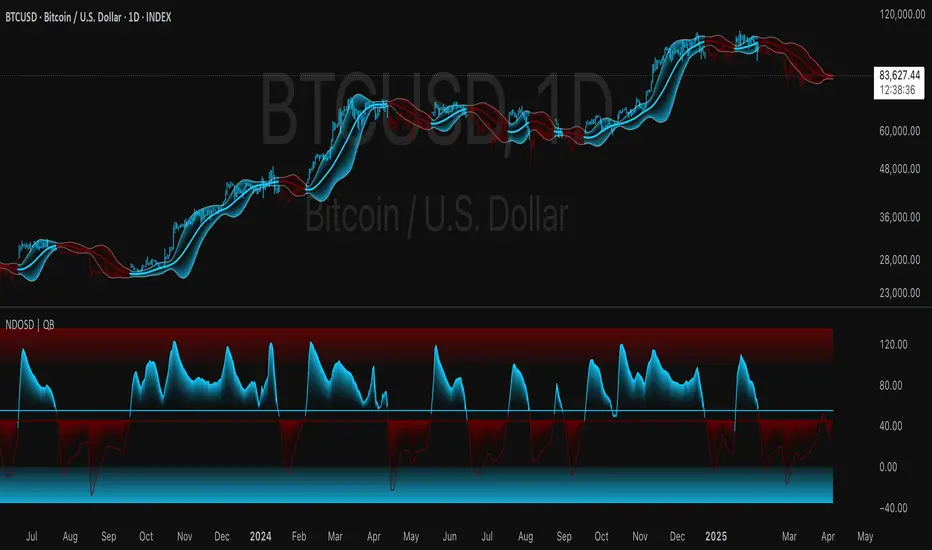
Normalized DEMA Oscillator SD| QuantEdgeB📊 Introducing Normalized DEMA Oscillator SD (NDOSD) by QuantEdgeB
🛠️ Overview
Normalized DEMA Oscillator SD (NDOSD) is a powerful trend and momentum indicator that blends DEMA-based smoothing with a standard deviation-based normalization engine. The result is an oscillator that adapts to volatility, filters noise, and highlights both trend continuations and reversal zones with exceptional clarity.
It normalizes price momentum within an adaptive SD envelope, allowing comparisons across assets and market conditions. Whether you're a trend trader or mean-reverter, NDOSD provides the insight needed for smarter decision-making.
✨ Key Features
🔹 DEMA-Powered Momentum Core
Utilizes a Double EMA (DEMA) for smoother trend detection with reduced lag.
🔹 Normalized SD Bands
Price momentum is standardized using a dynamic 2× standard deviation range—enabling consistent interpretation across assets and timeframes.
🔹 Overbought/Oversold Detection
Includes clear OB/OS zones with shaded thresholds to identify potential reversals or trend exhaustion areas.
🔹 Visual Trend Feedback
Color-coded oscillator zones, candle coloring, and optional signal labels help traders immediately see trend direction and strength.
📐 How It Works
1️⃣ DEMA Calculation
The core of NDOSD is a smoothed price line using a Double EMA, designed to reduce false signals in choppy markets.
2️⃣ Normalization with SD
The DEMA is normalized within a volatility range using a 2x SD calculation, producing a bounded oscillator from 0–100. This transforms the raw signal into a structured format, allowing for OB/OS detection and trend entry clarity.
3️⃣ Signal Generation
• ✅ Long Signal → Oscillator crosses above the long threshold (default: 55) and price holds above the lower SD boundary.
• ❌ Short Signal → Oscillator drops below short threshold (default: 45), often within upper SD boundary context.
4️⃣ OB/OS Thresholds
• Overbought Zone: Above 100 → Caution / Consider profit-taking.
• Oversold Zone: Below 0 → Watch for accumulation setups.
⚙️ Custom Settings
• Calculation Source: Default = close
• DEMA Period: Default = 30
• Base SMA Period: Default = 20
• Long Threshold: Default = 55
• Short Threshold: Default = 45
• Color Mode: Choose from Strategy, Solar, Warm, Cool, Classic, or Magic
• Signal Labels Toggle: Show/hide Long/Short markers on chart
👥 Ideal For
✅ Trend Followers – Identify breakout continuation zones using oscillator thrust and SD structure
✅ Swing Traders – Catch mid-trend entries or mean reversion setups at OB/OS extremes
✅ Quant/Systemic Traders – Normalize signals for algorithmic integration across assets
✅ Multi-Timeframe Analysts – Easily compare trend health using standardized oscillator ranges
📌 Conclusion
Normalized DEMA Oscillator SD is a sleek and adaptive momentum toolkit that helps traders distinguish true momentum from false noise. With its fusion of DEMA smoothing and SD normalization, it works equally well in trending and range-bound conditions.
🔹 Key Takeaways:
1️⃣ Smoother momentum tracking using DEMA
2️⃣ Cross-asset consistency via SD-based normalization
3️⃣ Versatile for both trend confirmation and reversal identification
📌 Disclaimer: Past performance is not indicative of future results. No trading strategy can guarantee success in financial markets.
📌 Strategic Advice: Always backtest, optimize, and align parameters with your trading objectives and risk tolerance before live trading.
Let me know if you want a strategy script or publish-ready layout for TradingView next!
Median RSI SD| QuantEdgeB📈 Introducing Median RSI SD by QuantEdgeB
🛠️ Overview
Median RSI SD is a hybrid momentum tool that fuses two powerful techniques: Median Price Filtering and RSI-based Momentum. The result? A cleaner, more responsive oscillator designed to reduce noise and increase clarity in trend detection and potential reversals.
By applying the RSI not to raw price but to the percentile-based median, the indicator adapts better to real structural shifts in the market while filtering out temporary price spikes.
✨ Key Features
🔹 Smoothed RSI Momentum
Utilizes a percentile-based median as input to RSI, reducing volatility and enhancing signal reliability.
🔹 Volatility-Weighted SD Zones
Automatically detects overbought/oversold extremes using ±1 standard deviation bands on the median, adapting to current market volatility.
🔹 Trend Signal Overlay
A directional trend signal (Long / Short / Neutral) is derived from the RSI crossing custom thresholds, combined with position relative to SD bands.
🔹 Visual Labeling System
Optional in-chart labels for Long / Short signals and fully color-customizable theme modes.
📊 How It Works
1️⃣ Median RSI Calculation
Instead of using the close price directly, the script first computes a smoothed median via percentile ranking. RSI is then applied to this filtered stream, improving reactivity without overfitting to short-term noise.
2️⃣ Standard Deviation Filtering
Upper and lower SD bands are calculated around the median to identify extreme conditions. A position near the upper SD while RSI is below the short threshold triggers bearish bias. The reverse applies for longs.
3️⃣ Signal Generation
• ✅ Long Signal → RSI crosses above the Long Threshold (default: 65) and price holds above lower SD.
• ❌ Short Signal → RSI crosses below the Short Threshold (default: 45), typically within upper SD range.
4️⃣ Contextual Highlighting
Zone fills on the chart and RSI subgraph indicate Overbought (>75) and Oversold (<25) conditions for added clarity.
⚙️ Custom Settings
• RSI Length → Default: 21
• Median Length → Default: 10
• Long Threshold → Default: 65
• Short Threshold → Default: 45
• Color Mode → Choose from Strategy, Solar, Warm, Cool, Classic, Magic
• Signal Labels Toggle → Optional in-chart long/short labels
👥 Who Should Use It?
✅ Swing & Momentum Traders → Filter entries based on confirmed directional RSI setups.
✅ Range-Bound Traders → Use SD thresholds to spot fakeouts or exhaustion zones.
✅ Intraday Strategists → Enhanced signal clarity makes it usable even on lower timeframes.
✅ System Builders → Combine this signal with price action or confluence layers for smarter rules.
📌 Conclusion
Median RSI SD by QuantEdgeB is more than just a modified oscillator—it's a robust momentum confirmation framework designed for modern volatility. By replacing noisy price feeds with a statistically stable input and layering RSI + SD logic, this tool provides high-clarity signals without sacrificing responsiveness.
🔹 Key Takeaways:
1️⃣ Median-filtered RSI eliminates noise without lag
2️⃣ Standard deviation bands identify exhaustion zones
3️⃣ Reliable for both trend continuation and mean-reversion strategies
📌 Disclaimer: Past performance is not indicative of future results. No trading strategy can guarantee success in financial markets.
📌 Strategic Advice: Always backtest, optimize, and align parameters with your trading objectives and risk tolerance before live trading.

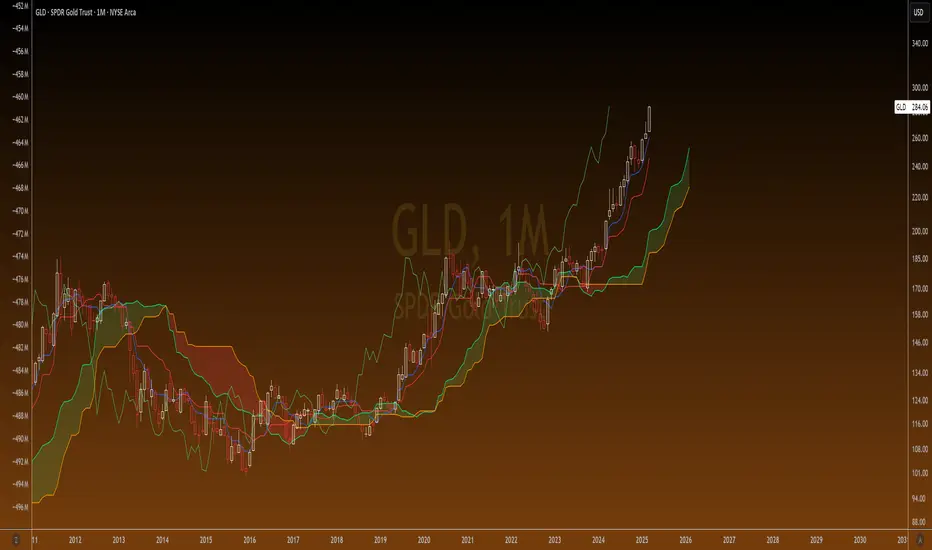
Ichimoku Cloud Auto TF🧠 Timeframe Breakdown for Ichimoku Cloud Auto TF
Each timeframe in this indicator is carefully calibrated to reflect meaningful Ichimoku behavior relative to its scale. Here's how each one is structured and what it's best used for:
⏱️ 1 Minute (1m)
Tenkan / Kijun / Span B: 5 / 15 / 45
Use: Scalping fast price action.
Logic: Quick reaction to short-term momentum. Best for highly active traders or bots.
⏱️ 2 Minutes (2m)
Tenkan / Kijun / Span B: 6 / 18 / 54
Use: Slightly smoother than 1m, still ideal for scalping with a little more stability.
⏱️ 5 Minutes (5m)
Tenkan / Kijun / Span B: 8 / 24 / 72
Use: Intraday setups, quick trend capture.
Logic: Balanced between reactivity and noise reduction.
⏱️ 15 Minutes (15m)
Tenkan / Kijun / Span B: 9 / 27 / 81
Use: Short-term swing and intraday entries with higher reliability.
⏱️ 30 Minutes (30m)
Tenkan / Kijun / Span B: 10 / 30 / 90
Use: Intra-swing entries or confirmation of 5m/15m signals.
🕐 1 Hour (1H)
Tenkan / Kijun / Span B: 12 / 36 / 108
Use: Ideal for swing trading setups.
Logic: Anchored to Daily reference (1H × 24 ≈ 1D).
🕐 2 Hours (2H)
Tenkan / Kijun / Span B: 14 / 42 / 126
Use: High-precision swing setups with better context.
🕒 3 Hours (3H)
Tenkan / Kijun / Span B: 15 / 45 / 135
Use: Great compromise between short and mid-term vision.
🕓 4 Hours (4H)
Tenkan / Kijun / Span B: 18 / 52 / 156
Use: Position traders & intraday swing confirmation.
Logic: Designed to echo the structure of 1D Ichimoku but on smaller scale.
📅 1 Day (1D)
Tenkan / Kijun / Span B: 9 / 26 / 52
Use: Classic Ichimoku settings.
Logic: Standard used globally for technical analysis. Suitable for swing and position trading.
📆 1 Week (1W)
Tenkan / Kijun / Span B: 12 / 24 / 120
Use: Long-term position trading & institutional swing confirmation.
Logic: Expanded ratios for broader perspective and noise filtering.
🗓️ 1 Month (1M)
Tenkan / Kijun / Span B: 6 / 12 / 24
Use: Macro-level trend visualization and investment planning.
Logic: Condensed but stable structure to handle longer data cycles.
📌 Summary
This indicator adapts Ichimoku settings dynamically to your chart's timeframe, maintaining logical ratios between Tenkan, Kijun, and Span B. This ensures each timeframe remains responsive yet meaningful for its respective market context.
Opening Range BreakoutThis is an Opening Range Breakout script. It will plot the opening range high and low (green and red lines, respectively) as determined by the user input (default is a 15 min window from market open, 9:30 - 9:45 am). The time period for the breakout is also configured by a user input (default is from 9:45 am - 2:30 pm).
Alerts are sent for breakouts either above (bullish) or below (bearish) the opening range high and low. An EMA is also used for trend confirmation before sending alerts for breakouts (to avoid false signals).
A bullish breakout is determined by all of the following being true:
- The current price being above the opening range high (green line)
- The EMA trending up (ie the current value of the EMA > prior EMA value)
- The current price is > the EMA
- The EMA is > the opening range high
A bearish breakout is determined by all of the following being true:
- The current price being below the opening range low (red line)
- The EMA trending down (ie the current value of the EMA < prior EMA value)
- The current price is < the EMA
- the EMA is < the opening range low
Enjoy this simple indicator!

ICT Killzones + Macros [TakingProphets]The ICT Killzones indicator is a powerful tool designed to visualize key trading sessions and market timing elements used in ICT (Inner Circle Trader) methodology. It includes:
• Session Markers:
- Asia Session
- London Session
- NY AM Session
- NY Lunch Session
- NY PM Session
• Key Price Levels:
- Session high/low levels that extend until violated
- Midnight Open price level (dotted line)
- True Day Open price level (6 PM EST, dotted line)
• ICT Macro Timing:
- First Macro: 9:45 AM - 10:15 AM EST
- Second Macro: 10:45 AM - 11:15 AM EST
- Distinctive L-shaped brackets marking start and end times
Features:
• Fully customizable colors and styles for all elements
• Adjustable label positions and sizes
• Toggle options for each component
• Smart timeframe filtering
• Clean, uncluttered visual design
This indicator helps traders identify key market structure points, session transitions, and optimal trading windows based on ICT concepts.

Timeframe-Based Dynamic MA [odnac]
This code is a Timeframe-Based Dynamic MA indicator, written in Pine Script, that dynamically calculates and displays the Simple Moving Average (SMA), Exponential Moving Average (EMA), and Volume Weighted Moving Average (VWMA) based on a 24-hour period, according to the selected timeframe. It automatically adjusts the length of the moving averages for each timeframe, showing the appropriate value optimized for that specific timeframe.
Code Explanation:
Settings:
inputLength: A user input that allows setting the base time (24 hours by default). This value determines the reference for calculating the length of the moving averages according to the timeframe.
transp: A setting for the transparency of the moving average lines. It can accept values from 0 to 100 (0 is opaque, 100 is fully transparent).
Timeframe-Based Moving Average Calculation:
The length variable is dynamically calculated based on the current chart's timeframe.
For shorter timeframes like 1-minute, 2-minute, 3-minute, 5-minute, 10-minute, 15-minute, 30-minute, and 45-minute, the length is calculated by multiplying 60 / selected timeframe to obtain the moving average length based on a 24-hour period.
For longer timeframes like 1 hour, 4 hours, and 1 day, fixed values are used to set the moving average length.
Moving Average Calculation:
sma, ema, vwma: These are the Simple Moving Average, Exponential Moving Average, and Volume Weighted Moving Average calculated based on the length.
else_sma, else_ema, else_vwma: These represent the moving averages fetched from the 1-hour chart. For timeframes that are not calculated directly, the values are taken from the 1-hour chart.
Displaying the Moving Averages:
The moving averages are plotted according to the length calculated for the current timeframe.
If the length for the current timeframe is valid, the corresponding SMA, EMA, and VWMA values are displayed. Otherwise, the values fetched from the 1-hour chart are used.
The moving averages are displayed with the transparency (transp) value set by the user, controlling their opacity on the chart.
How to Use:
Base Time: The user sets a base time. For example, setting inputLength to 24 will calculate the moving average length based on a 24-hour period, which will be dynamically adjusted and displayed according to the selected timeframe.
Transparency Setting: The transparency of the moving average lines can be adjusted using the transp value.
Supported Timeframes:
For shorter timeframes (1-minute, 2-minute, 3-minute, 5-minute, 10-minute, 15-minute, 30-minute, 45-minute), the moving average lengths are dynamically calculated and displayed.
For longer timeframes (1 hour, 4 hours, 1 day), fixed length values are used.
This indicator allows you to dynamically calculate daily moving averages across different timeframes and visually check which moving average is the most appropriate for the selected timeframe.

Detecting Sideways Market or Strong Trends| Copy Trade Tungdubai**Tool Description**:
The **"Detecting Sideways Market or Strong Trends | Copy Trade Tungdubai"** tool is designed to help traders identify two key market conditions:
1. **Sideways Market**:
- This condition is detected when the ADX is below 20, the price stays within the Bollinger Bands, and the RSI is between 45 and 55.
- When the market is sideways, the chart background will turn yellow as a visual alert.
2. **Strong Trend Market**:
- This condition is identified when the ADX is above 25, and either the price breaks out of the Bollinger Bands or the RSI surpasses the overbought (70) or oversold (30) levels.
- When the market is in a strong trend, the chart background will turn blue as a visual alert.
**Key Components of the Tool**:
- **ADX**: Measures the strength of the market trend, with key thresholds at 20 and 25.
- **Bollinger Bands**: Helps determine volatility and checks if the price is within or outside the bands.
- **RSI**: Measures momentum, helping identify overbought and oversold levels.
**Visual Features on the Chart**:
- ADX, RSI, and Bollinger Bands are clearly plotted with their respective key thresholds for easier recognition of market conditions.
- The chart background changes color to reflect the current market condition (yellow for sideways, blue for strong trends).
**Alerts**:
- Alerts are triggered when the market enters either a sideways or strong trend phase, providing notifications to help users act promptly.
This tool serves as a practical aid in recognizing market conditions, allowing traders to make informed decisions aligned with their strategies.
**Mô tả công cụ**:
Công cụ **"Detecting Sideways Market or Strong Trends | Copy Trade Tungdubai"** được thiết kế để giúp các nhà giao dịch xác định hai trạng thái chính của thị trường:
1. **Thị trường đi ngang (Sideways)**:
- Điều kiện được xác định dựa trên chỉ số ADX thấp hơn ngưỡng 20, giá nằm trong dải Bollinger Bands, và chỉ số RSI dao động trong khoảng từ 45 đến 55.
- Khi thị trường đi ngang, nền của biểu đồ sẽ chuyển sang màu vàng để cảnh báo trực quan.
2. **Thị trường bùng nổ sóng mạnh (Strong Trend)**:
- Điều kiện được xác định khi ADX vượt qua ngưỡng 25 và giá phá vỡ dải Bollinger Bands (hoặc) chỉ số RSI vượt ngưỡng quá mua 70 hoặc quá bán 30.
- Khi thị trường bùng nổ sóng mạnh, nền biểu đồ sẽ chuyển sang màu xanh để cảnh báo trực quan.
**Các thành phần chính của công cụ**:
- **ADX**: Được sử dụng để đo sức mạnh xu hướng thị trường, với các ngưỡng quan trọng là 20 và 25.
- **Bollinger Bands**: Được sử dụng để xác định mức độ biến động và kiểm tra giá nằm trong hay ngoài dải.
- **RSI**: Dùng để đo mức độ quá mua/quá bán, xác định động lượng giá.
**Hiển thị trên biểu đồ**:
- Các đường ADX, RSI, và Bollinger Bands được vẽ rõ ràng, cùng với các ngưỡng quan trọng (hỗ trợ nhận biết trạng thái thị trường).
- Nền biểu đồ thay đổi màu sắc tương ứng với điều kiện thị trường.
**Cảnh báo**:
- Cảnh báo sẽ được kích hoạt khi thị trường rơi vào trạng thái đi ngang hoặc bùng nổ sóng mạnh, với các thông báo giúp người dùng hành động kịp thời.
Công cụ này là một trợ thủ hữu ích trong việc nhận biết trạng thái thị trường, từ đó giúp các nhà giao dịch đưa ra quyết định phù hợp với chiến lược của mình.
ICT Macro Sessions by @zeusbottradingICT Macro Sessions Indicator
The ICT Macro Sessions Indicator is a powerful tool designed for traders who follow the ICT (Inner Circle Trader) methodology and want to optimize their trading during specific high-probability time intervals. This indicator highlights all the key macro sessions throughout the trading day in the GMT+8 (Hong Kong) time zone.
What Does the Indicator Do?
This indicator visually marks ICT Macro Sessions on your trading chart using background colors and optional labels. Each session corresponds to specific time intervals when institutional activity is most likely to drive price action. By focusing on these periods, traders can align their strategies with market volatility and liquidity, increasing their chances of success.
Highlighted Sessions
The indicator covers all major ICT Macro Sessions, each with a unique color for easy identification:
London Macro 1 (15:33–16:00 GMT+8):
- Marks the early London session, often characterized by strong directional moves.
London Macro 2 (17:03–17:30 GMT+8):
- Captures the mid-London session, where price frequently reacts to liquidity levels.
New York AM Macro 1 (22:50–23:10 GMT+8):
- Highlights the start of the New York session, a prime time for price reversals or continuations.
New York AM Macro 2 (23:50–00:10 GMT+8):
- Focuses on late-morning New York activity, often aligning with key news releases.
New York Lunch Macro (00:50–01:10 GMT+8):
- Covers the lunch period in New York, where price may consolidate or set up for afternoon moves.
New York PM Macro 1 (02:10–02:40 GMT+8):
- Tracks post-lunch activity in New York, often featuring renewed volatility.
New York PM Macro 2 (04:15–04:45 GMT+8):
- Captures late-session moves as institutional traders finalize their positions.
Features of the Indicator
Fixed Time: The indicator is pre-configured for GMT+8 but it will adapt automatically to your timezone. No need to change anything in the code.
Background Highlighting: Each session is visually marked with a unique background color for quick recognition.
Optional Labels: Traders can enable or disable labels for each session, providing flexibility in how information is displayed.
Session Toggles: You can choose which sessions to display based on your trading preferences and strategy.
Intraday Timeframes: The indicator is optimized for intraday charts with timeframes of 45 minutes or less. You can change it to anything you like.
Why Use This Indicator?
The ICT Macro Sessions Indicator helps traders focus on the most critical times of the trading day when institutional activity is at its peak. These periods often coincide with significant price movements, making them ideal for scalping, day trading, or even swing trading setups. By visually highlighting these sessions, the indicator eliminates guesswork and allows traders to plan their trades with precision.

[ETH] Optimized Trend Strategy - Lorenzo SuperScalpStrategy Title: Optimized Trend Strategy - Lorenzo SuperScalp
Description:
The Optimized Trend Strategy is a comprehensive trading system tailored for Ethereum (ETH) and optimized for the 15-minute timeframe but adaptable to various timeframes. This strategy utilizes a combination of technical indicators—RSI, Bollinger Bands, and MACD—to identify and act on price trends efficiently, providing traders with actionable buy and sell signals based on market conditions.
Key Features:
Multi-Indicator Approach:
RSI (Relative Strength Index): Identifies overbought and oversold conditions to time market entries and exits.
Bollinger Bands: Acts as a dynamic support and resistance level, helping to pinpoint precise entry and exit zones.
MACD (Moving Average Convergence Divergence): Detects momentum changes through bullish and bearish crossovers.
Signal Conditions:
Buy Signal:
RSI is below 45 (indicating an oversold condition).
Price is near or below the lower Bollinger Band.
MACD bullish crossover occurs.
Sell Signal:
RSI is above 55 (indicating an overbought condition).
Price is near or above the upper Bollinger Band.
MACD bearish crossunder occurs.
Trade Execution Logic:
Long Trades: Opened when a buy signal flashes. If there’s an open short position, it is closed before opening a long.
Short Trades: Opened when a sell signal flashes. If there’s an open long position, it is closed before opening a short.
The strategy also ensures a minimum number of bars between consecutive trades to avoid rapid trading in choppy conditions.
Pyramiding Support:
Up to 3 consecutive trades in the same direction are allowed, enabling traders to scale into positions based on strong signals.
Visual Indicators:
RSI Levels: Dotted lines at 45 and 55 for quick reference to oversold and overbought levels.
Buy and Sell Signals: Visual markers on the chart indicate where trades are executed, ensuring clarity on entry and exit points.
Best Used For:
Swing Trading & Scalping: While optimized for the 15-minute timeframe, this strategy works across various timeframes, making it suitable for both short-term scalping and swing trading.
Crypto Trading: Tailored for Ethereum but effective for other cryptocurrencies due to its dynamic indicator setup.

Macros ICT KillZones [TradingFinder] Times & Price Trading Setup🔵 Introduction
ICT Macros, developed by Michael Huddleston, also known as ICT (Inner Circle Trader), is a powerful trading tool designed to help traders identify the best trading opportunities during key time intervals like the London and New York trading sessions.
For traders aiming to capitalize on market volatility, liquidity shifts, and Fair Value Gaps (FVG), understanding and using these critical time zones can significantly improve trading outcomes.
In today’s highly competitive financial markets, identifying the moments when the market is seeking buy-side or sell-side liquidity, or filling price imbalances, is essential for maximizing profitability.
The ICT Macros indicator is built on the renowned ICT time and price theory, which enables traders to track and leverage key market dynamics such as breaks of highs and lows, imbalances, and liquidity hunts.
This indicator automatically detects crucial market times and optimizes strategies for traders by highlighting the specific moments when price movements are most likely to occur. A standout feature of ICT Macros is its automatic adjustment for Daylight Saving Time (DST), ensuring that traders remain synced with the correct session times.
This means you can rely on accurate market timing without the need for manual updates, allowing you to focus on capturing profitable trades during critical timeframes.
🔵 How to Use
The ICT Macros indicator helps you capitalize on trading opportunities during key market moments, particularly when the market is breaking highs or lows, filling Fair Value Gaps (FVG), or addressing imbalances. This indicator is particularly beneficial for traders who seek to identify liquidity, market volatility, and price imbalances.
🟣 Sessions
London Sessions
London Macro 1 :
UTC Time : 06:33 to 07:00
New York Time : 02:33 to 03:00
London Macro 2 :
UTC Time : 08:03 to 08:30
New York Time : 04:03 to 04:30
New York Sessions
New York Macro AM 1 :
UTC Time : 12:50 to 13:10
New York Time : 08:50 to 09:10
New York Macro AM 2 :
UTC Time : 13:50 to 14:10
New York Time : 09:50 to 10:10
New York Macro AM 3 :
UTC Time : 14:50 to 15:10
New York Time : 10:50 to 11:10
New York Lunch Macro :
UTC Time : 15:50 to 16:10
New York Time : 11:50 to 12:10
New York PM Macro :
UTC Time : 17:10 to 17:40
New York Time : 13:10 to 13:40
New York Last Hour Macro :
UTC Time : 19:15 to 19:45
New York Time : 15:15 to 15:45
These time intervals adjust automatically based on Daylight Saving Time (DST), helping traders to enter or exit trades during key market moments when price volatility is high.
Below are the main applications of this tool and how to incorporate it into your trading strategies :
🟣 Combining ICT Macros with Trading Strategies
The ICT Macros indicator can easily be used in conjunction with various trading strategies. Two well-known strategies that can be combined with this indicator include:
ICT 2022 Trading Model : This model is designed based on identifying market liquidity, structural price changes, and Fair Value Gaps (FVG). By using ICT Macros, you can identify the key time intervals when the market is seeking liquidity, filling imbalances, or breaking through important highs and lows, allowing you to enter or exit trades at the right moment.
Silver Bullet Strategy : This strategy, which is built around liquidity hunting and rapid price movements, can work more accurately with the help of ICT Macros. The indicator pinpoints precise liquidity times, helping traders take advantage of market shifts caused by filling Fair Value Gaps or correcting imbalances.
🟣 Capitalizing on Price Volatility During Key Times
Large market algorithms often seek liquidity or fill Fair Value Gaps (FVG) during the intervals marked by ICT Macros. These periods are when price volatility increases, and traders can use these moments to enter or exit trades.
For example, if sell-side liquidity is drained and the market fills an imbalance, the price might move toward buy-side liquidity. By identifying these moments, which may also involve breaking a previous high or low, you can leverage rapid market fluctuations to your advantage.
🟣 Identifying Liquidity and Price Imbalances
One of the important uses of ICT Macros is identifying points where the market is seeking liquidity and correcting imbalances. You can determine high or low liquidity levels in the market before each ICT Macro, as well as Fair Value Gaps (FVG) and price imbalances that need to be filled, using them to adjust your trading strategy. This capability allows you to manage trades based on liquidity shifts or imbalance corrections without needing a bias toward a specific direction.
🔵 Settings
The ICT Macros indicator offers various customization options, allowing users to tailor it to their specific needs. Below are the main settings:
Time Zone Mode : You can select one of the following options to define how time is displayed:
UTC : For traders who need to work with Universal Time.
Session Local Time : The local time corresponding to the London or New York markets.
Your Time Zone : You can specify your own time zone (e.g., "UTC-4:00").
Your Time Zone : If you choose "Your Time Zone," you can set your specific time zone. By default, this is set to UTC-4:00.
Show Range Time : This option allows you to display the time range of each session on the chart. If enabled, the exact start and end times of each interval are shown.
Show or Hide Time Ranges : Toggle on/off for visual clarity depending on user preference.
Custom Colors : Set distinct colors for each session, allowing users to personalize their chart based on their trading style.These settings allow you to adjust the key time intervals of each trading session to your preference and customize the time format according to your own needs.
🔵 Conclusion
The ICT Macros indicator is a powerful tool for traders, helping them to identify key time intervals where the market seeks liquidity or fills Fair Value Gaps (FVG), corrects imbalances, and breaks highs or lows. This tool is especially valuable for traders using liquidity-based strategies such as ICT 2022 or Silver Bullet.
One of the key features of this indicator is its support for Daylight Saving Time (DST), ensuring you are always in sync with the correct trading session timings without manual adjustments. This is particularly beneficial for traders operating across different time zones.
With ICT Macros, you can capitalize on crucial market opportunities during sensitive times, take advantage of imbalances, and enhance your trading strategies based on market volatility, liquidity shifts, and Fair Value Gaps.

ICT Judas Swing | Flux Charts💎 GENERAL OVERVIEW
Introducing our new ICT Judas Swing Indicator! This indicator is built around the ICT's "Judas Swing" strategy. The strategy looks for a liquidity grab around NY 9:30 session and a Fair Value Gap for entry confirmation. For more information about the process, check the "HOW DOES IT WORK" section.
Features of the new ICT Judas Swing :
Implementation of ICT's Judas Swing Strategy
2 Different TP / SL Methods
Customizable Execution Settings
Customizable Backtesting Dashboard
Alerts for Buy, Sell, TP & SL Signals
📌 HOW DOES IT WORK ?
The strategy begins by identifying the New York session from 9:30 to 9:45 and marking recent liquidity zones. These liquidity zones are determined by locating high and low pivot points: buyside liquidity zones are identified using high pivots that haven't been invalidated, while sellside liquidity zones are found using low pivots. A break of either buyside or sellside liquidity must occur during the 9:30-9:45 session, which is interpreted as a liquidity grab by smart money. The strategy assumes that after this liquidity grab, the price will reverse and move in the opposite direction. For entry confirmation, a fair value gap (FVG) in the opposite direction of the liquidity grab is required. A buyside liquidity grab calls for a bearish FVG, while a sellside grab requires a bullish FVG. Based on the type of FVG—bullish for buys and bearish for sells—the indicator will then generate a Buy or Sell signal.
After the Buy or Sell signal, the indicator immediately draws the take-profit (TP) and stop-loss (SL) targets. The indicator has three different TP & SL modes, explained in the "Settings" section of this write-up.
You can set up alerts for entry and TP & SL signals, and also check the current performance of the indicator and adjust the settings accordingly to the current ticker using the backtesting dashboard.
🚩 UNIQUENESS
This indicator is an all-in-one suit for the ICT's Judas Swing concept. It's capable of plotting the strategy, giving signals, a backtesting dashboard and alerts feature. Different and customizable algorithm modes will help the trader fine-tune the indicator for the asset they are currently trading. Three different TP / SL modes are available to suit your needs. The backtesting dashboard allows you to see how your settings perform in the current ticker. You can also set up alerts to get informed when the strategy is executable for different tickers.
⚙️ SETTINGS
1. General Configuration
Swing Length -> The swing length for pivot detection. Higher settings will result in
FVG Detection Sensitivity -> You may select between Low, Normal, High or Extreme FVG detection sensitivity. This will essentially determine the size of the spotted FVGs, with lower sensitivies resulting in spotting bigger FVGs, and higher sensitivies resulting in spotting all sizes of FVGs.
2. TP / SL
TP / SL Method ->
a) Dynamic: The TP / SL zones will be auto-determined by the algorithm based on the Average True Range (ATR) of the current ticker.
b) Fixed : You can adjust the exact TP / SL ratios from the settings below.
Dynamic Risk -> The risk you're willing to take if "Dynamic" TP / SL Method is selected. Higher risk usually means a better winrate at the cost of losing more if the strategy fails. This setting is has a crucial effect on the performance of the indicator, as different tickers may have different volatility so the indicator may have increased performance when this setting is correctly adjusted.

Super RSI: Multi-Timeframe, Multi-RSI-MA, Multi Symbol [DucTri]█ Overview
RSI is a very popular indicator that almost every trader knows about. I created this indicator with the goal of helping you use RSI more conveniently and effectively.
█ Uses
Monitor the RSI of 10 currency pairs simultaneously.
The first column shows the RSI of the current currency pair.
RSI below 30 will have a Red background, and above 70 will have a Green background.
Display multiple RSI lines with different lengths (or timeframes).
Displays 3 RSI with 3 different lengths 7, 14 and 21
Displays two RSI lines with two different timeframes. The purple line shows RSI (14) for the 1H timeframe, and the blue line shows RSI (14) for the 4H timeframe.
Display MA and Bollinger Band lines for RSI.
Shows the RSI line along with two MA lines of the RSI: EMA (9) in blue and WMA (45) in red.
Identify RSI Divergence with custom settings
█ Input
- You can have up to three RSI lines, with customizable lengths and timeframes.
- You also have up to three RSI-MA lines, where you can customize the MA type and length.
- You can track RSI for up to 10 currency pairs at the same time.
- Additionally, you can change how the top (or bottom) is determined when identifying divergence.
█ Alerts
Send alerts when two RSI lines cross. For example, when the RSI 14 crosses above the RSI 21, or the RSI on the 1H timeframe crosses above the RSI on the 4H timeframe.*
Send alerts when RSI crosses above or below the RSI-MA line.
Send alerts when two RSI-MA lines cross. For example, when the RSI-EMA (9) crosses above the RSI-WMA (45).*
Send alerts when Divergence (Convergence) appears.
Send alerts when any currency pair in the monitored list shows an Overbought or Oversold signal.
