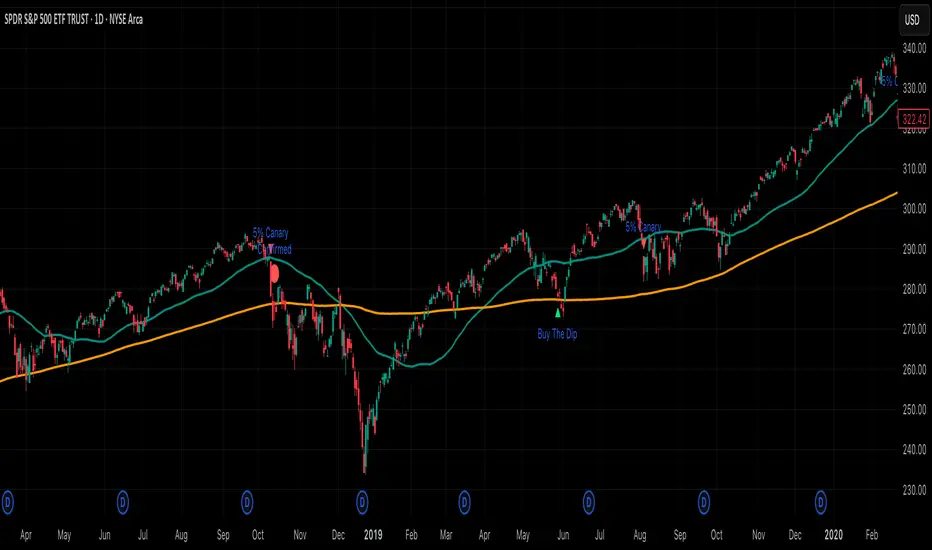
5% Canary (per Thrasher) Implements Thrasher’s framework using closing prices and simple, non-optimized thresholds. The study watches for the first 5% decline from the latest 52-week closing high and classifies it:
• 5% Canary: drop occurs in ≤ 15 trading days.
• Confirmed 5% Canary: within 42 trading days of a Canary, there are two consecutive closes below the 200-DMA.
• Buy-the-Dip: the first 5% decline takes > 15 days and 50-DMA > 200-DMA (uptrend).
Includes optional 50/200-DMA plots, clutter-reduction, and alert conditions. This is a signal framework, not a standalone system—pair with your own risk management.
Cari dalam skrip untuk "流通市值在50亿至200亿之间的股票中,成交量持续放大的个股有哪些?"
Common DMAs with LabelsHere's a short description for publishing:
Common Daily Moving Averages (DMA) Indicator with Smart Labels
Displays the most widely-used moving averages that professional traders watch: 5, 10, 20, 50, 100, and 200 DMAs with clear color-coding and descriptive labels.
Key Features:
Smart Labels - Each DMA shows its trading purpose (Day Trading, Swing Trading, Bull/Bear Line, etc.)
Customizable Display - Toggle any DMA on/off individually
Golden/Death Cross Alerts - Optional 50/200 crossover signals
Live Status Table - Shows current DMA values vs price with up/down arrows
Professional Styling - Color-coded lines with appropriate thickness (200 DMA emphasized)
Perfect for:
Multi-timeframe trend analysis
Support/resistance identification
Bull/bear market confirmation
Entry/exit timing
Usage: Add to chart, customize which DMAs to display in settings. Labels appear on the right showing each average's trading significance. Enable the status table for quick price-vs-DMA reference.
Ideal for both beginners learning key moving averages and experienced traders wanting a clean, informative DMA setup.

Super MTF Clouds (4x3 Pairs)Overview:
This script is based on Ripster's MTF clouds, which transcends the standard moving average cloud indicator by offering a powerful and deeply customizable Multi-Timeframe (MTF) analysis. Instead of being limited to the moving averages of your current charts from the current timeframe, this tool allows you to project and visualize the trend and key support/resistance zones from up to 4 different timeframes simultaneously. User can input up to 6 different EMA values which will form 3 pairs of EMA clouds, for each of the timeframes.
The primary purpose is to provide traders with immediate confluence. By observing how price interacts with moving average clouds from higher timeframes (e.g., Hourly, Daily, Weekly), you can make more informed decisions on your active trading timeframe (e.g., 10 Minute). It's designed as a complete MTF Cloud toolkit, allowing you to display all necessary MTFs in a single script to build a comprehensive view of the market structure without having to flick to different timeframe to look for cloud positions.
Key features:
Four Independent Multi-Timeframe Slots: Each slot can be assigned any timeframe available on TradingView (e.g., D, W, M, 4H).
Three MA Pairs Per Timeframe: For each timeframe, configure up to three separate MA clouds (e.g., a 9/12 EMA pair, a 20/50 EMA pair, and a 100/200 SMA pair).
Complete Customisation: For every single moving average (24 in total), you can independently control:
MA Type: Choose between EMA or SMA.
Length: Any period you require.
Line Color: Full colour selection.
Line Thickness: Adjust the visual weight of each line.
Cloud Control: For every pair (12 in total), you can set the fill colour and transparency.
How To Use This Script:
This tool is best used for confirmation and context. Here are some practical strategies that one can adopt:
Trend Confluence: Before taking a trade based on a signal on your current timeframe, glance at the higher timeframe clouds. If you see a buy signal on the 15-minute chart and the price is currently trading above a thick, bullish Daily cloud, the probability of that trade succeeding is significantly higher. Conversely, shorting into strong HTF support is a low-probability trade.
Dynamic Support & Resistance: The edges of the higher timeframe clouds often act as powerful, dynamic levels of support and resistance. A pullback to the 4-Hour 50 EMA on your 15-minute chart can be a prime area to look for entries in the direction of the larger trend.
Gauging Market Regimes: Use the toggles in the settings to quickly switch between different views. You can have a "risk-on" view with short-term clouds and a "macro" view with weekly and monthly clouds. This helps you adapt your trading style to the current market conditions.
Key Settings:
1. Global Setting
Source For All MAs: This determines the price data point used for every single moving average calculation.
Default: hl2 (an average of the High and Low of each bar). This gives a smooth midpoint price.
Options: You can change this to Close (the most common method), Open, High, Low, or ohlc4 (an average of the open, high, low, and close), among others.
Recommendation: For most standard trend analysis, the default hl2 is the common choice.
2. The Timeframe Group Structure
The rest of the settings are organized into four identical, collapsible groups: "Timeframe 1 Settings" through "Timeframe 4 Settings". Each group acts as a self-contained control panel for one multi-timeframe view.
Within each timeframe group, you have two master controls:
Enable Timeframe: This is the main power switch for the entire group. Uncheck this box to instantly hide all three clouds and lines associated with this timeframe. This is perfect for quickly decluttering your chart or focusing on a different set of analyses.
Timeframe: This dropdown menu is the heart of the MTF feature. Here, you select the higher timeframe you want to analyse (e.g., 1D for Daily, 1W for Weekly, 4H for 4-Hour). All calculations for the three pairs within this group will be based on the timeframe you select here.
3. Pair-Specific Controls
Inside each timeframe group, there are three sections for "Pair 1", "Pair 2", and "Pair 3". These control each individual moving average cloud.
Enable Pair: Just like the master switch for the timeframe, this checkbox turns a single cloud and its two MA lines on or off.
For each pair, the settings are further broken down:
Moving Average Lines (A and B): These two rows control the two moving averages that form the cloud. 'A' is typically used for the shorter-period MA and 'B' for the longer-period one.
Type (A/B): A dropdown menu to select either EMA (Exponential Moving Average) or SMA (Simple Moving Average). EMAs react more quickly to recent price changes, while SMAs are smoother and react more slowly.
Length (A/B): The lookback period for the moving average (e.g., 21, 50, 200).
Color (A/B): Sets the specific colour of the MA line itself on your chart.
Cloud Fill Settings
Fill Color: This controls the colour of the shaded area (the "cloud") between the two moving average lines. For a consistent look, you can set this to the same colour as your shorter MA line.
Transparency: Controls how see-through the cloud is, on a scale of 0 to 100. 0 is a solid, opaque colour, while 100 is completely invisible. The default of 85 provides a light, "cloud-like" appearance that doesn't obscure the price action.
----------------------------------------------------------------------
If anything is not clear please let me know!

6 Dynamic EMAs by Koenigsegg🚀 6 Dynamic EMAs by Koenigsegg
Take control of your chart with ultimate flexibility. This tool gives you 6 customizable EMAs across any timeframe, helping you read the market like a pro — whether you're scalping seconds or swinging days. Built for precision, designed for dominance.
The combinations? Endless. Mix and match any EMA lengths and timeframes for tailored confluence — exactly how elite traders operate.
🔑 Key Features
✅ 6 Fully Customizable EMAs
⏳ Multi-Timeframe Support (from seconds to months)
🎨 Custom Colors & Thickness for each EMA
🚨 Built-in Cross Alerts for instant trade signals
🧠 Clean, efficient logic using request.security()
🔁 Dynamically toggle EMAs on/off
⚙️ Lightweight for smooth chart performance
🧩 Endless combo potential — confluence on your terms
📈 What Is an EMA?
The EMA is a type of moving average that adjusts more quickly to recent price changes than a Simple Moving Average (SMA). It does this by giving exponentially more weight to the most recent candles.
⚙️ How Does It Function?
Smoothing Price Data:
It takes the average of closing prices over a chosen period (like 20 or 50 candles), but gives more influence to the latest prices.
Reacts Quickly to Price Shifts:
Since recent data is weighted more heavily, the EMA adjusts faster to sudden price changes — helping you spot trend reversals or momentum shifts earlier.
Dynamic Support & Resistance:
Traders often use EMAs as moving support/resistance levels. Price often "respects" EMAs in trending markets — bouncing off them during pullbacks.
Trend Confirmation:
- If price is above the EMA, the market is likely in an uptrend.
- If price is below the EMA, the market is likely in a downtrend.
- Multiple EMAs (like 12/21 or 50/200) crossing each other are used for entry/exit signals.
💡 Example:
If you use a 21 EMA on a chart, it shows you the average price of the last 21 candles, but the most recent ones weigh heavier. This makes the EMA more responsive than an SMA, and better for short-term or active trading.
📊 Why EMAs Matter — and How Multi-Timeframe EMAs Give You the Edge
Exponential Moving Averages (EMAs) are essential tools for identifying trend direction, momentum shifts, and dynamic support/resistance. Because they weight recent price data more heavily, EMAs adapt quickly to changing market conditions, giving traders early insight into reversals or continuations.
Where this script shines is in its multi-timeframe (MTF) capability. For example, plotting a daily EMA on a 4H chart gives you high-level directional guidance while still allowing precision entries. This enables confluence between LTF (low timeframe) signals and HTF (high timeframe) momentum — a crucial edge used by institutional-level traders.
You can configure the tool to run classic combos like the 12/21 crossover on your current chart, while layering in a 50 or 200 EMA from a higher timeframe for macro confirmation. The 6th EMA, colored light blue by default, is perfect for adding one final level of structure insight — often used as a long-term anchor or trend bias marker.
Whether you're riding the wave or catching the reversal, these EMAs serve as your adaptable compass in every environment.
🎯 Purpose
This indicator was built to give traders a clear, responsive, and multi-timeframe edge using dynamic Exponential Moving Averages. Whether you're trend-following, identifying momentum shifts, or building a confluence system — these 6 EMAs are here to align with your strategy and style.
💡 Pro Tip
Instead of cluttering your chart with multiple EMA indicators, this script consolidates all into one sleek tool. You can toggle off bands you don't currently need, like running only the 12/21 EMAs on your active chart timeframe, while adding the 12/21 EMAs from a higher timeframe to guide trade decisions.
With this setup, you're not just reacting — you're orchestrating your trades with intention.
⚠️ Disclaimer
This script is for educational and informational purposes only. It does not constitute financial advice. Always do your own research and trade responsibly. Past performance does not guarantee future results.

Pivot Levels with EMA Trend📌 Trend Change Levels with EMA Trend
✨ Description:
This TradingView script identifies clean trend change levels based on 1-hour structure shifts and filters them to keep only those not invalidated. It follows the "Jake Ricci" method, each level is printed at the beginning of the candle that changes the trend, on a 1 hour chart. For precision, make sure to exclude after/pre market and only use the levels on regular hours charts.
It includes dynamic EMAs (9, 50, 200), intraday VWAP, the daily open level printed, and a visual trend label based on EMA(9) slope.
Designed for intermediate traders, it helps build bias, manage entries, and avoid false setups by focusing on clean, reactive levels that the market respects.
🔧 Core Logic:
On the 1H chart, the script compares current and previous closes to detect trend direction. If the trend flips (e.g., up to down), the open of the candle that caused the flip becomes a candidate level.
Only levels that remain untouched by future candle closes are plotted — this filters out “weak” levels that price already violated (which means, a candle closes after passing through the level).
These levels become key S/R zones and often act as reaction points during pullbacks, traps, and liquidity sweeps.
The idea is to check how the price reacts to those levels. Usually there's a clean retest of the level. After that, if the price continues in that direction, it tends to reach the following level.
🔹 Included Tools:
🟣 Trend Change Levels (1H):
Fixed horizontal lines based on confirmed shifts in trend, shown only when not broken.
📉 EMAs (9 / 50 / 200):
Visibility can be set per timeframe. Use for trend context.
📍 EMA Trend Label:
Shows \"UP\", \"DOWN\", or \"RANGE\" based on EMA(9) slope.
🔵 VWAP (Intraday Reset):
Real-time volume-weighted average price that resets daily. Useful for fair value zones and reversion plays.
🟠 Daily Open Line:
Plot of the current day’s open. Used for intraday directional bias. Usually: DO NOT take longs below the Open Print, DO NOT take shorts above it.
📊 ATR Table:
Displays current ATR multiplier on the chart. It's useful to understand if the market is expanding or not.
📈 How to Use It (Strategy):
1. Start on the 1H chart to generate levels.
Only the open of candles that reversed trend are considered — and only if future candles didn’t close through them. I suggest manually adding horizontal lines to mark again the levels, so that they stick to all the timeframes.
2. Use the trend label to decide your bias — \"UP\" for long setups, \"DOWN\" for shorts. Avoid trading against the slope.
3. Switch to the 5m chart and wait for price to approach a plotted level. These are often used for manipulation, retests, or clean reversals.
4. Look for confirmation: rejection candles, break-and-retest, strong engulfing candles, or traps above/below the level. ALWAYS check the price action around the level, along with the volume.
5. Check if VWAP or an EMA is near the level. If yes, the confluence strengthens the trade idea.
6. Use the ATR value to understand if the market is expanding (candles are bigger than the ATR). You don't want to stay in a slow and ranging trade.
✅ Example Entry Flow:
1. On the 1H chart, note a trend change level printed recently.
2. Check the current trend label — if it says \"UP,\" prefer longs.
3. Wait for price to retrace toward the level.
4. On the 5m, look for a bullish engulfing candle or trap setup at the level.
5. Check if VWAP and EMA(50) are near. If yes, execute the trade.
6. Set stop just under the low of the candle prior to your entry. Ideally, a retracing candle.
To be clear: imaging to be LONG, you wait for a retracement that should touch your level. You wait for a candle that resumes the LONG trend, enter when it breaks the high of the previous candle (sill in retracement), you place your stop under the candle prior to your entry.
Notes:
No repainting — levels only show up after confirmed shifts.
Removes broken levels for chart clarity and reliability.
Helps spot high-probability pullback zones and fakeouts.
Perfect confluence tool to support price action, SMC, or EMA strategies.
Works across multiple timeframes with customizable inputs.
👤 Ideal For:
Intraday traders looking for reactive entry points and direction confirmation.
Swing traders wanting to pinpoint continuation zones or reversal pivots.
🚨 Final Note: This indicator doesn’t generate buy/sell signals. It improves your trade filtering by identifying areas the market already respected and reacting to them with price action. Combine it with your own system , test it in replay, and use screenshots to document setups.
📌 If used with discipline, this becomes a precision tool — not a signal generator.

SMA 21/30/50/100/200 with Cross by DragonByteCombines several key simple moving averages into one slot without going overboard. Includes cross indicators between the 50/100 and the 50/200 day SMA's.

EMA 20/50 & 50/200 Cross StrategyThis is a simple script using the 20 50 & 200 EMAs
Future modifications coming. I plan to add volume and other plots to this strategy as I continue to develop it.

Multi-timeframe 24 moving averages + BB+SAR+Supertrend+VWAP █ OVERVIEW
The script allows to display up to 24 moving averages ("MA"'s) across 5 timeframes plus two bands (Bollinger Bands or Supertrend or Parabolic SAR or VWAP bands) each from its own timeframe.
The main difference of this script from many similar ones is the flexibility of its settings:
- Bulk enable/disable and/or change properties of several MAs at once.
- Save 3 of your frequently used templates as presets using CSV text configurations.
█ HOW TO USE
Some use examples:
In order to "show 31, 50, 200 EMAs and 20, 100, 200 SMAs for each of 1H, 4H, D, W, M timeframes using blue for short MA, yellow for mid MA and red for long MA" use the settings as shown on a screenshot below.
In order to "Show a band of chart timeframe MA's of lengths 5, 8, 13, 21, 34, 55, 100 and 200 plus some 1H, 4H, D and W MAs. Be able to quickly switch off the band of chart tf's MAs. For chart timeframe MA's only show labels for 21, 100 and 200 EMAs". You can set TF1 and TF2 to chart's TF and set you fib MAs there and configure fixed higher timeframe MAs using TF3, TF4 and TF5 (e.g. using 1H, D and W timeframes and using 1H 800 in place of 4H 200 MA). However, quicker way may be using CSV - the syntax is very simple and intuitive, see Preset 2 as it comes in the script. You can easily switch chart tf's band of MAs by toggling on/off your chart timeframe TF's (in our example, TF1 and TF2).
The settings are either obvious or explained in tooltips.
Note 1: When using group settings and CSV presets do not forget that individual setting affected will no have any effect. So, if some setting does not work, check whether it is overridden with some group setting or a CSV preset.
Note 2: Sometimes you can notice parts of MA's hanging in the air, not lasting up to the last bar. This is not a bug as explained on this screenshot:
█ FOR DEVELOPERS
The script is a use case of my CSVParser library, which in turn uses Autotable library, both of which I hope will be quite helpful. Autotable is so powerful and comprehensive that you will hardly ever wish to use normal table functions again for complex tables.
The indicator was inspired by Pablo Limonetti's url=https://www.tradingview.com/script/nFs56VUZ/]Multi Timeframe Moving Averages and Raging @RagingRocketBull's # Multi SMA EMA WMA HMA BB (5x8 MAs Bollinger Bands) MAX MTF - RRB

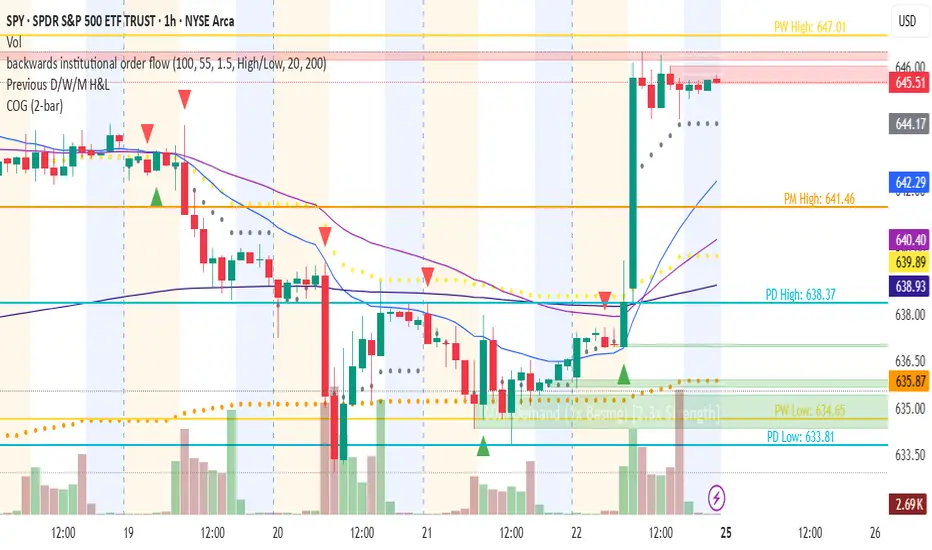
Changing of the GuardChanging of the Guard (COG) - Advanced Reversal Pattern Indicator
🎯 What It Does
The Changing of the Guard (COG) indicator identifies high-probability reversal setups by detecting specific candlestick patterns that occur at key institutional levels. This indicator combines traditional price action analysis with volume-weighted and moving average confluence to filter out noise and focus on the most reliable trading opportunities.
🔧 Key Features
Multi-Timeframe VWAP Analysis
• Daily VWAP (Gray circles) - Intraday institutional reference
• Weekly VWAP (Yellow circles) - Short-term institutional bias
• Monthly VWAP (Orange circles) - Long-term institutional sentiment
Triple EMA System
• EMA 20 (Blue) - Short-term trend direction
• EMA 50 (Purple) - Medium-term momentum
• EMA 200 (Navy) - Long-term market structure
Adaptive COG Pattern Detection
• 2-Bar Mode: Quick reversal signals for scalping
• 3-Bar Mode: Balanced approach for swing trading (default)
• 4-Bar Mode: Conservative signals for position trading
📊 How It Works
The indicator identifies "changing of the guard" moments when:
1. Pattern Formation: 2-4 consecutive bars show exhaustion in one direction
2. Reversal Confirmation: A counter-trend bar appears with strong momentum
3. Confluence Trigger: The reversal bar crosses through a significant VWAP or EMA level
Bullish COG: Green triangle appears below bars when bearish exhaustion meets bullish reversal at key support
Bearish COG: Red triangle appears above bars when bullish exhaustion meets bearish reversal at key resistance
💡 Trading Applications
Swing Trading: Use 3-bar mode with EMA 50/200 confluence for multi-day holds
Day Trading: Use 2-bar mode with Daily VWAP confluence for intraday reversals
Position Trading: Use 4-bar mode with Monthly VWAP confluence for major trend changes
⚙️ Customization Options
• Toggle VWAP display on/off
• Toggle EMA display on/off
• Toggle COG signals on/off
• Select detection mode (2-bar, 3-bar, 4-bar)
• Built-in alert system for automated notifications
🎨 Visual Design
Clean, professional interface with:
• Subtle dotted lines for VWAPs to avoid chart clutter
• Color-coded EMAs for easy trend identification
• Clear triangle signals that don't obstruct price action
• Customizable display options for different trading styles
📈 Best Practices
• Combine with volume analysis for additional confirmation
• Use higher timeframe bias to filter trade direction
• Consider market structure and support/resistance levels
• Backtest different modes to find optimal settings for your strategy
⚠️ Risk Management
This indicator identifies potential reversal points but should be used with proper risk management. Always consider:
• Overall market trend and structure
• Volume confirmation
• Multiple timeframe analysis
• Appropriate position sizing
Perfect for traders who want to catch reversals at institutional levels with high-probability setups. The confluence requirement ensures you're trading with the smart money, not against it.
CTA-min D1 — Donchian 55/20 Trend Breakout (ATR Risk)What it is
A clean, daily trend-following breakout inspired by classic CTA/Turtle logic. It buys strength and sells weakness, then lets winners run with a channel-based trailing stop. No curve-fitting, no clutter—just rules.
How it trades
Timeframe: Daily (D1)
Entry: Close breaks the previous 55-bar Donchian channel (above for longs, below for shorts).
Exit/Trail: Trailing stop at the 20-bar Donchian channel on the opposite side (no fixed TP).
Risk: Initial stop = ATR(N) × stopMult (ATR is smoothed). Position size risks riskPct% of equity based on stop distance.
Labels: “BUY/SELL” only on the entry bar; “STOP BUY/STOP SELL” only on the exit bar.
Pyramiding: Off (one position at a time).
Regime Alignment with EMAs (recommended filter, not enforced by code)
Add EMA 50 and EMA 200 to the D1 chart.
Long bias: take BUY signals only when EMA50 > EMA200 (bullish regime).
Short bias: take SELL signals only when EMA50 < EMA200 (bearish regime).
Optional: for extra selectivity, require the H4 EMAs (50/200) to align with D1 before acting on a signal.
Inputs
entryN (55), exitN (20), atrLen (20), atrSmooth (10), stopMult (2.0), riskPct (0.5%–1.0% recommended).
Works well on (tested by user)
BTCUSD (Bitcoin), EURUSD, GBPJPY, NAS100/US100, USDJPY, AUDUSD, XAGUSD (Silver), US30 (Dow), JP225 (Nikkei), EURGBP, NZDUSD, EURCHF, USDCHF.
How to use
Apply to D1 charts. Review once per day after the daily close and execute next session open to mirror backtest assumptions. Best used as a portfolio strategy across multiple uncorrelated markets. Use the EMA alignment above as a discretionary regime filter to reduce false breakouts.
Notes
For educational use. Markets involve risk; past performance does not guarantee future results. Use responsible position sizing.

Linh Index Trend & Exhaustion SuitePurpose: One overlay to judge trend, reversal risk, overextension, and volatility squeezes on indexes (built for VNINDEX/VN30, works on any symbol & timeframe).
What it shows
Trend state: Bull / Bear / Transition via 20/50/200 EMAs + slope check.
Overextension heatmap: Background paints when price is stretched vs the 20-EMA by ATR or % (you set the thresholds).
Squeeze detection:
Squeeze ON (yellow dot): Bollinger Bands (20,2) inside Keltner Channels (20,1.5).
Squeeze OFF + Release: White dot; script confirms direction only when close > BB upper (up) or close < BB lower (down).
52-week context: Distance to 52-week high/low (%).
Higher-TF alignment: Optional weekly trend reading shown on the label while you’re on the daily.
Anchored VWAP(s): Two optional AVWAPs from dates you choose (e.g., YTD open, last big gap/earnings).
Plots & labels
EMAs 20/50/200 (toggle on/off).
Optional BB & KC bands for diagnostics.
AVWAP #1 / #2 (optional).
Status label with: Trend, EMAs, Dist to 20-EMA (%, ATR), 52-week distances, HTF state.
Built-in alerts (set “Once per bar close”)
EMA10 ↔ EMA20 cross (early momentum shift)
EMA20 ↔ EMA50 cross (trend confirmation/negation)
Price ↔ EMA200 cross (long-term regime)
Squeeze Release UP / DOWN (BB breakout after squeeze)
Overextension Cool-off UP / DN (stretched vs 20-EMA + momentum rolling)
Near 52-week High (within your % threshold)
How to use (playbook)
Map regime: Prefer trades when Daily = Bull and HTF (Weekly) = Bull (shown on label).
Hunt expansion: Yellow → White dot and close beyond BB = fresh move.
Avoid chasing stretch: If background is painted (overextended vs 20-EMA), wait for a pullback or intraday base.
Locations matter: 52-week proximity + HTF Bull improves breakout quality.
Anchors: Add AVWAP from YTD open or last major gap to frame support/resistance.
Suggested settings
Overextension: ATR = 2.0, % = 4.0 to start; tune per index volatility.
Squeeze bands: BB(20,2) & KC(20,1.5) default are balanced; tighten KC (1.3) for more signals, widen (1.8) for fewer/higher quality.
Timeframes: Daily for signals, Weekly for bias. Optional 65-min for entries.

Painel Técnico (4H x 1D) — Clean UI + Alertas BrenoG📋 Main Functions
1️⃣ Analysis in two fixed timeframes
4 hours and 1 day analyzed in parallel.
Each column in the table displays the data for its respective timeframe.
2️⃣ Entry point based on oversold conditions
The “entry point” is not the current price, but rather the last candle that went into oversold territory (RSI ≤ configured threshold).
If there has been no recent oversold condition, the current price is used as a fallback.
All calculations (Buy Zone, Stops, TPs) are based on this point.
3️⃣ Buy Zone
Defined as:
java
Copiar
Editar
Low Zone = entry * (1 - width%)
High Zone = entry
Always visible in the table, but alerts can be set to trigger only if RSI is oversold at the moment of entry.
4️⃣ Automatic Stops
Moderate Stop and Conservative Stop, calculated as a % below the entry point.
Displayed in the table with black text on a gray background for emphasis.
Alerts trigger when price crosses below these levels.
5️⃣ Take Profits (TP1–TP4)
Calculated from the entry point:
By percentage (usePercentTP = true) or
By fixed prices (usePercentTP = false).
The table displays:
Target price
% gain over the entry point
They only appear when RSI > 50 and EMA50 > EMA200 (the “alignment” condition).
Alerts trigger only on breakouts upward.
6️⃣ Context Indicators
RSI → shows numeric value and green/red color.
MACD → indicates if the MACD line is above or below the signal line.
EMAs 50/200 → indicates “Golden Cross” or “Death Cross”.
Price vs EMA200 → dedicated row showing “Above” or “Below EMA 200” with green/red color.
7️⃣ Visual Panel
Semi–transparent dark gray background, thin borders.
Colored header:
Blue for 4H
Orange for 1D
Rows separated by data type for easy reading.
Configurable font size (tiny to large).
Table position configurable (top_left, top_right, etc.).
8️⃣ Integrated Alerts
Entry/Exit of Buy Zone
Touch of each TP
Touch of each Stop
RSI entering Oversold
All alerts are separated by timeframe with clear, fixed messages.
📌 Simple Summary:
It’s an intelligent panel that combines multi–timeframe technical analysis, automatic calculation of entries/stops/TPs based on oversold conditions, and ready–to–use alerts — all presented in a visual, compact, and fully configurable format.

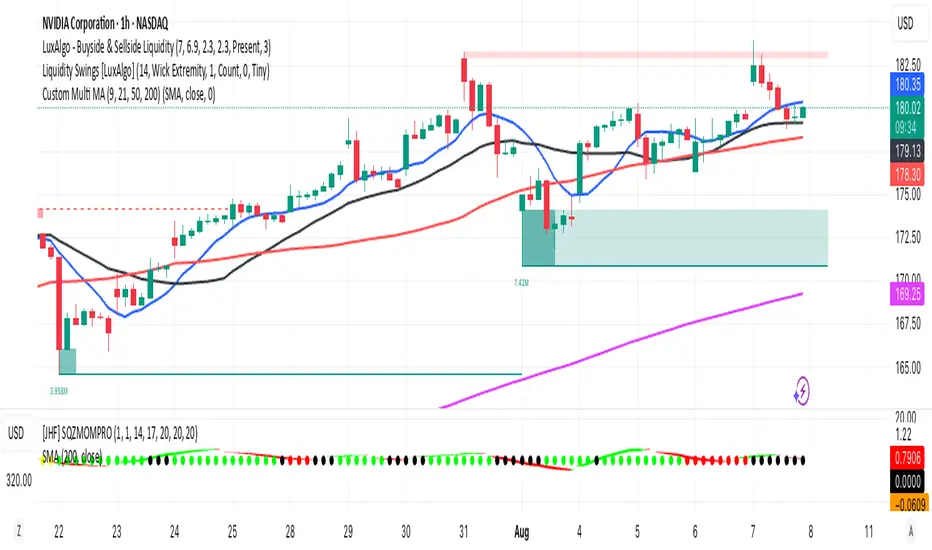
Multi MA (9, 21, 50, 200)This indicator plots four commonly used moving averages — 9, 21, 50, and 200 — with customizable smoothing methods and color-coded lines optimized for visibility on any chart background.
EMA 10,20 SMA 50, 200This indicator is very helpful for swing traders who plan their trades using EMAs and SMAs. It is used on the daily chart and displays the 10- and 20-EMA, as well as the 50- and 200-SMA.

Session Breakouts & Trend Indicator# Session Breakouts & Trend Indicator
This indicator identifies high-probability trading opportunities by tracking key intraday sessions and their breakouts while aligning them with the overall market trend direction.
## What Makes This Indicator Unique
Unlike standard breakout indicators that only identify when price crosses a threshold, this indicator:
- Dynamically identifies and tracks important daily sessions (default: AM 09:00-10:00 and PM 15:00-16:00)
- Determines trend direction using a triple EMA system (20/50/200)
- Shows when breakouts align with the overall trend (higher probability setups)
- Provides visual confirmation with session ranges, breakout levels, and background highlighting
- Includes a comprehensive information panel showing trend/session alignment
## How It Works
The indicator tracks two important daily sessions:
1. **AM Session**: Typically the first hour of trading (default: 09:00-10:00)
2. **PM Session**: Typically the last hour of trading (default: 15:00-16:00)
For each session, it:
- Marks the high and low range
- Establishes breakout levels above/below these ranges
- Detects when price breaks beyond these levels
- Determines if the breakout aligns with the prevailing trend
The trend is calculated using three EMAs (20, 50, 200) for reliable trend identification.
## How To Use
1. Apply the indicator to your chart (works best on 5-minute timeframes)
2. Adjust session times to match your trading schedule if needed
3. Watch for breakouts above session highs (bullish) or below session lows (bearish)
4. Check the information panel to see if the breakout aligns with the trend
5. Enter trades in the direction of trend-aligned breakouts for higher probability setups
6. Set stop losses below the opposite side of the session range
## Settings
- **Session Times**: Customize AM and PM session times
- **EMA Lengths**: Adjust trend determination sensitivity
- **Visualization Options**: Toggle display of sessions, breakouts, and VWAP
- **Alert Settings**: Configure alerts for breakouts and trend-aligned conditions
This indicator is valuable for day traders and swing traders looking for objective entry points with higher probability of success.

CSVParser█ OVERVIEW
The library contains functions for parsing and importing complex CSV configurations (with a special simple syntax) into a special hierarchical object (of type objProps ) as follows:
Functions:
parseConfig() - reads CSV text into an objProps object.
toT() - displays the contents of an objProps object in a table form, which allows to check the CSV text for syntax errors.
getPropAr() - returns objProps.arS array for child object with `prop` key in mpObj map (or na if not found)
This library is handy in allowing users to store presets for the scripts and switch between them (see, e.g., my HTF moving averages script where users can switch between several preset configuations of 24 MA's across 5 timeframes).
█ HOW THE SCRIPT WORKS.
The script works as follows:
all values read from config text are stored as strings
Nested brackets in config text create a named nested objects of objProps0, ... , objProps9 types.
objProps objects of each level have the following fields:
- array arS for storing values without names (e.g. "12, 23" will be imported into a string array arS as )
- map mpS for storing items with names (e.g. "tf = 60, length = 21" will be imported as <"tf", "60"> and <"length", "21"> pairs into mpS )
- map mpObj for storing nested objects (e.g. "TF1(tf=60, length(21,50,100))" creates a <"TF1, objProps0 object> pair in mpObj map property of the top level object (objProps) , "tf=60" is stored as <"tf", "60"> key-value pair in mpS map property of a next level object (objProps0) and "length (...)" creates a <"length", objProps1> pair in objProps0.mpObj map while length values are stored in objProps1.arS array as strings. Every opening bracket creates a next level objProps object.
If objects or properties with duplicate names are encountered only the latest is imported
(e.g. for "TF1(length(12,22)), TF1(tf=240)" only "TF1(tf=240)" will be imported
Line breaks are not regarded as part of syntax (i.e. values are imported with line breaks, you can supply
symbols "(" , ")" , "," and "=" are special characters and cannot be used within property values (with the exception of a quoted text as a value of a property as explained below)
named properties can have quoted text as their value. In that case special characters within quotation marks are regarded as normal characters. Text between "=" and opening quotation mark as well as text following the closing quotation mark and until next property value is ignored. E.g. "quote = ignored "The quote" also ignored" will be imported as <"quote", "The quote">. Quotation marks within quotes must be excaped with "\" .
if a key names happens to be a multi-line then only first line containing non-space characters (trimmed from spaces) is taken as a key.
")," or ") ," and similar do not create an empty ("") array item while ",," does. (",)" creates an "" array item)
█ CSV CONFIGURATION SYNTAX
Unnamed values: just list them comma separated and they will be imported into arS of the object of the current level.
Named values: use "=" sign as follows: "property1=value1, property2 = value2"
Value of several objects: Use brackets after the name of the object ant list all object properties within the brackets (including its child objects if necessary). E.g. "TF1(tf =60, length(21,200), TF2(tf=240, length(50,200)"
Named and unnamed values as well as objects can go in any order. E.g. "12, tf=60, 21" will be imported as follows: "12", "21" will go to arS array and <"tf", "60"> will go to mpS maP of objProps (the top level object).
You can play around and test your config text using demo in this library, just edit your text in script settings and see how it is parsed into objProps objects.
█ USAGE RECOMMENDATIONS AND SAMPLE USE
I suggest the following approach:
- create functions for your UDT which can set properties by name.
- create enumerator functions which iterates through all the property names (supplied as a const string array) and imports their values into the object
█ SAMPLE USE
A sample use of this library can be seen in my Multi-timeframe 24 moving averages + BB+SAR+Supertrend+VWAP script where settings for the MAs across many timeframes are imported from CSV configurations (presets).
█ FULL LIST OF FUNCTIONS AND PROPERTIES
nzs(_s, nz)
Like nz() but for strings. Returns `nz` arg (default = "") if _s is na.
Parameters:
_s (string)
nz (string)
method init(this)
Initializes objProps obj (creates child maps and arrays)
Namespace types: objProps
Parameters:
this (objProps)
method toT(this, nz)
Outputs objProps to string matrices for further display using autotable().
Namespace types: objProps, objProps1, ..., objProps9
Parameters:
this (objProps/objProps1/..../objProps9)
nz (string)
Returns: A tuple - value, merge and color matrix (autotable() parameters)
method parseConfig(this, s)
Reads config text into objProps (unnamed values into arS, named into mpS, sub-levels into mpObj)
Namespace types: objProps
Parameters:
this (objProps)
s (string)
method getPropArS(this, prop)
Returns a string array of values for a given property name `prop`. Looks for a key `prop` in objProps.mpObj
if finds pair returns obj.arS, otherwise returns na. Returns a reference to the original, not a copy.
Namespace types: objProps, objProps1, ..., objProps8
Parameters:
this (objProps/objProps1/..../objProps8)
prop (string)
method getPropVal(this, prop, id)
Checks if there is an array of values for property `prop` and returns its `id`'s element or na if not found
Namespace types: objProps, objProps1, ..., objProps8
Parameters:
this (objProps/objProps1/..../objProps8) : objProps object containing array of property values in a child objProp object corresponding to propertty name.
prop (string) : (string) Name of the property
id (int) : (int) Id of the element to be returned from the array pf property values
objProps9 type
Object for storing values read from CSV relating to a particular object or property name.
Fields:
mpS (map) : (map() Stores property values as pairs
arS (array) : (string ) Array of values
objProps, objProps0, ... objProps8 types
Object for storing values read from CSV relating to a particular object or property name.
Fields:
mpS (map) : (map() Stores property values as pairs
arS (array) : (string ) Array of values
mpObj (map) : (map() Stores objProps objects containing properties's data as pairs

LuizinTradezone - 9 MME + 20,50,200 MMAScript que inclui a média móvel de 9 (exponencial), e as médias aritméticas de 20, 50 e 200
Simple and Exponential Moving Averages (20, 50, 200)Displays the 20, 50, and 200 simple and exponential moving averages in 1 indicator.
Simple Moving Averages (20, 50, 200)Allows you to plot 20 day, 50 day, and 200 day simple moving averages using only 1 indicator.
EMA20-50-200Display EMA 20, 50 and 200 in a single indicator
You can choose colors and modify the EMA input value
Simple Moving Averages (10 & 20 & 50 & 200) for ScalpingSimple Moving Averages for Scalping (10 / 20 / 50 / 200 SMAs)