CPI Inflation Monitor (Change YoY & MoM)📊 CPI Inflation Monitor - Complete Macro Analysis Tool
This indicator provides a comprehensive view of Consumer Price Index (CPI) inflation trends, essential for understanding monetary policy, market conditions, and making informed trading decisions.
🎯 KEY FEATURES:
- Dual Perspective Analysis:
- Year-over-Year (YoY): Histogram bars showing annual inflation rate
- Month-over-Month (MoM): Line overlay showing monthly price changes
- Visual Reference System:
- Dashed line at 2% (Fed's official inflation target for YoY)
- Dotted line at 0.17% (equivalent monthly target for MoM)
- Color-coded bars: Red above target, Green below target
- Real-Time Data Table:
- Current CPI Index value
- YoY inflation rate with color coding
- MoM inflation rate with color coding
- Deviation from Fed target
- Automated Alerts:
- YoY crosses above/below 2% target
- MoM crosses above/below 0.17% target
- Perfect for staying informed without constant monitoring
📈 WHY THIS MATTERS FOR TRADERS:
CPI is the most widely reported inflation metric and directly influences:
- Federal Reserve interest rate decisions
- Bond yields and currency valuations
- Stock market sentiment (especially growth vs. value rotation)
- Cryptocurrency and risk asset performance
Rising inflation (red bars) typically leads to:
→ Higher interest rates → Negative for growth stocks, crypto
→ Stronger USD → Pressure on commodities
Falling inflation (green bars) typically leads to:
→ Rate cut expectations → Positive for growth stocks, crypto
→ Weaker USD → Support for commodities
🔍 HOW TO USE:
1. Strategic Positioning: Use YoY trend (thick bars) for long-term asset allocation
2. Tactical Timing: Use MoM trend (thin line) to identify turning points early
3. Divergence Trading: When MoM falls but YoY remains high, anticipate trend reversal
4. Fed Policy Prediction: Distance from 2% target indicates Fed's likely hawkishness
💡 PRO TIPS:
- Multiple months of MoM above 0.3% = Accelerating inflation → Fed turns hawkish
- MoM turning negative while YoY still elevated = Peak inflation → Position for pivot
- Compare with PPI and PCE indicators for complete inflation picture
- Use alerts to catch important threshold crossings automatically
📊 DATA SOURCE:
Official CPI data from FRED (Federal Reserve Economic Data), updated monthly mid-month when new data releases occur.
🎨 CUSTOMIZATION:
Fully customizable through settings:
- Toggle YoY/MoM displays
- Adjust target levels
- Customize colors for visual preference
- Show/hide absolute CPI values
Perfect for: Macro traders, swing traders, long-term investors, and anyone wanting to understand the inflation environment affecting their portfolio.
Note: This indicator works on any chart timeframe as it loads external monthly economic data.
Cari dalam skrip untuk "美国cpi公布时间"
[BT] NedDavis Series: CPI Minus 5-Year Moving Average🟧 GENERAL
The script works on the Monthly Timeframe and has 2 main settings (explained in FEATURES ). It uses the US CPI data, reported by the Bureau of Labour Statistics.
🔹Functionality 1: The main idea is to plot the distance between the CPI line and the 5 year moving average of the CPI line. This technique in mathematics is called "deviation from the moving average". This technique is used to analyse how has CPI previously acted and can give clues at what it might do in the future. Economic historians use such analysis, together with specific period analysis to predict potential risks in the future (see an example of such analysis in HOW TO USE section. The mathematical technique is a simple subtraction between 2 points (CPI - 5yr SMA of CPI).
▶︎Interpretation for deviation from a moving average:
Positive Deviation: When the line is above its moving average, it indicates that the current value is higher than the average, suggesting potential strength or bullish sentiment.
Negative Deviation: Conversely, when the line falls below its moving average, it suggests weakness or bearish sentiment as the current value is lower than the average.
▶︎Applications:
Trend Identification: Deviations from moving averages can help identify trends, with sustained deviations indicating strong trends.
Reversal Signals: Significant deviations from moving averages may signal potential trend reversals, especially when combined with other technical indicators.
Volatility Measurement: Monitoring the magnitude of deviations can provide insights into market volatility and price movements.
Remember the indicator is applying this only for the US CPI - not the ticker you apply the indicator on!
🔹Functionality 2: It plots on a new pane below information about the Consumer Price Index. You can also find the information by plotting the ticker symbol USACPIALLMINMEI on TradingView, which is a Monthly economic data by the OECD for the CPI in the US. The only addition you would get from the indicator is the plot of the 5 year Simple Moving Average.
🔹What is the US Consumer Price Index?
Measures the change in the price of goods and services purchased by consumers;
Traders care about the CPI because consumer prices account for a majority of overall inflation. Inflation is important to currency valuation because rising prices lead the central bank to raise interest rates out of respect for their inflation containment mandate;
It is measured as the average price of various goods and services are sampled and then compared to the previous sampling.
Source: Bureau of Labor Statistics;
FEATURES OF INDICATOR
1) The US Consumer Price Index Minus the Five Year Moving Average of the same.
As shown on the picture above and explained in previous section. Here a more detailed view.
2) The actual US Consumer Price Index (Annual Rate of change) and the Five year average of the US Consumer Price Index. Explained above and shown below:
To activate 2) go into settings and toggle the check box.
HOW TO USE
It can be used for a fundamental analysis on the relationship between the stock market, the economy and the Feds decisions to hike or cut rates, whose main mandate is to control inflation over time.
I have created this indicator to show my analysis in this idea:
What does a First Fed Rate cut really mean?
CREDITS
I have seen such idea in the past posted by the institutional grade research of NedDavis and have recreated it for the TradingView platform, open-source for the community.

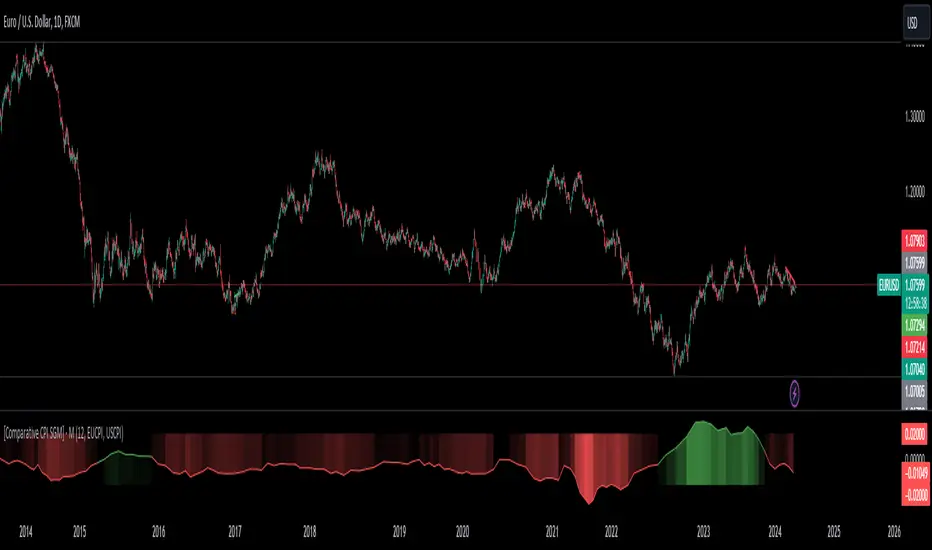
[Comparative CPI SGM]Code Explanation
User Inputs:
len: Defines the period over which CPI changes are calculated, with selectable options of 12, 6, and 3 months.
CP1 and CP2: These are the economic zones whose CPI data are being compared. The options include CPI from various regions like the EU, USA, UK, etc.
Calculating and Comparing Changes:
Calculates the annual change for each CPI and then computes the difference between these two changes.
Trading Utility
In trading, CPI variations are key indicators of inflation within different economic regions. Monetary policy decisions by central banks, heavily influenced by these data, significantly impact financial markets, especially in forex and bond markets.
Monetary Policy Forecasting:
If inflation in one region is significantly higher than in another, the central bank might raise interest rates, potentially strengthening that region's currency.
Currency Trading Strategy:
Traders might use this indicator to speculate on currency pair movements. For example, if US CPI is rising faster than the EU CPI, this might suggest a potential appreciation of the USD against the EUR.
Macroeconomic Analysis:
Understanding where inflation pressures are strongest can guide longer-term investment decisions, such as choosing between emerging and developed markets.
Annualizer: New Indicator + CPI AnalysisThis indicator calculates the annualized month-over-month percent change of a cumulative index and plots it alongside the year-over-year percent change for comparison. It was developed for the purpose of analyzing the inflation rate of CPI indexes such as “CPIAUCSL.” It can also be used on M2 money supply and pretty much any cumulative index. It will not produce useful outputs on percent change indexes such as “USCCPI” because it performs percent change calculations which are already applied to those indexes.
This indicator takes data from the monthly chart, regardless of how often the data is reported or what the timeframe of the current chart is. Doing so allows it to work on all timeframes while displaying only monthly data outputs but limits it from recognizing data which might be released more often than once per month. This limitation should be suitable for macroeconomic data such as CPI and M2 money supply which are usually analyzed on a month-to-month basis.
If the ticker symbol is "M2SL" which is M2 money supply, annualized percent change is plotted in green, otherwise, it’s plotted in blue.
CPI analysis:
Upon deploying this indicator, it was observed that the year-over-year (YoY) inflation rate (red) is a lagging indicator of the annualized month-over-month (MoM) inflation rate (blue) and that it appears to almost be a moving average of it. A moving average plot was temporarily added for comparison to the YoY and it was found that the difference between the two plots is negligible and that for the purposes of high-level analysis of inflation, the two plots can be considered to be no different from one another. Below is a screenshot for demonstration. Notice how closely the white 12-month SMA of the annualized rate tracks the YoY rate.
For other indexes which may see more dramatic changes month-over-month such as M2 money supply, the difference between the two signals becomes more pronounced but they are still comparable. The conclusion is that the YoY inflation rate can be considered to be a 12-month simple moving average of the annualized MoM rate.
12-month SMA:
It’s easy to see and stands to reason that if the annualized MoM inflation rate (blue) remains where it has been for the previous 2 months YoY inflation (red) will begin falling and eventually reach similar levels due to its moving-average-like behavior. This will bring us back to the 2% YoY inflation target of the Fed within no more than 10 months. There may be a perception that deflation is required to bring prices back down to the purple channel of CPI to make prices pre-Covid "normal" again. We were headed in that direction in July with a slightly negative MoM CPI read. What may have freaked investors out about the August report (most recent as of this writing) is that the inflation rate, rather than continuing into negative deflationary territory, has bounced back into positive territory.
M2 money supply isn’t an integral part of this analysis, but it helps demonstrate the indicator. It can be observed that CPI growth lags M2 money supply growth which seems to have leveled off.
I’m not a macroeconomist so I’m probably missing some things, but I do not see a lagging indicator such as YoY inflation being at 8.25% while annualized MoM inflation is at 1.42% as something to freak out about as investors have seemingly done. I’m a stock market bear as of last week, but I do not feel this CPI analysis strongly supports a bearish thesis, nor is it bullish. Next month’s annualized MoM % change may begin to sway me one way or the other depending on what this chart looks like when it’s updated.

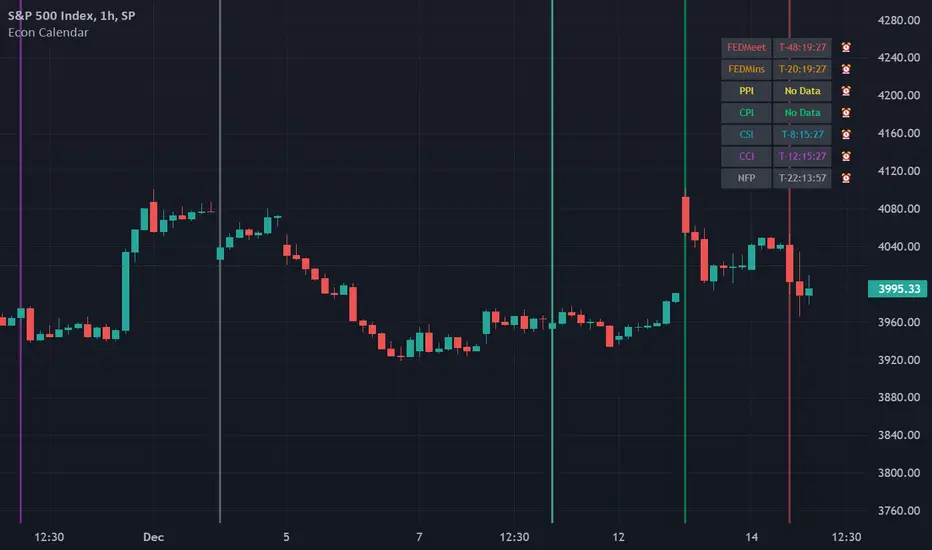
Economic Calendar Events: FOMC, CPI, and moreThis script plots major events from the Economic Calendar that often correspond to major pivot points in various markets. It also includes built-in logic to retroactively adjust larger time intervals (i.e. greater than 1 hour) to be correctly aligned with the interval during which the event occurred.
Events are taken from the Economic Calendar and will be updated periodically at the following library:
The above library can be used to conveniently access date-related data for major Meetings, Releases, and Announcements as integer arrays, which can be used in other indicators. Currently, it has support for the following events:
FOMC Meetings
The FOMC meets eight times a year to determine the course of monetary policy. The FOMC's decisions are based on a review of economic and financial developments and its assessment of the likely effects of these developments on the economic outlook.
FOMC Minutes
The FOMC minutes are released three weeks after each FOMC meeting. The minutes provide a detailed account of the FOMC's discussion of economic and financial developments and its assessment of the likely effects of these developments on the economic outlook.
Producer Price Index (PPI) Releases
The Producer Price Index (PPI) measures changes in the price level of goods and services sold by domestic producers. The PPI is a weighted average of prices of a basket of goods and services, such as transportation, food, and medical care. PPI is a leading indicator of CPI.
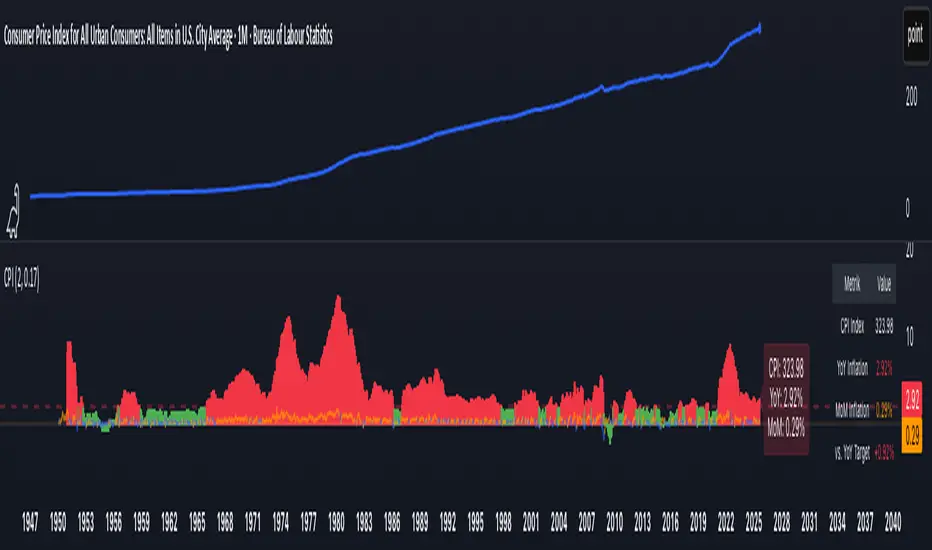
Consumer Price Index (CPI) Releases
The Consumer Price Index (CPI) measures changes in the price level of goods and services purchased by households. The CPI is a weighted average of prices of a basket of consumer goods and services, such as transportation, food, and medical care. CPI is one of the most widely used measures of inflation.
Consumer Sentiment Index (CSI) Releases
The University of Michigan's Consumer Sentiment Index (CSI) is a measure of consumer attitudes about the economy. The CSI is based on a monthly survey of U.S. households and reflects the consumers' assessment of present and future economic conditions. The CSI is a leading indicator of consumer spending, which accounts for about two-thirds of U.S. economic activity.
Consumer Confidence Index (CCI) Releases
The Consumer Confidence Index is a survey that measures how optimistic or pessimistic consumers are regarding their expected financial situation.
Non-Farm Payroll (NFP) Releases
The Non-Farm Payroll (NFP) is a measure of the change in the number of employed persons, excluding farm workers and government employees. The NFP is a leading indicator of consumer spending, which accounts for about two-thirds of U.S. economic activity.

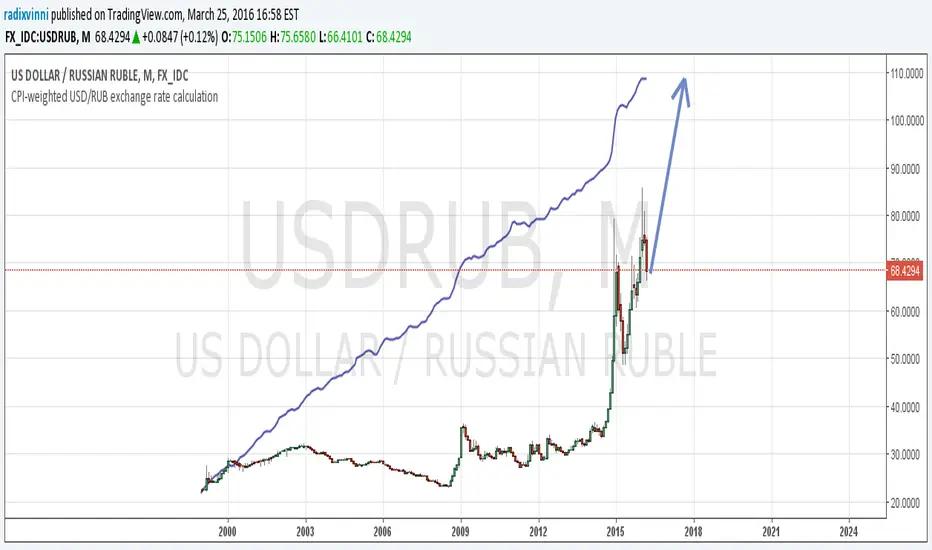
CPI-weighted USD/RUB exchange rate calculationProjected target for USDRUB calculated by inflation rates (consumer price indexes) is 110.
US CPIIntroducing "US CPI" Indicator
The "US CPI" indicator, based on the Consumer Price Index (CPI) of the United States, is a valuable tool for analyzing inflation trends in the U.S. economy. This indicator is derived from official data provided by the U.S. Bureau of Labor Statistics (BLS) and is widely recognized as a key measure of inflationary pressures.
What is CPI?
The Consumer Price Index (CPI) is a measure that examines the average change in prices paid by consumers for a basket of goods and services over time. It is an essential economic indicator used to gauge inflationary trends and assess changes in the cost of living.
How is "US CPI" Calculated?
The "US CPI" indicator in this script retrieves CPI data from the Federal Reserve Economic Data (FRED) using the FRED:CPIAUCSL symbol. It calculates the rate of change in CPI over a specified period (typically 12 months) and applies technical analysis tools like moving averages (SMA and EMA) for trend analysis and smoothing.
Why Use "US CPI" Indicator?
1. Inflation Analysis: Monitoring CPI trends provides insights into the rate of inflation, which is crucial for understanding the overall economic health and potential impact on monetary policy.
2. Policy Implications: Changes in CPI influence decisions by policymakers, central banks, and investors regarding interest rates, fiscal policies, and asset allocation.
3. Market Sentiment: CPI data often impacts market sentiment, influencing trading strategies across various asset classes including currencies, bonds, and equities.
Key Features:
1. Customizable Smoothing: The indicator allows users to apply exponential moving average (EMA) smoothing to CPI data for clearer trend identification.
2. Visual Representation: The plotted line visually represents the inflation rate based on CPI data, helping traders and analysts assess inflationary pressures at a glance.
Sources and Data Integrity:
The CPI data used in this indicator is sourced directly from FRED, ensuring reliability and accuracy. The script incorporates robust security protocols to handle data requests and maintain data integrity in a trading environment.
In conclusion, the "US CPI" indicator offers a comprehensive view of inflation dynamics in the U.S. economy, providing traders, economists, and policymakers with valuable insights for informed decision-making and risk management.
Disclaimer: This indicator and accompanying analysis are for informational purposes only and should not be construed as financial advice. Users are encouraged to conduct their own research and consult with professional advisors before making investment decisions.

Odd_mod Econ CalendarA modification of Economic Calendar Events: FOMC, CPI, and more written by jdehorty . Please send all tips his way as he is maintaining the underlying data for the Calendar and the original concept.
List of changes:
Optimized code, will only run once on initialization now(No random line in middle of screen on bar change)
Legend - Added short names
Legend - Removed header
Legend - Made repositionable with selectable top margins
Legend - Removed data name from legend when it is disabled
Legend - Removed border
Original Description by jdehorty :
This script plots major events from the Economic Calendar that often correspond to major pivot points in various markets. It also includes built-in logic to retroactively adjust larger time intervals (i.e. greater than 1 hour) to be correctly aligned with the interval during which the event occurred.
Events are taken from the Economic Calendar and will be updated periodically at the following library:
EconomicCalendar
The above library can be used to conveniently access date-related data for major Meetings, Releases, and Announcements as integer arrays, which can be used in other indicators. Currently, it has support for the following events:
FOMC Meetings
The FOMC meets eight times a year to determine the course of monetary policy . The FOMC's decisions are based on a review of economic and financial developments and its assessment of the likely effects of these developments on the economic outlook.
FOMC Minutes
The FOMC minutes are released three weeks after each FOMC meeting. The minutes provide a detailed account of the FOMC's discussion of economic and financial developments and its assessment of the likely effects of these developments on the economic outlook.
Producer Price Index (PPI) Releases
The Producer Price Index (PPI) measures changes in the price level of goods and services sold by domestic producers. The PPI is a weighted average of prices of a basket of goods and services, such as transportation, food, and medical care. PPI is a leading indicator of CPI .
Consumer Price Index ( CPI ) Releases
The Consumer Price Index ( CPI ) measures changes in the price level of goods and services purchased by households. The CPI is a weighted average of prices of a basket of consumer goods and services, such as transportation, food, and medical care. CPI is one of the most widely used measures of inflation .
Consumer Sentiment Index ( CSI ) Releases
The University of Michigan's Consumer Sentiment Index ( CSI ) is a measure of consumer attitudes about the economy. The CSI is based on a monthly survey of U.S. households and reflects the consumers' assessment of present and future economic conditions. The CSI is a leading indicator of consumer spending, which accounts for about two-thirds of U.S. economic activity.
Consumer Confidence Index ( CCI ) Releases
The Consumer Confidence Index is a survey that measures how optimistic or pessimistic consumers are regarding their expected financial situation.
Non-Farm Payroll (NFP) Releases
The Non-Farm Payroll (NFP) is a measure of the change in the number of employed persons, excluding farm workers and government employees. The NFP is a leading indicator of consumer spending, which accounts for about two-thirds of U.S. economic activity.
EconomicCalendarLibrary "EconomicCalendar"
This library is a data provider for important dates and times from the Economic Calendar.
events()
Returns the list of dates supported by this library as a string array.
Returns: array : Names of events supported by this library
fomcMeetings()
Gets the FOMC Meeting Dates. The FOMC meets eight times a year to determine the course of monetary policy. The FOMC announces its decision on the federal funds rate at the conclusion of each meeting and also issues a statement that provides information on the economic outlook and the Committee's assessment of the risks to the outlook.
Returns: array : FOMC Meeting Dates as timestamps
fomcMinutes()
Gets the FOMC Meeting Minutes Dates. The FOMC Minutes are released three weeks after each FOMC meeting. The Minutes provide information on the Committee's deliberations and decisions at the meeting.
Returns: array : FOMC Meeting Minutes Dates as timestamps
ppiReleases()
Gets the Producer Price Index (PPI) Dates. The Producer Price Index (PPI) measures the average change over time in the selling prices received by domestic producers for their output. The PPI is a leading indicator of CPI, and CPI is a leading indicator of inflation.
Returns: array : PPI Dates as timestamps
cpiReleases()
Gets the Consumer Price Index (CPI) Rekease Dates. The Consumer Price Index (CPI) measures changes in the price level of a market basket of consumer goods and services purchased by households. The CPI is a leading indicator of inflation.
Returns: array : CPI Dates as timestamps
csiReleases()
Gets the CSI release dates. The Consumer Sentiment Index (CSI) is a survey of consumer attitudes about the economy and their personal finances. The CSI is a leading indicator of consumer spending.
Returns: array : CSI Dates as timestamps
cciReleases()
Gets the CCI release dates. The Conference Board's Consumer Confidence Index (CCI) is a survey of consumer attitudes about the economy and their personal finances. The CCI is a leading indicator of consumer spending.
Returns: array : CCI Dates as timestamps
nfpReleases()
Gets the NFP release dates. Nonfarm payrolls is an employment report released monthly by the Bureau of Labor Statistics (BLS) that measures the change in the number of employed people in the United States.
Returns: array : NFP Dates as timestamps

Economic Event DatesThis TradingView indicator ("Economic Event Dates") plots significant economic event dates directly on your chart, helping you stay informed about potential market-moving announcements. It includes pre-configured dates for:
* **FOMC Meetings:** Key policy meetings of the Federal Open Market Committee.
* **CPI Releases:** Consumer Price Index data releases, a key measure of inflation.
* **Bitcoin Halvings:** Programmatic reductions in Bitcoin's new supply issuance.
**Features:**
* **Customizable Dates:** Easily input and manage dates for FOMC, CPI, and Halving events for current and future years (2025, 2026, and beyond for Halvings).
* **Visual Cues:** Displays vertical lines on the chart at the precise time of each event.
* **Event Labels:** Shows clear labels (e.g., "FOMC", "CPI", "Halving") for each event line.
* **Color Coding:** Distinct colors for FOMC (blue), CPI (orange), and Halving (purple) events for quick identification.
* **Future Events Focus:** Option to display only upcoming events relative to the current real time.
* **Morning Alerts:** (Optional) Triggers an alert on the morning of a scheduled event, providing a timely reminder.
* **Customizable Appearance:** Adjust line width and toggle label visibility.
**How to Use:**
1. Add the indicator to your TradingView chart.
2. Review and update the input dates for FOMC, CPI, and Halving events in the indicator settings. The script includes placeholders and notes for future dates that may require verification from official sources (e.g., federalreserve.gov, bls.gov).
3. Customize colors, line width, label visibility, and alert preferences as needed.
4. Observe the vertical lines on your chart indicating upcoming economic events.
This tool is designed for traders and investors who want to incorporate awareness of major economic events into their market analysis. Remember to verify future event dates as they are officially announced.
Created by YouNesta
The Investment Clock Orbital GraphThe Investment Clock Orbital Graph is an advanced visualization tool designed to help traders and investors track economic cycles using a dynamic scatter plot of GDP growth vs. CPI inflation rates.
This indicator is a fusion of two powerful TradingView indicators:
LuxAlgo ’s Relative Strength Scatter Plot – A robust scatter plot for tracking relative strength.
The Investment Clock Indicator – A cycle-based approach to market rotation. This indicator contains more information regarding The Investment Clock.
By combining these approaches, the Investment Clock Orbital Graph enables traders to visualize economic momentum and inflationary trends in a unique, orbital-style scatter plot.
Key Features & Improvements
Orbital Graph Representation – Displays GDP growth and CPI inflation as a dynamic, evolving scatter plot, showing how the economy moves through different phases.
Quadrant-Based Market Regimes – Identifies four key economic phases:
1)🔥 Overheating (High Growth, High Inflation)
2)📉 Stagflation (Low Growth, High Inflation)
3)🤒 Recovery (High Growth, Low Inflation)
4)🎈 Reflation (Low Growth, Low Inflation)
Data-Driven Analysis – Utilizes FRED (Federal Reserve Economic Data) for accurate real-world GDP & CPI data.
Trailing Path of Economic Evolution – Tracks historical economic cycles over time to show momentum and cyclical movements.
Customizable Parameters – Set sustainable GDP growth and inflation thresholds, adjust trail length, and fine-tune scatter plot resolution.
Auto-Labeled Quadrants & Revised Accurate Market Guidance – Each quadrant includes newly updated tooltips and annotations (like ETF suggestions) to help traders make informed decisions.
Live Macro Forecasting Tool – Helps traders anticipate future market conditions, rate hikes/cuts, and sector rotations.
How to Use for Trading Decisions
The Investment Clock Orbital Graph helps traders and macro investors by identifying market phases and providing insights into asset class performance during different economic conditions.
📌 Step 1: Identify the Current Quadrant
Locate the most recent point on the orbital graph to see if the economy is in Overheating, Stagflation, Recovery, or Reflation.
📌 Step 2: Forecast Market Trends
The trajectory of the points can predict upcoming economic shifts:
Overheating → Stagflation ➡️ Expect economic slowdowns, bearish stock markets.
Stagflation → Reflation ➡️ Interest rate cuts likely, bonds and defensive stocks perform well.
Reflation → Recovery ➡️ Risk-on rally, technology and cyclicals perform best.
Recovery → Overheating ➡️ Commodities surge, inflation rises, and central banks intervene.
📌 Step 3: Align Trading & Investing Strategies
🔥 Overheating – Favor commodities & energy (Oil, Industrial Stocks, Materials).
📉 Stagflation – Favor defensive assets (Cash, Utilities, Healthcare).
🤒 Recovery – Favor growth stocks (Technology, Consumer Discretionary).
🎈 Reflation – Favor bonds, value stocks, and financials.
📌 Step 4: Monitor Trends Over Time
The indicator visualizes economic movement over multiple months, allowing traders to confirm long-term trends vs. short-term noise.
The Investment Clock Orbital Graph is an essential macro trading tool, providing a real-time visualization of economic conditions. By tracking GDP growth vs. CPI inflation, traders and investors can align their portfolios with major macroeconomic shifts, predict sector rotations, and anticipate central bank policy changes.

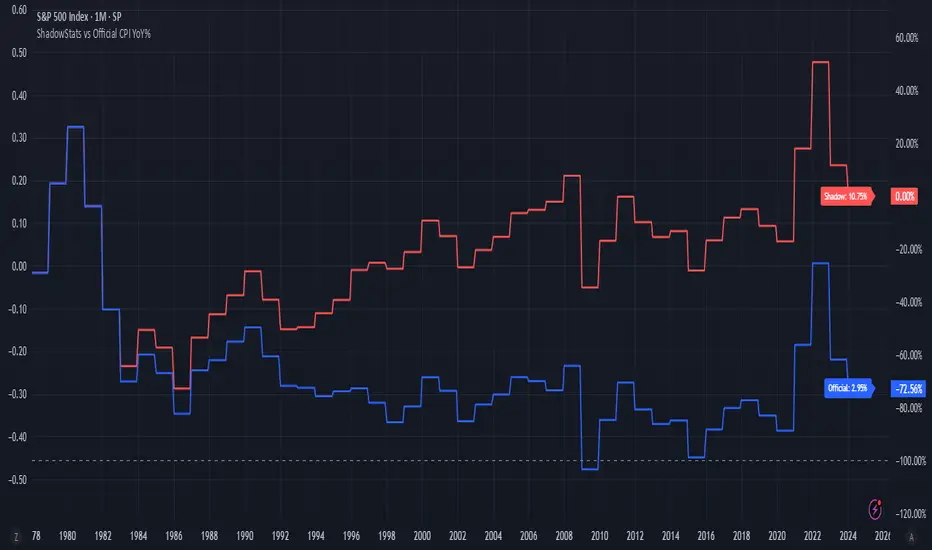
ShadowStats vs Official CPI YoY%This chart visualizes and compares the year-over-year (YoY) percentage change in the Consumer Price Index (CPI) as calculated by the U.S. government versus the alternative methodology used by ShadowStats, which reflects pre-1980 inflation measurement techniques. The red line represents ShadowStats' CPI YoY% estimates, while the blue line shows the official CPI YoY% reported by government sources. This side-by-side view highlights the divergence in reported inflation rates over time, particularly from the 1980s onward, offering a visual representation of how different calculation methods can lead to vastly different interpretations of inflation and purchasing power loss.
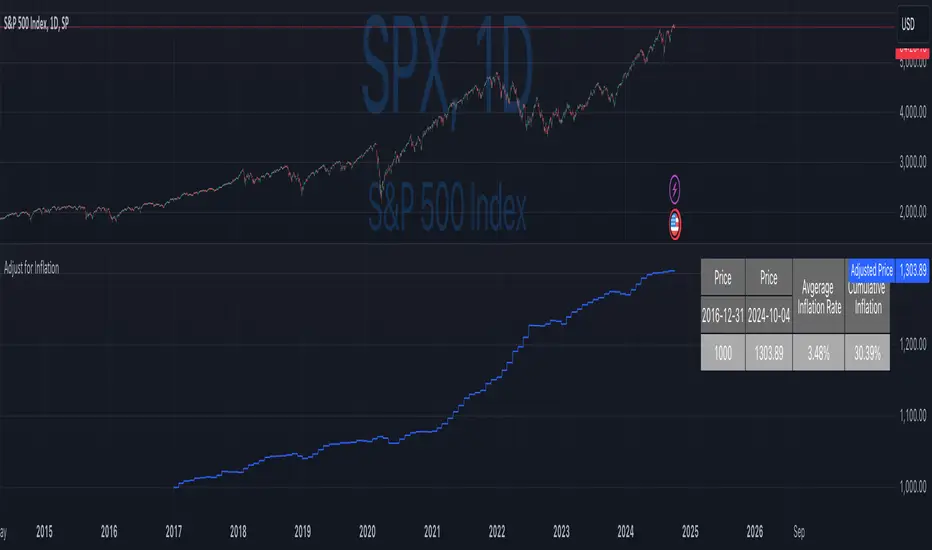
Inflation-Adjusted Price IndicatorThis indicator allows traders to adjust historical prices for inflation using customizable CPI data. The script computes the adjusted price by selecting a reference date, the original price, and the CPI source (US CPI or custom input) and plots it as a line on the chart. Additionally, a table summarizes the adjusted price values and average and total inflation rates.
While the indicator serves as a standalone tool to understand inflation's impact on prices, it is a supportive element in more advanced trading strategies requiring accurate analysis of inflation-adjusted data.
Disclaimer
Please remember that past performance may not be indicative of future results.
Due to various factors, including changing market conditions, the strategy may no longer perform as well as in historical backtesting.
This post and the script don’t provide any financial advice.
US Market Real Value Adjusted for CPI and Dollar IndexUS Market Real Value Adjusted for CPI and Dollar Index
Provides quick access to this formula: (SP:SPX+NASDAQ_DLY:IXIC+TVC:DJI+CAPITALCOM:RTY)/4/(ECONOMICS:USCPI*TVC:DXY*100)
Overview:
This indicator provides a dynamic view of the US stock market's real value, adjusted for inflation and currency strength. It combines major stock indices including the S&P 500, NASDAQ, Dow Jones, and Russell 2000, and adjusts the composite index using the US Consumer Price Index (CPI) and the US Dollar Index (DXY). This adjustment helps to reveal the true market performance, stripped of inflationary effects and currency valuation changes.
Key Features:
Composite Index Calculation: Averages the prices of SPX, IXIC, DJI, and RTY to create a broad market overview.
Inflation Adjustment: Uses the CPI to adjust for the effects of inflation, ensuring that the real value changes in the stock market are highlighted.
Currency Strength Adjustment: Applies the DXY to account for fluctuations in the strength of the US dollar, providing insights into how currency variations impact market valuation.
Dynamic Base Calculation: Utilizes a rolling window to dynamically update base values, allowing for continuous reassessment of the market’s adjusted value as new data becomes available.
This indicator provides:
Real Value Insights: By adjusting for both inflation and currency strength, this indicator offers a more accurate measure of the underlying market conditions.
Dynamic Updates: With a rolling window approach, the indicator continually adapts, providing up-to-date information.
Strategic Decisions: Helps in identifying true market growth or decline periods, aiding in strategic investment planning.
Usage:
To use this indicator, simply add it to your chart, and it will automatically display the adjusted composite index. This index can be particularly useful for investors looking to understand underlying market trends beyond nominal price movements, helping in making more informed investment decisions when comparing certain tickers to an average of the major US stock market indexes, adjusted for inflation and the strength of the US dollar.
Example Use Case:
A typical use case might involve comparing periods of high inflation to see how the overall US stock market performed in real terms, not just nominal terms. This can indicate whether the market growth was genuine or merely a reflection of inflation. By comparing this result to an average of these major indexes without adjusting for inflation or currency strength changes, you can see how significantly these forces can impact real gains or losses.

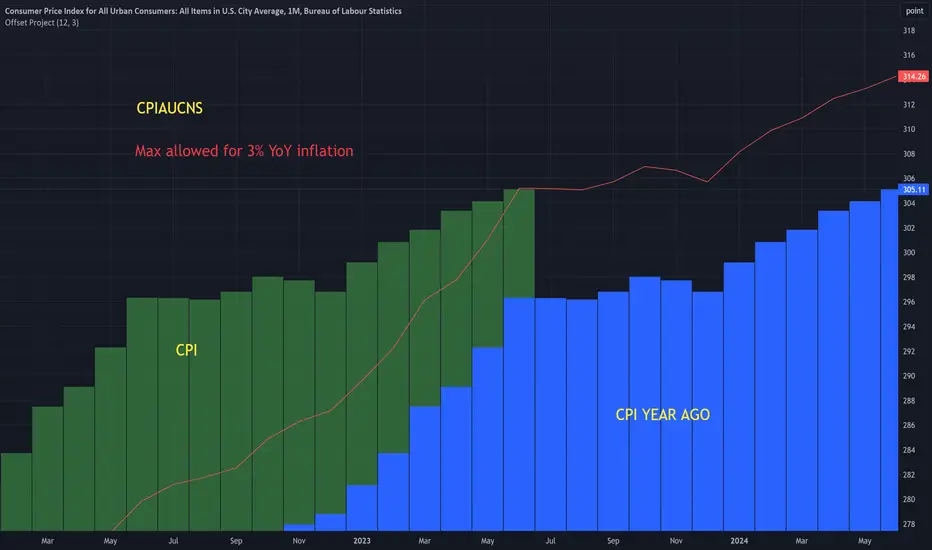
Offset ProjectIntended for use with CPI symbols like:
CPIAUCNS (all items)
CPILFENS (core)
Shows the CPI values from a year ago, next to the current values. This makes it easier to visualize the base effects .
Has a ' max inflation rate ' parameter. This is shown as a red line. So for example, if it's set to 3, then CPI must stay below the red line in in order for the inflation rate to stay below 3.
Real Interest Rate DifferentialThe Real IRD is a simple indicator built for forex trades that need a long-term view and want to compare currencies in search of high yield. The indicated interest rate maturity is 2 years, since shorter maturities may not price central banks' monetary policy decisions.
Example:
- You need to do an analysis of the AUDUSD
- In the Interest Rate 1 field, we put the interest rate for the base currency, in this case the AUD
- In the Interest Rate 2 field, the interest rate of the other currency, in this case the USD
- In the CPI 1 field, inflation referring to base currency
- In the CPI 2 field, inflation for another currency
CPI Codes:
QUANDL:RATEINF/INFLATION_USA < USD
QUANDL:RATEINF/INFLATION_EUR < EUR
QUANDL:RATEINF/INFLATION_JPN < JPY
QUANDL:RATEINF/INFLATION_CHE < CHF
QUANDL:RATEINF/INFLATION_GBR < GBP
QUANDL:RATEINF/INFLATION_CAN < CAD
QUANDL:RATEINF/INFLATION_RUS < RUB
QUANDL:RATEINF/INFLATION_AUS < AUD
QUANDL:RATEINF/INFLATION_NZL < NZD

4EMAs+OpenHrs+FOMC+CPIThis script displays 4 custom EMAs of your choice based on the Pine script standard ema function.
Additionally the following events are shown
1. Opening hours for New York Stock exchange
2. Opening Time for London Stock exchange
3. US CPI Release Dates
4. FOMC press conference dates
5. FOMC meeting minutes release dates
I have currently added FOMC and CPI Dates for 2025 but will keep updating in January of every year (at least as long as I stay in the game :D)
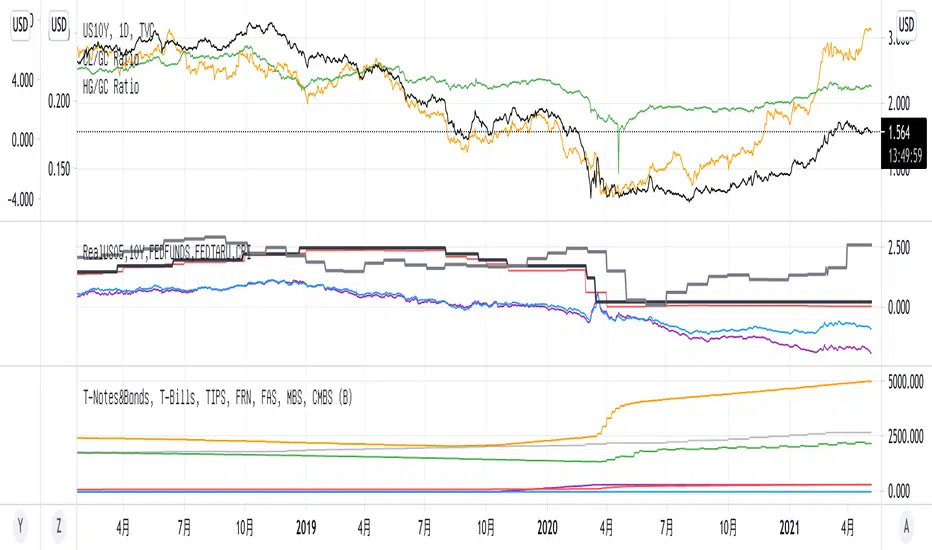
Gov Bonds Real Rates 10/05Y, FED RATEs, CPIGov Bonds Real Rates 10/05Y, FED RATEs, CPI。美国经济数据10年债和5年债实际收益率,美国目标利率和实际利率,CPI消费者物价指数
Quantity Theory of Money (Inflation Growth Rate)Quantity Theory of Money ( Inflation Growth Rate)
Equation:
%ΔM+%ΔV=%ΔP+%ΔY
M - Money Supply , V - Money Velocity , Y - Real GDP, P - Price
This script only takes into account money supply theory and does not account for increases/decreases in inflation due to energy costs. QTM Calculation is compared to USIRYY , USCCPI , and Sticky Price CPI . Flex_CPI and Flex_Core_CPI are not available in Trading View for comparison.
Simple Moving Average Default it set to 3 quarters for smoothing purposes. You can change this via the input window as you see fit.

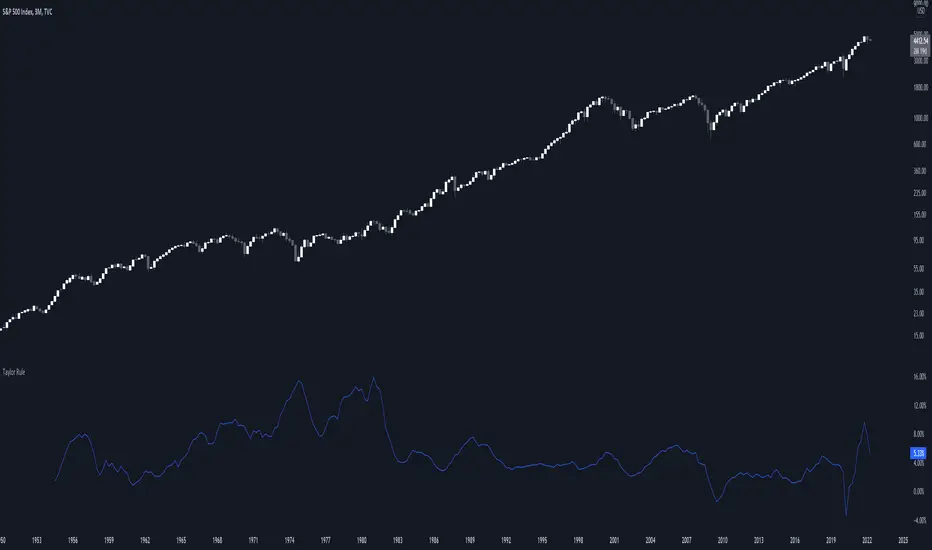
Taylor RuleThe Taylor rule is a simple formula that John Taylor devised to guide policymakers. It calculates what the federal funds rate should be, as a function of the output gap and current inflation. Here, we measure the output gap as the difference between potential output and real GDP. Inflation is measured by changes in the CPI, and we use a target inflation rate of 2%. We also assume a steady-state real interest rate of 2%.
US Inflation Rate [nb]This is the United States inflation rate, based on the total Consumer Price Index published by the U.S. Bureau of Labor Statistics.
Option to toggle:
A line to display the inflation rate in December. It does not change until the next December.
What the color change to red is indicative of:
According to the Federal Open Market Committee (FOMC) regarding inflation rate, "2% is a bae number to be around". This does not imply a strict 2% inflation for success and allows room for federal rate cuts should they be needed.
Although FOMC declared 2% to be "bae" in 2012, James Bullard, of federal banking fame, claims that started to become the norm in 1995. Therefore the inflation rate line will only turn red 1995 onwards, and serves as a friendly reminder that inflation has been over at or over 2% for more than one month.
Sources:
www.bls.gov
www.federalreserve.gov
www.stlouisfed.org

PPI Inflation Monitor (Change YoY & MoM)📊 PPI Inflation Monitor - Leading Inflation Indicator
The Producer Price Index (PPI) measures wholesale/producer-level prices and serves as a critical leading indicator for consumer inflation trends. This tool helps you anticipate CPI movements and identify corporate margin pressures before they show up in earnings.
🎯 KEY FEATURES:
- Dual Perspective Analysis:
- Year-over-Year (YoY): Histogram bars showing annual producer price inflation
- Month-over-Month (MoM): Line overlay showing monthly wholesale price changes
- Visual Reference System:
- Dashed line at 2% (typical target for producer price inflation)
- Dotted line at 0.17% (equivalent monthly target)
- Color-coded bars: Red above target, Green below target
- Real-Time Data Table:
- Current PPI Index value
- YoY inflation rate with color coding
- MoM inflation rate with color coding
- Deviation from target level
- Automated Alerts:
- YoY crosses above/below target
- MoM crosses above/below target
- Early warning system for inflation trends
📈 WHY PPI IS YOUR EARLY WARNING SYSTEM:
PPI typically leads CPI by 1-3 months because:
- Producers face cost increases first
- These costs are eventually passed to consumers
- Shows whether companies can maintain pricing power
Rising PPI with stable CPI = Margin compression → Bearish for stocks
Rising PPI followed by rising CPI = Broad inflation → Fed hawkishness incoming
Falling PPI = Disinflationary trend starting → Positive for risk assets
🔍 TRADING APPLICATIONS:
1. Lead Time Advantage: Position before CPI confirms PPI trends
2. Sector Rotation: High PPI = favor companies with pricing power
3. Margin Analysis: PPI-CPI divergence = margin pressure/expansion signals
4. Fed Anticipation: PPI acceleration = Fed likely to turn hawkish soon
💡 STRATEGIC USE CASES:
- Value vs. Growth: Rising PPI favors value stocks with pricing power
- Commodities: PPI often correlates with commodity price trends
- Small Caps: More vulnerable to input cost increases (high PPI = cautious)
- Corporate Earnings: Anticipate margin pressure before quarterly reports
🔄 COMBINE WITH:
- CPI: Confirm if producer costs reach consumers
- PCE: Validate Fed's preferred inflation metric response
- Fed Funds Rate: Assess if Fed is behind/ahead of curve
📊 DATA SOURCE:
Official PPI data from FRED (Federal Reserve Economic Data), updated monthly when new data releases occur.
🎨 CUSTOMIZATION:
Fully customizable:
- Toggle YoY/MoM displays
- Adjust reference target levels
- Customize colors
- Show/hide absolute PPI values
Perfect for: Macro traders, fundamental analysts, earnings traders, and investors seeking early inflation signals before they appear in consumer prices.
⚡ Remember: PPI leads CPI. Use this advantage to position ahead of the crowd.

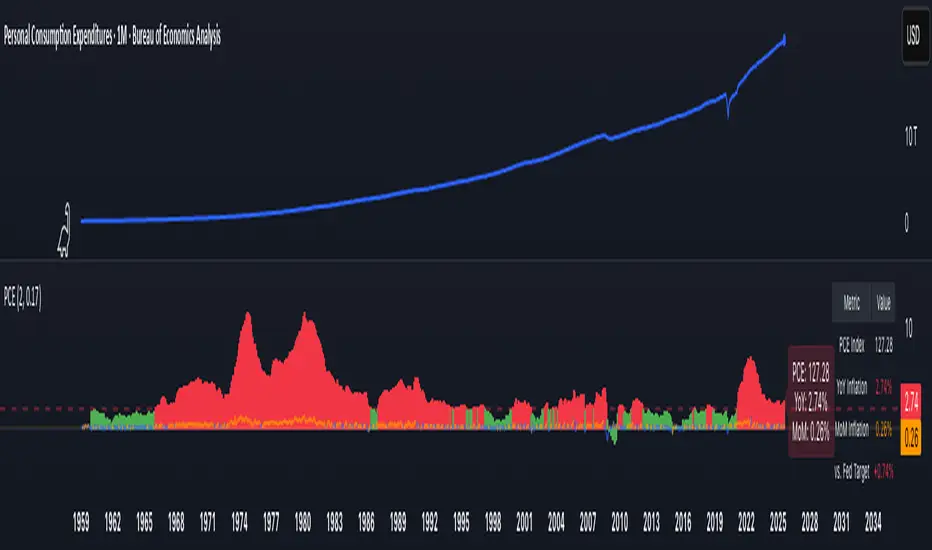
PCE Inflation Monitor (Change YoY & MoM)📊 PCE Inflation Monitor - The Fed's Most Important Metric
Personal Consumption Expenditures (PCE) is the Federal Reserve's preferred inflation measure and THE metric they target for their 2% inflation goal. If you want to predict Fed policy, you need to watch PCE.
🎯 KEY FEATURES:
- Dual Perspective Analysis:
- Year-over-Year (YoY): Histogram bars showing annual PCE inflation
- Month-over-Month (MoM): Line overlay showing monthly consumption price changes
- Visual Reference System:
- Dashed line at 2% (Fed's official PCE inflation target)
- Dotted line at 0.17% (equivalent monthly target)
- Color-coded bars: Red above Fed target, Green below target
- Real-Time Data Table:
- Current PCE Index value
- YoY inflation rate vs. Fed's 2% target
- MoM inflation rate with color coding
- Exact deviation from Fed target (critical for policy predictions)
- Automated Alerts:
- PCE crosses Fed's 2% target (major policy signal!)
- MoM crosses monthly target
- Stay informed of Fed-relevant inflation changes
📈 WHY PCE IS DIFFERENT (AND MORE IMPORTANT):
PCE vs. CPI differences:
- Flexible basket: PCE adjusts for substitution (beef → chicken if prices rise)
- Broader coverage: Includes healthcare paid by insurance/government
- Lower readings: Typically 0.2-0.4% below CPI
- Fed's choice: Explicitly stated as their target metric
Most importantly: When Powell speaks about "our 2% target," he means PCE, not CPI!
🔍 TRADING IMPLICATIONS:
PCE Above 2% (Red Zone):
→ Fed under pressure to maintain/raise rates
→ Hawkish policy stance likely
→ Negative for growth stocks, crypto
→ Positive for USD, bearish for gold
PCE Below 2% (Green Zone):
→ Fed has flexibility to cut rates
→ Dovish policy stance possible
→ Positive for risk assets, growth stocks
→ Negative for USD, bullish for commodities
PCE Approaching 2% from Above:
→ Fed "mission accomplished" narrative
→ Rate cut cycle becomes possible
→ Major bullish signal for equities/crypto
💡 ADVANCED STRATEGIES:
1. Fed Meeting Preparation: Check PCE before FOMC meetings for policy clues
2. Dot Plot Predictions: PCE trend determines Fed's rate forecast updates
3. Pivot Timing: When PCE MoM turns negative, Fed pivot becomes realistic
4. Press Conference Analysis: Compare Powell's comments to PCE deviation
🎯 KEY LEVELS TO WATCH:
- 2.0% YoY: Fed's official target - crossing this level is major news
- 2.5% YoY: "Uncomfortably high" - Fed forced to stay restrictive
- 3.0% YoY: "Crisis mode" - Fed turns very hawkish
- 1.5% YoY: "Below target" - Rate cuts become likely
🔄 COMBINE WITH:
- CPI: Public perception vs. Fed's metric (often diverge)
- Core PCE: Even more important (excludes food/energy volatility)
- Fed Funds Rate: Is Fed responding appropriately to PCE?
📊 DATA SOURCE:
Official PCE data from FRED (Federal Reserve Economic Data), updated monthly typically in the last week of each month (after CPI/PPI releases).
🎨 CUSTOMIZATION:
Fully customizable:
- Toggle YoY/MoM displays
- Adjust Fed target if needed
- Customize colors
- Show/hide absolute PCE values
Perfect for: Fed watchers, macro traders, policy analysts, and serious investors who want to predict monetary policy changes before they happen.
⚠️ CRITICAL INSIGHT: While media focuses on CPI, the Fed focuses on PCE. Trade what the Fed trades, not what the headlines say.
🎓 Pro Tip: Fed members often mention "Core PCE" (excluding food/energy). Consider adding that indicator alongside this one for complete Fed policy analysis.