15-Minute ORB (Opening Range Breakout) —BBC-Ninja15-Minute ORB (Opening Range Breakout) —BBC-Ninja
15 min orb indicator for nasdaq with daylight saving
Cari dalam skrip untuk "股票开盘前15分钟交易规则"

15-Minute and 60-Minute ORB with Wicks15 and 60 minute ORBs for each trading day. Simple, yet effective.


15-Minute ORB by @RhinoTradezOverview
Hey traders, ready to jump on the morning breakout train? The 15-Minute ORB by @RhinoTradez
is your go-to pal for rocking the Opening Range Breakout (ORB) scene, zeroing in on the first 15 minutes of the U.S. market day—9:30 to 9:45 AM Eastern Time. Picture this: sleek orange lines mark the high and low of that opening rush, but they only hang out during regular trading hours (9:30 AM-4:00 PM ET) and reset fresh each day—no old baggage here! Built in Pine Script v6 for that cutting-edge feel, it’s loaded with breakout signals and alerts to keep your trading game strong—ideal for SPY, QQQ, or any ticker you love.
Crafted by @RhinoTradez
to fuel your daily grind—let’s hit those breakouts running!
What It Does
The ORB strategy is all about that early market spark: the 9:30-9:45 AM range sets the battlefield, and breakouts signal the charge. Here’s the rundown:
Captures the Range : Snags the high and low from the 9:30-9:45 AM ET candle—U.S. market kickoff, locked in.
Daily Refresh : Wipes yesterday’s lines at 9:30 AM ET each day—today’s all that matters.
Regular Hours Focus : Orange lines shine from 9:45 AM to 4:00 PM ET, vanishing outside those hours.
Breakout Signals : Green triangles for upside breaks, red for downside, all within regular hours.
Alerts You : Chimes in with “Price broke above 15-min ORB High: 597” (or below the low) when the move hits.
It’s your morning breakout blueprint—simple, focused, and trader-ready.
Functionality Breakdown:
15-Minute ORB Snap:
Locks the high and low of the 9:30-9:45 AM ET candle on a 15-minute chart (EST/EDT auto-adjusted).
Resets daily at 9:30 AM ET—yesterday’s range is outta here.
Regular Hours Only:
Lines glow from 9:45 AM to 4:00 PM ET, keeping pre-market and after-hours clean.
Breakout Flags:
Marks price busting above the ORB high (green triangle below bar) or below the low (red triangle above), only during 9:30 AM-4:00 PM.
Alert Action:
Drops a custom alert with the breakout price (e.g., “Price broke below 15-min ORB Low: 594”)—stay in the know, hands-free.
Customization Options
Keep it chill with one slick tweak:
ORB Line Color : Starts at orange—vibrant and trader-cool! Flip it to blue, purple, or any shade you dig in the settings. Make it yours.
How to Use It
Pop It On: Add it to a 15-minute chart—SPY, QQQ, or your hot pick works like a dream.
Time It Right: Set your chart to “America/New_York” time (Chart Settings > Time Zone) to sync with 9:30 AM ET.
Choose Your Color: Dive into the indicator settings and pick your ORB line color—orange kicks it off, but you’re in charge.
Set Alerts: Right-click the indicator, add an alert with “Any alert() function call,” and catch breakouts live.
Ride the Wave: Green triangle? Upward vibe. Red? Downside alert. Mix with volume or candles for extra punch.
Pro Tips
15-Minute Only : Tailored for that 9:30-9:45 AM ET candle—other timeframes won’t sync up.
Daily Reset : Lines refresh at 9:30 AM ET—always today’s play.
Breakout Boost : High volume or RSI can seal the deal on those triangle signals.
No Clutter : Lines stick to 9:30 AM-4:00 PM ET—your chart stays tidy.
Brought to you by @RhinoTradez
in Pine Script v6, this ORB script’s your morning breakout wingman. Slap it on, pick a color, and let’s chase those moves together! Happy trading!

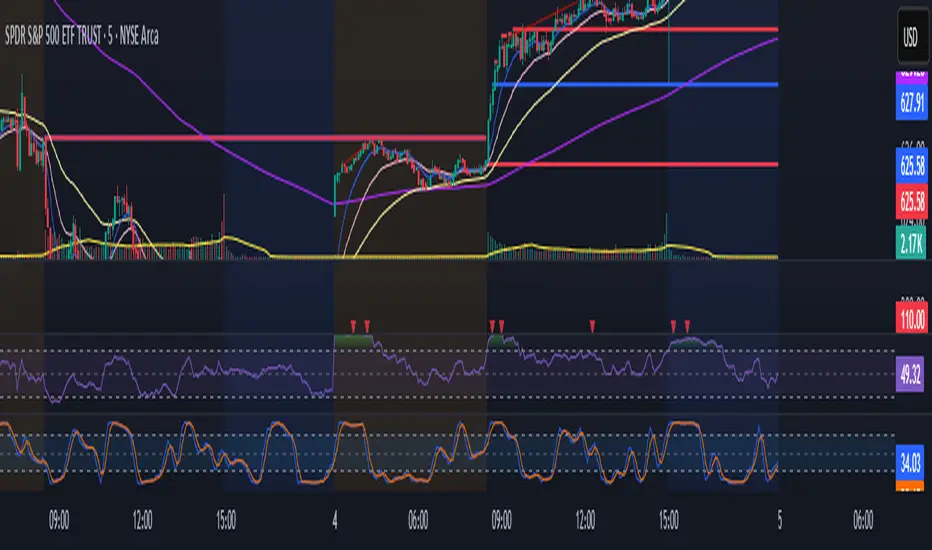
8:15 AM 15-min Candle Box on 5-min Chart with TP and SLThe “8:15 AM 15-min Candle Box on 5-min Chart with TP and SL” indicator is a custom-built Pine Script tool for breakout trading strategies, particularly tailored for assets like NASDAQ Futures (NAS100) during the U.S. market pre-open.
🔍 What It Does:
Tracks the 8:15–8:30 AM Central Time (CDT) Candle:
It marks the high and low of the 15-minute candle that starts at 8:15 AM (CDT).
The box visually outlines this price range.
Draws a Breakout Box:
At 8:30 AM, a box is drawn from the 8:15 candle’s high and low.
The box stretches forward 8 hours into the session, helping you visualize price interaction with that range.
Detects Breakouts:
If the price closes above the high, it signals a buy breakout.
If it closes below the low, it signals a sell breakout.
Automatically Calculates TP and SL:
Take Profit (TP): 50 pips from the breakout level in the direction of the trade.
Stop Loss (SL): 40 pips in the opposite direction.
Pips are calculated using the symbol’s minimum tick size.
Color Feedback:
Box turns green on a buy breakout, red on a sell breakout.
If TP is reached, the box turns black.
If SL is hit, the box turns purple.
🧠 Why Use This Indicator:
Perfect for pre-market breakout traders who want a visual confirmation of price action around the U.S. market open.
Provides a clear entry range, trade direction, and risk/reward visual cue.
No manual drawing — everything is automated daily based on reliable timing.
Would you like a version with alerts or plotted TP/SL lines as well?

15-Min ORB Indicator with Breakout Targets **What this indicator does:**
The 15-Min ORB (Opening Range Breakout) Indicator helps traders spot breakout trades by automatically detecting the high and low of the first 15 minutes after a session opens. It then monitors for breakouts above or below this range and plots dynamic take-profit levels based on your chosen multipliers.
**How it works:**
You set the start time for your session (hour and minute) in the settings.
The indicator marks the high and low during the first 15 minutes after your chosen open time, drawing lines on the chart and, if enabled, labels for these levels.
If price breaks above the 15-min high, a potential long breakout is identified; if it breaks below the low, a potential short breakout is detected.
Upon a breakout, the script calculates the distance from the entry (breakout) to the opposite side of the 15-min range and uses your input multipliers to project two take-profit levels (TP1/TP2).
All lines and labels (for the range and targets) can be individually toggled on or off in the settings.
Both the 15-min range and the targets can be styled (color, line style, label position).
**How to use it:**
Add the indicator to your chart.
Set the session start hour and minute to match your instrument’s open (e.g., 9:30 for US stocks or futures).
Use the settings to customize which levels and labels are shown, their appearance, and the target expansion multiples.
When price breaks out above or below the opening range, the script will plot TP1 and TP2 lines at your chosen risk/reward multiples, and label them if desired.
You can use the visual levels for trade entries, profit taking, or alerts.
**What makes it unique and useful:** >
Unlike many basic ORB indicators, this script not only marks the opening range but also tracks breakouts, auto-plots your profit targets based on range expansion, and gives you full control over display (styles, toggles, and label positions).
The TP targets are dynamic and can be set to any multiples, adapting to your risk/reward plan and breakout style.
Everything is customizable for your own session times, instrument, or trading approach.
**Typical uses:**
Intraday traders looking for clear breakout setups around the session open.
Automated R-multiple target planning for both long and short trades.
Visualizing volatility and measuring early price expansion.

9:15 Range with 0.09% BufferThis strategy is based on the first 9:15 AM candle for Nifty, which is considered a key reference point (also called the "GAN level entry"). It defines a range around the high and low of the 9:15 candle with a 0.09% buffer on both sides.
The upper buffer level acts as a potential resistance.
The lower buffer level acts as a potential support.
When the price crosses above the upper buffer, it signals a possible entry for a Call option (CE) or a long position.
When the price crosses below the lower buffer, it signals a possible entry for a Put option (PE) or a short position.
This approach helps traders identify early breakout opportunities based on the opening candle range, aiming to capture momentum moves in either direction during the trading session.

15-Min Opening Range Breakout STEP-BY-STEP RULES
1. Define the Opening Range (OR)
Mark the high and low of the first 15-minute candle of the session.
This creates your Opening Range.
Example: London session opens at 08:00 GMT. Use the 08:00–08:15 candle.
2. Set Entry Triggers
Buy Breakout: Place a Buy Stop order 1 pip above the Opening Range high.
Sell Breakout: Place a Sell Stop order 1 pip below the Opening Range low.
⚠️ Only one side should be triggered. Cancel the opposite order once one is active.
3. Set Stop Loss (SL)
For Buy trades:
SL = Opening Range Low - 2 pips
For Sell trades:
SL = Opening Range High + 2 pips
This ensures you give the price enough space, while keeping risk controlled.
4. Set Take Profit (TP)
Use either of these two approaches:
✅ Fixed Risk-Reward (Preferred)
Target 1: TP = 2R (i.e., 2 × SL distance)
Target 2 (optional): Leave runner for 3R or trail stop behind minor S/R
✅ Fixed Pip Target (alternative)
TP = +50 pips
SL = -20 pips
Matches your preferred risk model of 20 SL / 50 TP
5. Trade Management
If no breakout occurs within 1 hour, cancel the pending orders. No trade that day.
If trade triggers but fails to move, consider time-based exit after 2 hours.
Optional: Move SL to breakeven once price moves 1R in your favor.

15-Min EMA CrossoverVery useful swing setup indicator that can be used in different styles of trading
Works on any timeframe but calculates EMA and cross signals based on 15-minute candles.
Plots the EMA line.
Shows green triangle for bullish crossover and red triangle for bearish crossunder.

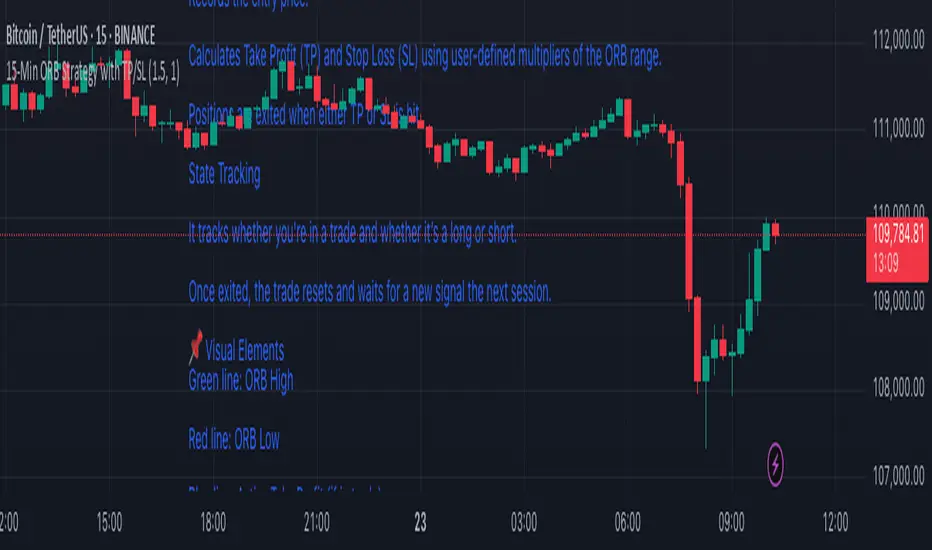
15-Min ORB Strategy with TP/SL
🔧 How It Works
Opening Range Defined
At market open, it tracks the first 15-minute candle.
The high and low of that candle form the Opening Range.
Breakout Detection
A Buy Signal is triggered when price closes above the ORB high (with confirmation).
A Sell Signal is triggered when price closes below the ORB low.
Trade Management
On a confirmed breakout, the script:
Records the entry price.
Calculates Take Profit (TP) and Stop Loss (SL) using user-defined multipliers of the ORB range.
Positions are exited when either TP or SL is hit.
State Tracking
It tracks whether you're in a trade and whether it’s a long or short.
Once exited, the trade resets and waits for a new signal the next session.
📌 Visual Elements
Green line: ORB High
Red line: ORB Low
Blue line: Active Take Profit (if in trade)
Orange line: Active Stop Loss (if in trade)
Buy/Sell Labels: Signal markers below/above candles for clear entry visibility
⚙️ Customizable Inputs
Take Profit Multiplier (default 1.5× ORB range)
Stop Loss Multiplier (default 1.0× ORB range)
Session Start/End time for ORB definition
✅ Ideal For:
Traders who want clean, rule-based signals with no indicators
Quick intraday setups using price action only
Adaptation to almost any liquid market (just adjust session times)
9:15 AM middle price #rangeofstinoThis indicator will show the middle price of the first one-minute candle of BankNifty at 9:15 AM for every day.

15-60min closuresthis script charts two different informations :
15min close as a step line
60min close as dots that are overlayed on the stepline
this is most useful on timeframes that are less than or equal 15 min
15 min systemThis is experimental model for 15 min chart .
first is upper and lower border in gray =upper or resistance line
black line = support line
this similar in concept to darvas box but I use instead open and close instead high and low
next is open close high and low candels in red and lime to see the opening and closure with color to direction of the trade
you can change the TF and res to anything else if you want to work with this system on different time frame
So it easy system to find where the support and resistance exist and what is the direction of trade

15-5 Günlük Giriş ÇıkışHer türlü piyasa verisinde 15-5 günlük grafik dilimlerinde kullanılır.
Her yeşil "+" pozisyon değişikliğine işaret eder.
Yeşil "+" dan sonra gelecek olan ilk sarı "+" pozisyondan çıkış sinyali olarak deerlendirilir.
Bir sonraki yeşil "+" gelene kadar işlem açılmaz.
DİKKAT!!
Bu indikatör sabit veriler üzerinde fiyat hareketleri canlı değilken oluşturulmuştur.
Bu indikatöre bağımlı işlem yapmak portföyünüze ciddi zararlar verebilir.

First 15-Min Candle Detector [With Breakout Alerts]Indicator: First 15-Minute Candle Detector
Purpose
This indicator helps traders by identifying and marking the high, low, and mid-point of the first 15-minute candle of the market session. It also provides visual aids and alerts for price breakouts above or below these levels, making it ideal for intraday trading strategies.
This script is suitable for traders focusing on early session momentum or reversal strategies.
Key Features
Market Start Customization: Configure the market start time (hour and minute) to align with your trading session or exchange timezone.
Visual Aids:
Horizontal lines to mark the High , Low , and Mid-point of the first 15-minute candle.
Background highlighting to identify the first 15-minute candle.
Configurable colors and line widths for clear visuals.
Breakout Alerts:
Real-time alerts for breakouts above the high or below the low of the first 15-minute candle.
Customizable alert messages.
Alerts configured using alertcondition .
Dynamic Adjustments:
Adapts dynamically to timeframes of 15 minutes or lower.
Resets and recalculates at the start of each new session.
Inputs and Configurations
Market Settings:
Market Start Hour: Default is 9.
Market Start Minute: Default is 30.
Visual Settings:
Enable/disable background highlighting.
Set colors for the background, high line, low line, and mid-line.
Adjust line width (1 to 5).
Toggle the visibility of the mid-line.
Alert Settings:
Enable breakout alerts.
Set custom alert messages for high and low breakouts.
How It Works
// First 15-Minute Candle Detection
The indicator monitors the first 15-minute candle after the market opens based on the configured start time. It records the high , low , and calculates the mid-point of this candle.
// Visual Markings
Horizontal lines are drawn at the high, low, and mid-point of the first 15-minute candle, extending to the right for the rest of the session.
// Breakout Detection
The indicator checks for price breakouts above the high or below the low of the first 15-minute candle and triggers alerts if enabled.
// Dynamic Reset
The indicator resets values and deletes previous session lines at the start of each new session.
Conditions and Alerts
Breakout Conditions:
High Breakout: The closing price exceeds the high of the first 15-minute candle.
Low Breakout: The closing price falls below the low of the first 15-minute candle.
Alert Triggers: Configurable alerts notify you of breakouts in real-time.
Use Cases
Intraday Traders: Ideal for early-session momentum or reversal strategies.
Breakout Traders: Helps identify entry points when price breaks key levels.
Visual Clarity: Simplifies tracking important session levels.
Limitations
Works only on 15-minute or lower timeframes.
Requires accurate market start time configuration.

Gold Opening 15-Min ORB INDICATOR by AdéThis indicator is designed for trading Gold (XAUUSD) during the first 15 minutes of major market openings: Asian, European, and US sessions. It highlights these key time windows, plots the high and low ranges of each session, and generates breakout-based buy/sell signals. Ideal for traders focusing on volatility at market opens.
Features:Session Windows:
Asian: 1:00–1:15 AM Barcelona time (23:00–23:15 UTC, CEST-adjusted).
European: 9:00–9:15 AM Barcelona time (07:00–07:15 UTC).
US: 3:30–3:45 PM Barcelona time (13:30–13:45 UTC).
Marked with yellow (Asian), green (Europe), and blue (US) triangles below bars.
High/Low Ranges:Plots horizontal lines showing the highest high and lowest low of each session’s first 15 minutes.Lines appear after each session ends and persist until the next day, color-coded to match the sessions.Breakout Signals:Buy (Long): Triggers when the closing price breaks above the highest high of the previous 5 bars during a session window (lime triangle above bar).Sell (Short): Triggers when the closing price breaks below the lowest low of the previous 5 bars during a session window (red triangle below bar).
Signals are restricted to the 15-minute session periods for focused trading.Usage:Timeframe: Optimized for 1-minute XAUUSD charts.Timezone: Set your chart to UTC for accurate session timing (script uses UTC internally, based on Barcelona CEST, UTC+2 in April).Strategy:
Use buy/sell signals for breakout trades during volatile market opens, with session ranges as support/resistance levels.Customization: Adjust the lookback variable (default: 5) to tweak signal sensitivity.Notes:Tested for April 2025 (CEST, UTC+2).
Adjust timestamp values if using outside daylight saving time (CET, UTC+1) or for different broker timezones.Best for scalping or short-term trades during high-volatility periods. Combine with other indicators for confirmation if desired.How to Use:Apply to a 1-minute XAUUSD chart.Watch for session markers (triangles) and breakout signals during the 15-minute windows.Use the high/low lines to gauge potential breakout targets or reversals.

TEMA Ribbon 9/13/15/21 – Smooth trend shifts, less lag, clearer“TEMA Ribbon 9/13/15/21 – Smooth trend shifts, less lag, clearer bias.”
Plots four Triple Exponential Moving Averages (9, 13, 15, 21) with shaded zones for quick trend visualization. Helps identify short- vs. medium-term momentum shifts with reduced lag compared to standard EMAs.
Recommended Usage:
Best applied on 5M–1H intraday charts for momentum and trend confirmation.
Use the 9 & 13 TEMA for short-term momentum shifts.
Use the 15 & 21 TEMA for medium-term bias.
Look for crossovers and alignment (all fast TEMAs above/below slow ones) to confirm bullish or bearish conditions.
Shaded zones help visualize when the short- and medium-term trends converge or diverge, signaling potential entry or exit points.
Combine the TEMA Ribbon with VWAP or session-based trading (e.g., London/New York Killzones) to filter signals.
Trade only in the direction of VWAP bias (price above VWAP → favor longs, below → favor shorts).
Within Killzones, use TEMA alignment (9/13 above 15/21 = bullish trend, or opposite for bearish) as confirmation before entries.
This reduces false signals and locks entries to periods of high liquidity and volatility, where TEMA shines.
//@version=5
indicator("TEMA 9/13/15/21", overlay=true)
// Quelle
src = close
// Funktion: TEMA
tema(src, length) =>
e1 = ta.ema(src, length)
e2 = ta.ema(e1, length)
e3 = ta.ema(e2, length)
3.0 * e1 - 3.0 * e2 + e3
// TEMA-Berechnung
t9 = tema(src, 9)
t13 = tema(src, 13)
t15 = tema(src, 15)
t21 = tema(src, 21)
// Plots
p9 = plot(t9, "TEMA 9", color=color.teal, linewidth=2)
p13 = plot(t13, "TEMA 13", color=color.aqua, linewidth=2)
p15 = plot(t15, "TEMA 15", color=color.orange, linewidth=2)
p21 = plot(t21, "TEMA 21", color=color.fuchsia, linewidth=2)
// Einfaches Fill (zwischen schnellstem und langsamstem)
fill(p9, p21, color=color.new(color.gray, 85))
fill(p13, p15, color=color.new(color.gray, 92))

First 15-min Candle High/LowFirst 15-Min Candle High/Low – Intraday Range Indicator
This script plots the High and Low of the first 15-minute candle of the trading day using:
🟢 Green horizontal line for the first 15-min High
🔴 Red horizontal line for the first 15-min Low
These levels are commonly used by intraday traders as:
Breakout zones
Support/resistance levels
Entry/exit reference points
The script is designed to reset daily and is especially helpful for index and equity traders operating during market open volatility.
⏰ Optimized for markets operating in IST (Indian Standard Time), such as NSE/BSE, starting at 09:15 AM.
🛠️ How to Use:
Apply on 15-minute or lower timeframes
Ideal for breakout strategies, opening range setups, or volatility scalping

Bollinger Bands with RSI Buy/Sell Signals (15 min) Bollinger Bands with RSI Buy/Sell Signals (15 Min)
Description:
The Bollinger Bands with RSI Buy/Sell Signals (15 Min) indicator is designed to help traders identify potential reversal points in the market using two popular technical indicators: Bollinger Bands and the Relative Strength Index (RSI).
How It Works:
Bollinger Bands:
Bollinger Bands consist of an upper band, lower band, and a middle line (Simple Moving Average). These bands adapt to market volatility, expanding during high volatility and contracting during low volatility.
This indicator monitors the 15-minute Bollinger Bands. If the price moves completely outside the bands, it signals that the market is potentially overextended.
Relative Strength Index (RSI):
RSI is a momentum indicator that measures the strength of price movements. RSI readings above 70 indicate an overbought condition, while readings below 30 suggest an oversold condition.
This indicator uses the RSI on the 15-minute time frame to further confirm overbought and oversold conditions.
Buy/Sell Signal Generation:
Buy Signal:
A buy signal is triggered when the market price crosses above the lower Bollinger Band on the 15-minute time frame, indicating that the market may be oversold.
Additionally, the RSI must be below 30, confirming an oversold condition.
A "Buy" label appears below the price when this condition is met.
Sell Signal:
A sell signal is triggered when the market price crosses below the upper Bollinger Band on the 15-minute time frame, indicating that the market may be overbought.
The RSI must be above 70, confirming an overbought condition.
A "Sell" label appears above the price when this condition is met.

RSI 15/60 and ADX PlotIn this script, the buy and sell criteria are based on the Relative Strength Index (RSI) values calculated for two different timeframes: the 15-minute RSI and the hourly RSI. These timeframes are used together to check signals when certain thresholds are crossed, providing confirmation across both short-term and longer-term momentum.
Buy Criteria:
Condition 1:
Hourly RSI > 60: This means the longer-term momentum shows strength.
15-minute RSI crosses above 60: This shows that the shorter-term momentum is catching up and confirms increasing strength.
Condition 2:
15-minute RSI > 60: This indicates that the short-term trend is already strong.
Hourly RSI crosses above 60: This confirms that the longer-term trend is also gaining strength.
Both conditions aim to capture the moments when the market shows increasing strength across both short and long timeframes, signaling a potential buy opportunity.
Sell Criteria:
Condition 1:
Hourly RSI < 40: This indicates that the longer-term trend is weakening.
15-minute RSI crosses below 40: The short-term momentum is also turning down, confirming the weakening trend.
Condition 2:
15-minute RSI < 40: The short-term trend is already weak.
Hourly RSI crosses below 40: The longer-term trend is now confirming the weakness, indicating a potential sell.
These conditions work to identify when the market is showing weakness in both short-term and long-term timeframes, signaling a potential sell opportunity.
ADX Confirmation :
The Average Directional Index (ADX) is a key tool for measuring the strength of a trend. It can be used alongside the RSI to confirm whether a buy or sell signal is occurring in a strong trend or during market consolidation. Here's how ADX can be integrated:
ADX > 25: This indicates a strong trend. Using this threshold, you can confirm buy or sell signals when there is a strong upward or downward movement in the market.
Buy Example: If a buy signal (RSI > 60) is triggered and the ADX is above 25, this confirms that the market is in a strong uptrend, making the buy signal more reliable.
Sell Example: If a sell signal (RSI < 40) is triggered and the ADX is above 25, it confirms a strong downtrend, validating the sell signal.
ADX < 25: This suggests a weak or non-existent trend. In this case, RSI signals might be less reliable since the market could be moving sideways.
Final Approach:
The RSI criteria help identify potential overbought and oversold conditions in both short and long timeframes.
The ADX confirmation ensures that the signals generated are happening during strong trends, increasing the likelihood of successful trades by filtering out weak or choppy market conditions.
This combination of RSI and ADX can help traders make more informed decisions by ensuring both momentum and trend strength align before entering or exiting trades.

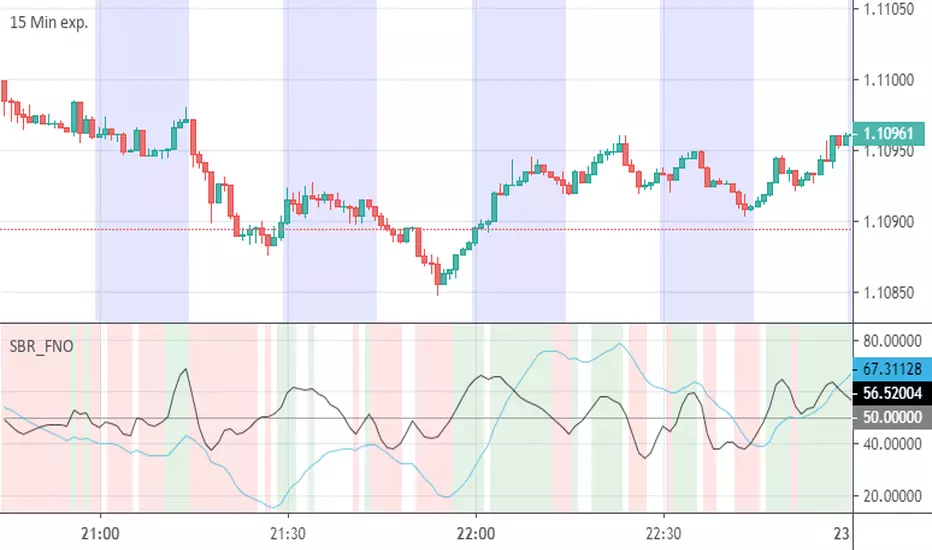
Stoch RSI 15 min - multi time frame tableABOUT THIS INDICATOR
This indicator calculates the Stochastic RSI for the time frames 15 min, 30 min, 1h, 4h, and 12h. However, the 15 min time frame should always be the default time frame for your chart.
IMPORTANT
* NOTE! It's extremely important that the chosen time frame for your chart is 15 min. Otherwise the Stochastic RSI for the longer time frames won’t be correctly calculated.
* Stochastic RSI will be calculated and displayed in a table for the time frames: 15 min, 30 min, 1h, 4h, 12h.
* All time frames are based on closed bars except the "15minR" that are realtime updated values calculated on a 15 min time frame.
ABOUT STOCHASTIC RSI
The Stochastic RSI (StochRSI) is a momentum indicator that ranges between 0 and 100. A Stochastic RSI value above 80 is considered overbought and below 20 is considered oversold.
By using different time frames you can get a better idea of what direction the trade could take in a "longer" perspective.
SETTINGS
1.) Length RSI = 14 (default period)
2.) Smoothing parameter of Stochastic RSI (Length Moving Average = 3) . Moving average of stochastic RSI
* By default the displayed Stochastic RSI values are smoothed values of the actual Stochastic RSI. The smoothnes is formed by a calculated moving average of with the length of 3 by default.
If you want Stochastic RSI with a sharper signal (higher risk for "false alarms" being more sensitive) change the Length Moving Average to = 1 (no smoothness at all)
You can see the selected "Length RSI" and "Length Moving Average" on top of the Stochastic RSI table.
Next version of this script will be updated with more a more flexible solution for different time frames.
* NOTE, Tradingview comes with a inbuilt Stochastic RSI. See the the chart below. The blue line in the Stochastic-RSI chart represents (K value = 3) the same value as the script calculate/display in the table.
