SessionRangeLevels_v0.1SessionRangeLevels_v0.1
Overview:
SessionRangeLevels_v0.1 is a customizable Pine Script (v6) indicator designed to plot key price levels based on a user-defined trading session. It identifies the high and low of the session and calculates intermediate levels (75%, 50% "EQ", and 25%) within that range. These levels are projected forward as horizontal lines with accompanying labels, providing traders with dynamic support and resistance zones. The indicator supports extensive customization for session timing, time zones, line styles, colors, and more.
Key Features:
Session-Based Range Detection: Tracks the high and low prices during a specified session (e.g., 0600-0900) and updates them dynamically as the session progresses.
Customizable Levels: Displays High, 75%, EQ (50%), 25%, and Low levels, each with independent toggle options, styles (Solid, Dashed, Dotted), colors, and widths.
Session Anchor: Optional vertical line marking the session start, with customizable style, color, and width.
Projection Offset: Extends level lines forward by a user-defined number of bars (default: 24) for future price reference.
Labels: Toggleable labels for each level (e.g., "High," "75%," "EQ") with adjustable size (Tiny, Small, Normal, Large).
Time Zone Support: Aligns session timing to a selected time zone (e.g., America/New_York, UTC, Asia/Tokyo, etc.).
Alert Conditions: Triggers alerts when the price crosses any of the plotted levels (High, 75%, EQ, 25%, Low).
Inputs:
Session Time (HHMM-HHMM): Define the session range (e.g., "0600-0900" for 6:00 AM to 9:00 AM).
Time Zone: Choose from options like UTC, America/New_York, Europe/London, etc.
Anchor Settings: Toggle the session start line, adjust its style (default: Dotted), color (default: Black), and width (default: 1).
Level Settings:
High (Solid, Black, Width 2)
75% (Dotted, Blue, Width 1)
EQ/50% (Dotted, Orange, Width 1)
25% (Dotted, Blue, Width 1)
Low (Solid, Black, Width 2)
Each level includes options to show/hide, set style, color, width, and label visibility.
Projection Offset: Number of bars to extend lines (default: 24).
Label Size: Set label size (default: Small).
How It Works:
The indicator detects the start and end of the user-defined session based on the specified time and time zone.
During the session, it tracks the highest high and lowest low, updating the levels in real-time.
At the session start, it plots the High, Low, and intermediate levels (75%, 50%, 25%), projecting them forward.
Lines and labels dynamically adjust as new highs or lows occur within the session.
Alerts notify users when the price crosses any active level.
Usage:
Ideal for traders who focus on session-based strategies (e.g., London or New York open). Use it to identify key price zones, monitor breakouts, or set targets. Customize the appearance to suit your chart preferences and enable alerts for real-time trading signals.
Notes:
Ensure your chart’s timeframe aligns with your session duration for optimal results (e.g., 1-minute or 5-minute charts for short sessions).
The indicator overlays directly on the price chart for easy integration with other tools.
Cari dalam skrip untuk "豪24配债"

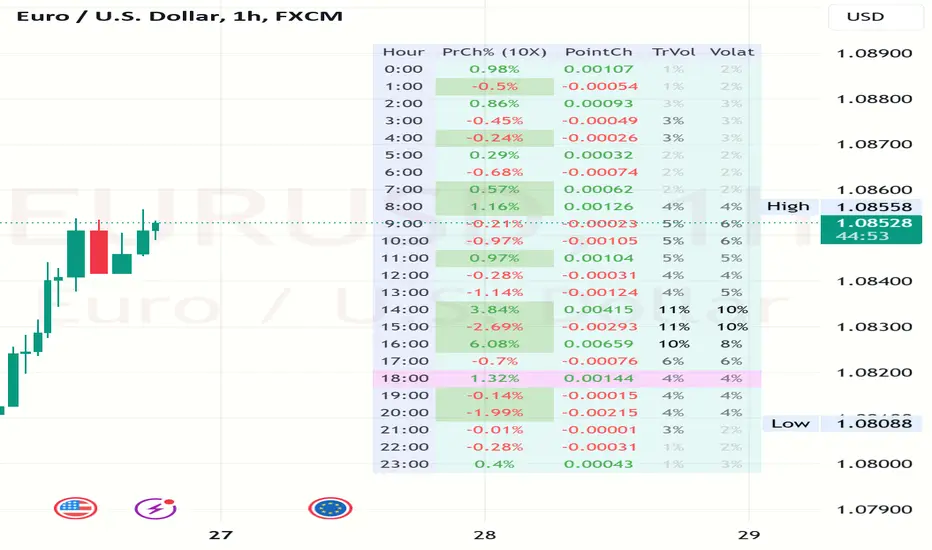
Hourly Volatility Explorer📊 Hourly Volatility Explorer: Master The Market's Pulse
Unlock the hidden rhythms of price action with this sophisticated volatility analysis tool. The Hourly Volatility Explorer reveals the most potent trading hours across multiple time zones, giving you a strategic edge in timing your trades.
🌟 Key Features:
⏰ Multi-Timezone Analysis
• GMT (UTC+0)
• EST (UTC-5) - New York
• BST (UTC+1) - London
• JST (UTC+9) - Tokyo
• AEST (UTC+10) - Sydney
Perfect for tracking major market sessions and their overlaps!
📈 Dynamic Visualization
• Color-gradient hourly bars for instant pattern recognition
• Real-time volatility comparison
• Interactive data table with comprehensive statistics
• Automatic highlighting of peak volatility periods
🎯 Strategic Applications:
Day Trading:
• Identify optimal trading windows
• Avoid low-liquidity periods
• Capitalize on session overlaps
• Fine-tune entry/exit timing
Risk Management:
• Set appropriate stop losses based on hourly volatility
• Adjust position sizes for different market hours
• Optimize risk-reward ratios
• Plan around high-impact hours
Global Market Analysis:
• Track volatility across all major sessions
• Spot institutional trading patterns
• Identify quiet vs. active periods
• Monitor 24/7 market dynamics
💡 Perfect For:
• Forex traders navigating global sessions
• Crypto traders in 24/7 markets
• Day traders optimizing execution times
• Algorithmic traders fine-tuning strategies
• Risk managers calibrating exposure
📊 Advanced Features:
• Rolling 3-month analysis for reliable patterns
• Precise pip movement calculations
• Sample size tracking for statistical validity
• Real-time current hour comparison
• Color-coded visual system for instant insights
⚡ Pro Trading Tips:
• Use during major session overlaps for maximum opportunity
• Compare patterns across different instruments
• Combine with volume analysis for deeper insights
• Track seasonal variations in hourly patterns
• Build trading schedules around peak hours
🎓 Educational Value:
• Understand market microstructure
• Learn global market dynamics
• Master timezone relationships
• Develop timing intuition
🛠️ Customization:
• Adjustable lookback period
• Flexible pip multiplier
• Multiple timezone options
• Visual preference settings
Whether you're scalping the 1-minute chart or managing longer-term positions, the Hourly Volatility Explorer provides the precise timing intelligence needed for today's global markets.
Transform your trading schedule from guesswork to science. Know exactly when markets move, why they move, and how to position yourself for maximum opportunity.
#TechnicalAnalysis #Trading #Volatility #MarketTiming #DayTrading #Forex #Crypto #TradingView #PineScript #MarketAnalysis #TradingStrategy #RiskManagement #GlobalMarkets #FinancialMarkets #TradingTools #MarketStructure #PriceAction #Scalping #SwingTrading #AlgoTrading

Correlation X macroeconomicsFind the correlation between financial assets and the main Brazilian macroeconomic variables:
SELIC rate (Red)
PIB (Green)
Inflation (Blue)
Employment and income (Yellow)
Unlike other indicators that measure the correlation between two assets, the indicator "Correlation X macroeconomics" measures, for example, the correlation that the VALE3 asset has with the SELIC rate.
The correlation is obtained by calculating the variation suffered by a given asset on the day a given Brazilian macroeconomic variable is released.
This indicator can be used on any financial asset.
Use time frame chart = 1 day.
To calculate the correlation, data published by IBGE and the Central Bank of Brazil over a period of time are used. This time period is different depending on the selected macroeconomic variable. Namely:
16 PIB disclosures (4 years)
24 SELIC rate disclosures (3 years)
24 disclosures of IPCA and employment and income data (2 years)
You can select one or more macroeconomic variables to check the effect of correlation separately on each of them.
This indicator "Correlation X macroeconomics" will be updated monthly, as detailed below:
At the end of the day on which the PIB is released
At the end of the day on which employment and income data are released
At the end of the day following the day on which the SELIC rate is published
On the last business day of the month if none of the aforementioned disclosures occur

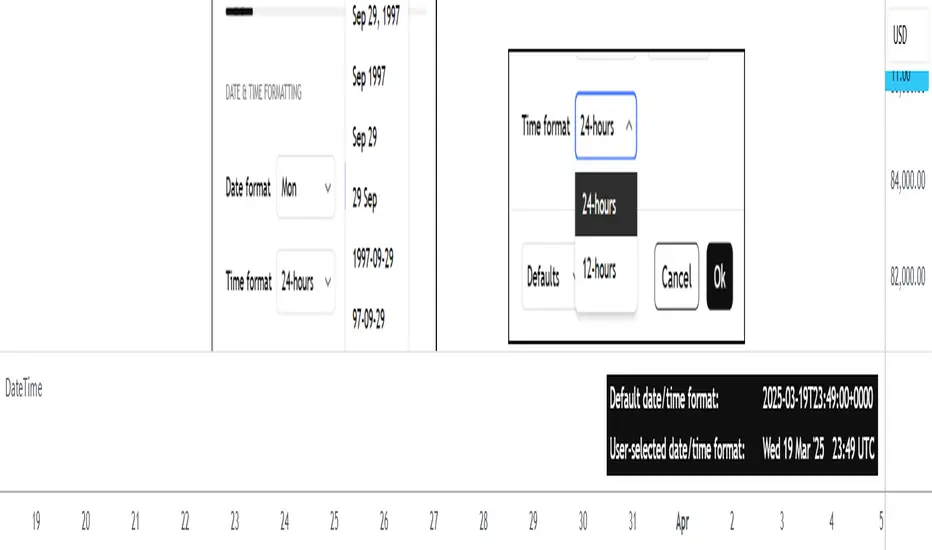
DateTimeLibrary with enums that can be used as script inputs to allow users to set their preferred date and/or time formats. The user-selected formats can be passed to the library functions (which use 𝚜𝚝𝚛.𝚏𝚘𝚛𝚖𝚊𝚝_𝚝𝚒𝚖𝚎() under the hood) to get formatted date and time strings from a UNIX time.
PREFACE
The target audience of this publication is users creating their own indicators/strategies.
Sometimes a date and/or time needs to be displayed to the user. As a Pine Coder, it is natural to focus our initial attention on the primary calculations or functions of a script, which can lead to the display format of dates and times being an afterthought. While it may not be crucial for the main use case of a script, increased customizability can help push indicators/strategies to the next level in the eyes of the user.
The purpose of this library is to provide an easy-to-use mechanism for allowing script users to choose the formats of dates and times that are displayed to them. Not only is this helpful for users from around the world who may be accustomed to different date/time formats, but it also makes it easier for the script author because it offloads the date/time formatting decision from the author to the user.
HOW TO USE
Step 1
Import the library. Replace with the latest available version number for this library.
//@version=6
indicator("Example")
import n00btraders/DateTime/ as dt
Step 2
Select a date format and/or time format enum to be used as an input.
dateFormatInput = input.enum(dt.DateFormat.FORMAT_3, "Date format")
timeFormatInput = input.enum(dt.TimeFormat.TWENTY_FOUR_HOURS, "Time hours format")
Step 3
Pass the user's selection as the `format` parameter in the formatting functions from this library. The `timestamp` & `timezone` parameters can be any value that would otherwise be used in 𝚜𝚝𝚛.𝚏𝚘𝚛𝚖𝚊𝚝_𝚝𝚒𝚖𝚎(𝚝𝚒𝚖𝚎, 𝚏𝚘𝚛𝚖𝚊𝚝, 𝚝𝚒𝚖𝚎𝚣𝚘𝚗𝚎).
string formattedDate = dt.formatDate(timestamp, dateFormatInput, timezone)
string formattedTime = dt.formatTime(timestamp, timeFormatInput, timezone)
LIMITATIONS
The library's ease-of-use comes at a few costs:
Fixed date/time formats.
Using the library's pre-defined date & time formats means that additional custom formats cannot be utilized. For example, this library does not include seconds or fractional seconds in formatted time strings. If a script's use case requires displaying the 'seconds' from a time of day, then 𝚜𝚝𝚛.𝚏𝚘𝚛𝚖𝚊𝚝_𝚝𝚒𝚖𝚎() must be used directly.
Fixed time zone offset format.
The `formatTime()` function of this library can optionally add the time zone offset at the end of the time string, but the format of the offset cannot be specified. Note: if the default format for time zone offset is not sufficient, the Timezone library can be imported directly to get the time zone offset string in a preferred format.
ADVANTAGES
There are benefits to utilizing this library instead of directly using 𝚜𝚝𝚛.𝚏𝚘𝚛𝚖𝚊𝚝_𝚝𝚒𝚖𝚎():
Easy to use from the user's perspective.
The date & time format enums provide a similar look and feel to the "Date format" and "Time hours format" options that already exist in the TradingView chart settings.
Easy to use from the author's perspective.
The exported functions from this library are modeled to behave similarly to the 𝚜𝚝𝚛.𝚏𝚘𝚛𝚖𝚊𝚝_𝚝𝚒𝚖𝚎(𝚝𝚒𝚖𝚎, 𝚏𝚘𝚛𝚖𝚊𝚝, 𝚝𝚒𝚖𝚎𝚣𝚘𝚗𝚎) built-in function from Pine Script.
Format quarter of the year.
The date formatting function from this library can display a fiscal quarter if it's included in the user-selected format. This is currently not possible with the built-in 𝚜𝚝𝚛.𝚏𝚘𝚛𝚖𝚊𝚝_𝚝𝚒𝚖𝚎().
EXPORTED ENUM TYPES
This section will list the available date/time formats that can be used as a script input. Each enum type has a detailed //@𝚏𝚞𝚗𝚌𝚝𝚒𝚘𝚗 description in the source code to help determine the best choice for your scripts.
Date Format Enums:
𝙳𝚊𝚝𝚎𝙵𝚘𝚛𝚖𝚊𝚝
𝙳𝚊𝚝𝚎𝙵𝚘𝚛𝚖𝚊𝚝𝙳𝚊𝚢𝙾𝚏𝚆𝚎𝚎𝚔𝙰𝚋𝚋𝚛
𝙳𝚊𝚝𝚎𝙵𝚘𝚛𝚖𝚊𝚝𝙳𝚊𝚢𝙾𝚏𝚆𝚎𝚎𝚔𝙵𝚞𝚕𝚕
𝙲𝚞𝚜𝚝𝚘𝚖𝙳𝚊𝚝𝚎𝙵𝚘𝚛𝚖𝚊𝚝
Supporting Date Enums:
𝙳𝚊𝚝𝚎𝙿𝚛𝚎𝚏𝚒𝚡
Time Format Enums:
𝚃𝚒𝚖𝚎𝙵𝚘𝚛𝚖𝚊𝚝
Supporting Time Enums:
𝚃𝚒𝚖𝚎𝙰𝚋𝚋𝚛𝚎𝚟𝚒𝚊𝚝𝚒𝚘𝚗
𝚃𝚒𝚖𝚎𝚂𝚎𝚙𝚊𝚛𝚊𝚝𝚘𝚛
𝚃𝚒𝚖𝚎𝙿𝚘𝚜𝚝𝚏𝚒𝚡
Note: all exported enums have custom titles for each field. This means that the supporting enums could also be exposed to the end-user as script inputs if necessary. The supporting enums are used as optional parameters in this library's formatting functions to allow further customizability.
EXPORTED FUNCTIONS
formatDate(timestamp, format, timezone, prefix, trim)
Converts a UNIX time into a date string formatted according to the selected `format`.
Parameters:
timestamp (series int) : A UNIX time.
format (series DateFormat) : A date format.
timezone (series string) : A UTC/GMT offset or IANA time zone identifier.
prefix (series DatePrefix) : Optional day of week prefix.
trim (series bool) : Optional truncation of numeric month / day.
Returns: Calendar date string using the selected format.
⸻⸻⸻⸻⸻⸻⸻⸻
Required parameters: `timestamp`, `format`.
Note: there is a version of this function for each Date Format enum type. The only difference is the type of the `format` parameter.
Tip: hover over the `formatDate()` function in the Pine Editor to display useful details:
Function description
Parameter descriptions + default values
Example function usage
formatTime(timestamp, format, timezone, trim, separator, postfix, space, offset)
Converts a UNIX time into a formatted time string using the 24-hour clock or 12-hour clock.
Parameters:
timestamp (series int) : A UNIX time.
format (series TimeFormat) : A time format.
timezone (series string) : A UTC/GMT offset or IANA time zone identifier.
trim (series TimeAbbreviation) : Optional truncation of the hour and minute portion.
separator (series TimeSeparator) : Optional time separator.
postfix (series TimePostfix) : Optional format for the AM/PM postfix.
space (series bool) : Optional space between the time and the postfix.
offset (series bool) : Optional UTC offset as a suffix.
Returns: Time of day string using the selected format.
⸻⸻⸻⸻⸻⸻⸻⸻
Required parameters: `timestamp`, `format`.
Note: the `trim`, `postfix`, and `space` optional parameters are not applicable and will be ignored when using the 24-hour clock (`format` = TimeFormat.TWENTY_FOUR_HOURS).
Tip: hover over the `formatTime()` function in the Pine Editor to display useful details:
Function description
Parameter descriptions + default values
Example function usage
Example outputs for combinations of TimeFormat.* enum values & optional parameters
NOTES
This library can be used in conjunction with the Timezone library to increase the usability of scripts that can benefit from allowing the user to input their preferred time zone.
Credits to HoanGhetti for publishing an informative Markdown resource which I referenced to create the formatted function descriptions that pop up when hovering over `formatDate()` and `formatTime()` function calls in the Pine Editor.
Crypto Strategy SUSDT 10 minThis strategy is designed to trade the **SUSDT** pair on a **10-minute time frame**, using a combination of an Exponential Moving Average (EMA) and percentage-based Stop Loss (SL) and Take Profit (TP) levels.
### How the strategy works:
1. **EMA Calculation**:
- The strategy calculates a 24-period Exponential Moving Average (EMA) based on the closing price.
- This EMA serves as the primary trend indicator.
2. **Entry Conditions**:
- **Long Position**: A long position is entered when the closing price is above the EMA and the opening price is below the EMA. This indicates a potential upward trend.
- **Short Position**: A short position is entered when the closing price is below the EMA and the opening price is above the EMA. This indicates a potential downward trend.
3. **Stop Loss and Take Profit**:
- Both Stop Loss (SL) and Take Profit (TP) are calculated based on the entry price of the position.
- **For Long Positions**:
- Stop Loss is set as a percentage below the entry price.
- Take Profit is set as a percentage above the entry price.
- **For Short Positions**:
- Stop Loss is set as a percentage above the entry price.
- Take Profit is set as a percentage below the entry price.
- The percentage values for SL and TP can be adjusted in the strategy's settings (default: SL = 2%, TP = 4%).
4. **Exit Conditions**:
- The position is closed automatically when either the Stop Loss or Take Profit level is reached.
5. **Visualization**:
- The 24-period EMA is plotted on the chart as a blue line, helping visualize the trend direction.
### Key Features:
- **Pair and Time Frame**: The strategy is optimized for the SUSDT pair on a 10-minute time frame.
- **Customizable Parameters**: Users can adjust the Stop Loss and Take Profit percentages to suit their risk tolerance and trading style.
- **Trend-Following Approach**: The strategy uses the EMA to identify and follow the current market trend.
This strategy is simple yet effective for capturing trends while managing risk through predefined Stop Loss and Take Profit levels.

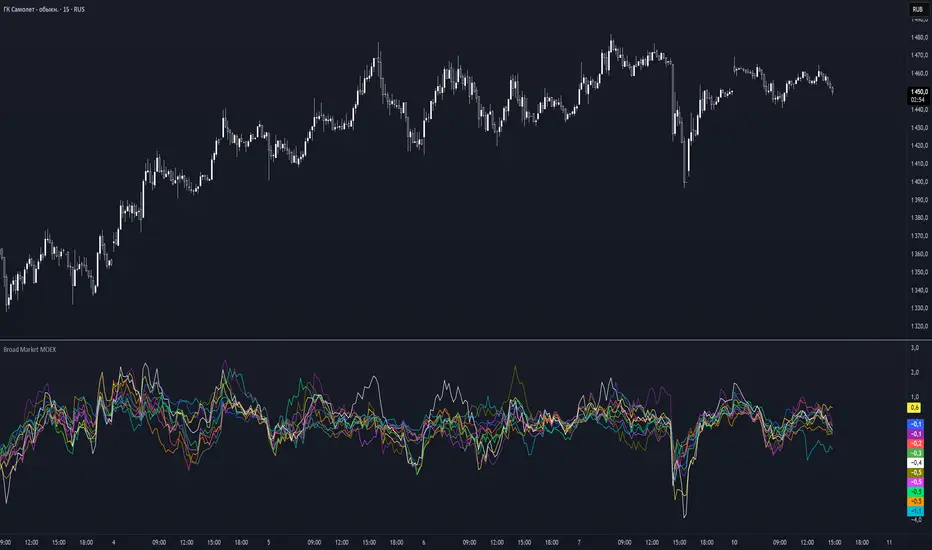
Broad Market MOEX### **Broad Market for Russia**
The **Broad Market for Russia** indicator provides a comparative analysis of the price deviation of major Russian stocks relative to their average closing price over a customizable lookback period. This tool helps traders identify market trends and detect relative strength or weakness among different assets.
### **How It Works:**
- The indicator calculates the **percentage deviation** of each stock’s current price from its **simple moving average (SMA)** over the defined **lookback period (in hours).**
- The **default lookback period is 24 hours**, but it can be adjusted based on the trader’s needs.
- It tracks major Russian assets, including **Gazprom, Sberbank, Lukoil, Rosneft, Norilsk Nickel, Yandex, and others**, alongside the currently selected instrument.
- Each stock’s deviation is plotted on a separate panel, allowing for quick visual comparison.
- **Positive deviation** indicates that the price is trading above its average, signaling potential **bullish momentum**.
- **Negative deviation** suggests the price is below its average, possibly indicating **bearish conditions**.
This indicator is particularly useful for traders in the Russian stock market who want to gauge broader market strength and detect divergence patterns across multiple assets.
---
### **Broad Market for Russia**
Индикатор **Broad Market for Russia** предоставляет сравнительный анализ отклонения цены крупнейших российских акций относительно их среднего значения за настраиваемый период. Этот инструмент помогает трейдерам выявлять рыночные тренды и определять относительную силу или слабость активов.
### **Как это работает:**
- Индикатор рассчитывает **процентное отклонение** текущей цены каждой акции от её **простого скользящего среднего (SMA)** за заданный **период анализа (в часах).**
- **Период анализа по умолчанию — 24 часа**, но его можно изменять в зависимости от предпочтений трейдера.
- В индикаторе отслеживаются **крупнейшие российские активы**, такие как **Газпром, Сбербанк, Лукойл, Роснефть, Норникель, Яндекс и другие**, а также текущий выбранный инструмент.
- Отклонение каждой акции отображается на отдельной панели, что позволяет быстро проводить визуальное сравнение.
- **Положительное отклонение** означает, что цена торгуется выше своего среднего значения, что может сигнализировать о **бычьем тренде**.
- **Отрицательное отклонение** указывает, что цена ниже своего среднего значения, что может свидетельствовать о **медвежьей тенденции**.
Этот индикатор особенно полезен для трейдеров российского фондового рынка, которые хотят оценить силу всего рынка и выявлять расхождения между различными активами.
Broad Market for Crypto**Broad Market for Crypto** indicator provides a comparative analysis of the price deviation of multiple major cryptocurrencies relative to their average closing price over a customizable lookback period. This tool helps traders identify market trends and spot relative strength or weakness among different assets.
### **How It Works:**
- The indicator calculates the percentage deviation of each cryptocurrency’s current price from its simple moving average (SMA) over the defined **lookback period (in hours).**
- The **default lookback period is 24 hours**, but it can be adjusted according to the trader's preference.
- It tracks major crypto assets, including **BTC, ETH, BNB, SOL, XRP, ADA, AVAX, LINK, DOGE, and TRX**, alongside the currently selected instrument.
- Each cryptocurrency’s deviation is plotted on a separate panel, allowing for quick visual comparison.
- Positive deviation indicates that the price is trading above its average, signaling potential bullish momentum.
- Negative deviation suggests the price is below its average, possibly indicating bearish conditions.
This indicator is particularly useful for crypto traders who want to gauge the broader market’s strength and detect divergence patterns across multiple assets.
---------------------------------------------------------------------------------
**Broad Market for Crypto - Описание индикатора**
Индикатор **Broad Market for Crypto** предоставляет сравнительный анализ отклонения цены различных крупных криптовалют относительно их среднего значения за настраиваемый период. Этот инструмент помогает трейдерам выявлять рыночные тренды и определять относительную силу или слабость активов.
### **Как это работает:**
- Индикатор рассчитывает **процентное отклонение** текущей цены каждой криптовалюты от её **простого скользящего среднего (SMA)** за заданный **период анализа (в часах)**.
- **Период анализа по умолчанию — 24 часа**, но его можно изменять в зависимости от предпочтений трейдера.
- В индикаторе отслеживаются основные криптоактивы: **BTC, ETH, BNB, SOL, XRP, ADA, AVAX, LINK, DOGE и TRX**, а также текущий выбранный инструмент.
- Отклонение каждой криптовалюты отображается на отдельной панели, что позволяет быстро проводить визуальное сравнение.
- **Положительное отклонение** означает, что цена торгуется выше своего среднего значения, что может сигнализировать о **бычьем тренде**.
- **Отрицательное отклонение** указывает, что цена ниже своего среднего значения, что может свидетельствовать о **медвежьей тенденции**.
Этот индикатор особенно полезен для криптотрейдеров, желающих оценить силу всего рынка и выявлять расхождения между различными активами.

Cryptolabs Global Liquidity Cycle Momentum IndicatorCryptolabs Global Liquidity Cycle Momentum Indicator (LMI-BTC)
This open-source indicator combines global central bank liquidity data with Bitcoin price movements to identify medium- to long-term market cycles and momentum phases. It is designed for traders who want to incorporate macroeconomic factors into their Bitcoin analysis.
How It Works
The script calculates a Liquidity Index using balance sheet data from four central banks (USA: ECONOMICS:USCBBS, Japan: FRED:JPNASSETS, China: ECONOMICS:CNCBBS, EU: FRED:ECBASSETSW), augmented by the Dollar Index (TVC:DXY) and Chinese 10-year bond yields (TVC:CN10Y). This index is:
- Logarithmically scaled (math.log) to better represent large values like central bank balances and Bitcoin prices.
- Normalized over a 50-period range to balance fluctuations between minimum and maximum values.
- Compared to prior-year values, with the number of bars dynamically adjusted based on the timeframe (e.g., 252 for 1D, 52 for 1W), to compute percentage changes.
The liquidity change is analyzed using a Chande Momentum Oscillator (CMO) (period: 24) to measure momentum trends. A Weighted Moving Average (WMA) (period: 10) acts as a signal line. The Bitcoin price is also plotted logarithmically to highlight parallels with liquidity cycles.
Usage
Traders can use the indicator to:
- Identify global liquidity cycles influencing Bitcoin price trends, such as expansive or restrictive monetary policies.
- Detect momentum phases: Values above 50 suggest overbought conditions, below -50 indicate oversold conditions.
- Anticipate trend reversals by observing CMO crossovers with the signal line.
It performs best on higher timeframes like daily (1D) or weekly (1W) charts. The visualization includes:
- CMO line (green > 50, red < -50, blue neutral), signal line (white), Bitcoin price (gray).
- Horizontal lines at 50, 0, and -50 for improved readability.
Originality
This indicator stands out from other momentum tools like RSI or basic price analysis due to:
- Unique Data Integration: Combines four central bank datasets, DXY, and CN10Y as macroeconomic proxies for Bitcoin.
- Dynamic Prior-Year Analysis: Calculates liquidity changes relative to historical values, adjustable by timeframe.
- Logarithmic Normalization: Enhances visibility of extreme values, critical for cryptocurrencies and macro data.
This combination offers a rare perspective on the interplay between global liquidity and Bitcoin, unavailable in other open-source scripts.
Settings
- CMO Period: Default 24, adjustable for faster/slower signals.
- Signal WMA: Default 10, for smoothing the CMO line.
- Normalization Window: Default 50 periods, customizable.
Users can modify these parameters in the Pine Editor to tailor the indicator to their strategy.
Note
This script is designed for medium- to long-term analysis, not scalping. For optimal results, combine it with additional analyses (e.g., on-chain data, support/resistance levels). It does not guarantee profits but supports informed decisions based on macroeconomic trends.
Data Sources
- Bitcoin: INDEX:BTCUSD
- Liquidity: ECONOMICS:USCBBS, FRED:JPNASSETS, ECONOMICS:CNCBBS, FRED:ECBASSETSW
- Additional: TVC:DXY, TVC:CN10Y

Percent Change HistogramThis indicator shows you percent changes in a super visual way using a color-coded histogram.
Here's how the colors work:
🟩 Dark green = percent change is growing stronger
🟢 Light green = still positive but losing steam
🟥 Dark red = getting more negative
🔴 Light red = negative but improving
The cool part? You can set any lookback period you want. For example:
24 periods on 1H chart = last 24 hours
30 periods on daily = last month
7 periods on daily = last week
Pro tip: You're not locked to your chart's timeframe! Want to see monthly changes while trading on 5min?
No problem.
You can even stack multiple indicators to watch different intervals simultaneously (daily, weekly, monthly) - super helpful for multi-timeframe analysis.
Perfect for spotting momentum shifts across different timeframes without switching between charts.

Midnight Open RangeMidnight Open Range with Breakouts & Targets
This indicator helps traders identify and analyze the Midnight Open Range (12:00 AM to 12:30 AM ET) for potential trading opportunities. Key features include:
1. Automatic detection and plotting of the Midnight Open Range
2. Display of multiple historical ranges (customizable)
3. Breakout signals for range violations
4. Multiple target levels based on the range size
5. Customizable colors and styles for easy visual analysis
Perfect for traders looking to capitalize on overnight price action and early morning trends. Ideal for forex, futures, and 24-hour markets.
Note: For best results, use on lower timeframes (5-minute or less) with 24-hour chart data.

PreMarket_Estimator Portfolio [n_dot]AMEX:SOXL ; NASDAQ:TQQQ ; AMEX:FNGU ; AMEX:SOXS ; NASDAQ:SQQQ ; AMEX:FNGD
Strategy Core Idea:
I focus on stocks that are expected to show significant price movements (gaps) during the premarket, usually due to news or earnings reports. I record the highest price formed during the premarket, and if the price exceeds this level after the market opens, I go LONG. Based on my experience, it’s advisable to exit after a few percentage points of increase, as the premarket boom often corrects itself.
Usage:
The indicator is best used in pairs: Pre_Market_Estimator Single and Pre_Market_Estimator Portfolio.
In this portfolio version, you can set up 6 different instruments, which are displayed stacked vertically on the screen, while the single version monitors only one instrument. The portfolio does not plot charts at the actual price levels but offsets them vertically, displaying the current prices in a label at the end of each chart.
Settings:
Time point 1: Start of the observation period.
Time point 2: End of the observation period / Start of the trading period.
GAP: is used to adjust the distance between the charts displayed in the portfolio view. This allows you to customize the spacing for better readability and visualization of the monitored instruments.
Usage:
Set the timeframe period to "1m".
Set Time point 1 to the start of the premarket session on the current day (e.g., NYSE: 9:00).
Set Time point 2 to the market open (e.g., NYSE: 9:30).
The indicator monitors the highest price during the premarket period, marking it with a blue line.
During the subsequent trading period, if the price exceeds the premarket high, it generates a buy signal marked with a blue plus sign.
Limitations:
The premarket prediction typically provides actionable signals during the first 30 minutes to 1 hour of the trading session. After this, the trend is usually driven by daily market events or news.
To reduce data usage, the portfolio version of the indicator (which monitors 6 instruments simultaneously) only loads the last 24 hours of data (60 * 24 minutes). After this, the chart stops providing signals, and the time points need to be reset.
Additional Use Cases:
This type of breakout monitoring is not only suitable for observing premarket events but can also provide relevant information before major announcements.
For example, in the case of central bank rate hikes:
Set Point 1 to 1 hour before the announcement.
Set Point 2 to the time of the announcement.
I hope this contributes to your success!

Ensemble Alerts█ OVERVIEW
This indicator creates highly customizable alert conditions and messages by combining several technical conditions into groups , which users can specify directly from the "Settings/Inputs" tab. It offers a flexible framework for building and testing complex alert conditions without requiring code modifications for each adjustment.
█ CONCEPTS
Ensemble analysis
Ensemble analysis is a form of data analysis that combines several "weaker" models to produce a potentially more robust model. In a trading context, one of the most prevalent forms of ensemble analysis is the aggregation (grouping) of several indicators to derive market insights and reinforce trading decisions. With this analysis, traders typically inspect multiple indicators, signaling trade actions when specific conditions or groups of conditions align.
Simplifying ensemble creation
Combining indicators into one or more ensembles can be challenging, especially for users without programming knowledge. It usually involves writing custom scripts to aggregate the indicators and trigger trading alerts based on the confluence of specific conditions. Making such scripts customizable via inputs poses an additional challenge, as it often involves complicated input menus and conditional logic.
This indicator addresses these challenges by providing a simple, flexible input menu where users can easily define alert criteria by listing groups of conditions from various technical indicators in simple text boxes . With this script, you can create complex alert conditions intuitively from the "Settings/Inputs" tab without ever writing or modifying a single line of code. This framework makes advanced alert setups more accessible to non-coders. Additionally, it can help Pine programmers save time and effort when testing various condition combinations.
█ FEATURES
Configurable alert direction
The "Direction" dropdown at the top of the "Settings/Inputs" tab specifies the allowed direction for the alert conditions. There are four possible options:
• Up only : The indicator only evaluates upward conditions.
• Down only : The indicator only evaluates downward conditions.
• Up and down (default): The indicator evaluates upward and downward conditions, creating alert triggers for both.
• Alternating : The indicator prevents alert triggers for consecutive conditions in the same direction. An upward condition must be the first occurrence after a downward condition to trigger an alert, and vice versa for downward conditions.
Flexible condition groups
This script features six text inputs where users can define distinct condition groups (ensembles) for their alerts. An alert trigger occurs if all the conditions in at least one group occur.
Each input accepts a comma-separated list of numbers with optional spaces (e.g., "1, 4, 8"). Each listed number, from 1 to 35, corresponds to a specific individual condition. Below are the conditions that the numbers represent:
1 — RSI above/below threshold
2 — RSI below/above threshold
3 — Stoch above/below threshold
4 — Stoch below/above threshold
5 — Stoch K over/under D
6 — Stoch K under/over D
7 — AO above/below threshold
8 — AO below/above threshold
9 — AO rising/falling
10 — AO falling/rising
11 — Supertrend up/down
12 — Supertrend down/up
13 — Close above/below MA
14 — Close below/above MA
15 — Close above/below open
16 — Close below/above open
17 — Close increase/decrease
18 — Close decrease/increase
19 — Close near Donchian top/bottom (Close > (Mid + HH) / 2)
20 — Close near Donchian bottom/top (Close < (Mid + LL) / 2)
21 — New Donchian high/low
22 — New Donchian low/high
23 — Rising volume
24 — Falling volume
25 — Volume above average (Volume > SMA(Volume, 20))
26 — Volume below average (Volume < SMA(Volume, 20))
27 — High body to range ratio (Abs(Close - Open) / (High - Low) > 0.5)
28 — Low body to range ratio (Abs(Close - Open) / (High - Low) < 0.5)
29 — High relative volatility (ATR(7) > ATR(40))
30 — Low relative volatility (ATR(7) < ATR(40))
31 — External condition 1
32 — External condition 2
33 — External condition 3
34 — External condition 4
35 — External condition 5
These constituent conditions fall into three distinct categories:
• Directional pairs : The numbers 1-22 correspond to pairs of opposing upward and downward conditions. For example, if one of the inputs includes "1" in the comma-separated list, that group uses the "RSI above/below threshold" condition pair. In this case, the RSI must be above a high threshold for the group to trigger an upward alert, and the RSI must be below a defined low threshold to trigger a downward alert.
• Non-directional filters : The numbers 23-30 correspond to conditions that do not represent directional information. These conditions act as filters for both upward and downward alerts. Traders often use non-directional conditions to refine trending or mean reversion signals. For instance, if one of the input lists includes "30", that group uses the "Low relative volatility" condition. The group can trigger an upward or downward alert only if the 7-period Average True Range (ATR) is below the 40-period ATR.
• External conditions : The numbers 31-35 correspond to external conditions based on the plots from other indicators on the chart. To set these conditions, use the source inputs in the "External conditions" section near the bottom of the "Settings/Inputs" tab. The external value can represent an upward, downward, or non-directional condition based on the following logic:
▫ Any value above 0 represents an upward condition.
▫ Any value below 0 represents a downward condition.
▫ If the checkbox next to the source input is selected, the condition becomes non-directional . Any group that uses the condition can trigger upward or downward alerts only if the source value is not 0.
To learn more about using plotted values from other indicators, see this article in our Help Center and the Source input section of our Pine Script™ User Manual.
Group markers
Each comma-separated list represents a distinct group , where all the listed conditions must occur to trigger an alert. This script assigns preset markers (names) to each condition group to make the active ensembles easily identifiable in the generated alert messages and labels. The markers assigned to each group use the format "M", where "M" is short for "Marker" and "x" is the group number. The titles of the inputs at the top of the "Settings/Inputs" tab show these markers for convenience.
For upward conditions, the labels and alert messages show group markers with upward triangles (e.g., "M1▲"). For downward conditions, they show markers with downward triangles (e.g., "M1▼").
NOTE: By default, this script populates the "M1" field with a pre-configured list for a mean reversion group ("2,18,24,28"). The other fields are empty. If any "M*" input does not contain a value, the indicator ignores it in the alert calculations.
Custom alert messages
By default, the indicator's alert message text contains the activated markers and their direction as a comma-separated list. Users can override this message for upward or downward alerts with the two text fields at the bottom of the "Settings/Inputs" tab. When the fields are not empty , the alerts use that text instead of the default marker list.
NOTE: This script generates alert triggers, not the alerts themselves. To set up an alert based on this script's conditions, open the "Create Alert" dialog box, then select the "Ensemble Alerts" and "Any alert() function call" options in the "Condition" tabs. See the Alerts FAQ in our Pine Script™ User Manual for more information.
Condition visualization
This script offers organized visualizations of its conditions, allowing users to inspect the behaviors of each condition alongside the specified groups. The key visual features include:
1) Conditional plots
• The indicator plots the history of each individual condition, excluding the external conditions, as circles at different levels. Opposite conditions appear at positive and negative levels with the same absolute value. The plots for each condition show values only on the bars where they occur.
• Each condition's plot is color-coded based on its type. Aqua and orange plots represent opposing directional conditions, and purple plots represent non-directional conditions. The titles of the plots also contain the condition numbers to which they apply.
• The plots in the separate pane can be turned on or off with the "Show plots in pane" checkbox near the top of the "Settings/Inputs" tab. This input only toggles the color-coded circles, which reduces the graphical load. If you deactivate these visuals, you can still inspect each condition from the script's status line and the Data Window.
• As a bonus, the indicator includes "Up alert" and "Down alert" plots in the Data Window, representing the combined upward and downward ensemble alert conditions. These plots are also usable in additional indicator-on-indicator calculations.
2) Dynamic labels
• The indicator draws a label on the main chart pane displaying the activated group markers (e.g., "M1▲") each time an alert condition occurs.
• The labels for upward alerts appear below chart bars. The labels for downward alerts appear above the bars.
NOTE: This indicator can display up to 500 labels because that is the maximum allowed for a single Pine script.
3) Background highlighting
• The indicator can highlight the main chart's background on bars where upward or downward condition groups activate. Use the "Highlight background" inputs in the "Settings/Inputs" tab to enable these highlights and customize their colors.
• Unlike the dynamic labels, these background highlights are available for all chart bars, irrespective of the number of condition occurrences.
█ NOTES
• This script uses Pine Script™ v6, the latest version of TradingView's programming language. See the Release notes and Migration guide to learn what's new in v6 and how to convert your scripts to this version.
• This script imports our new Alerts library, which features functions that provide high-level simplicity for working with complex compound conditions and alerts. We used the library's `compoundAlertMessage()` function in this indicator. It evaluates items from "bool" arrays in groups specified by an array of strings containing comma-separated index lists , returning a tuple of "string" values containing the marker of each activated group.
• The script imports the latest version of the ta library to calculate several technical indicators not included in the built-in `ta.*` namespace, including Double Exponential Moving Average (DEMA), Triple Exponential Moving Average (TEMA), Fractal Adaptive Moving Average (FRAMA), Tilson T3, Awesome Oscillator (AO), Full Stochastic (%K and %D), SuperTrend, and Donchian Channels.
• The script uses the `force_overlay` parameter in the label.new() and bgcolor() calls to display the drawings and background colors in the main chart pane.
• The plots and hlines use the available `display.*` constants to determine whether the visuals appear in the separate pane.
Look first. Then leap.

Sessions ny vizScript Purpose
This indicator draws a colored background during the New York trading session. It's useful for traders who want to have a visual overview of when the American (NY) trading session is active.
Main Features
NY Session Visualization - draws a gray bar in the background of the chart during NY trading hours (15:00-19:00 CET)
Customization - allows users to:
Set custom session time range
Adjust background color and transparency
Limit display to only the last 24 hours
Input Parameters
sessionRange - session time range (default 15:00-19:00 CET)
sessionColour - background color (default gray with 90% transparency)
onlyLast24Hours - toggle for showing only the last 24 hours (default false)
Technical Details
Script is written in Pine Script version 5
Uses UNIX timestamp for time period calculations
Runs as an overlay indicator (overlay=true), meaning it displays directly on the price chart
Uses the bgcolor() function for background rendering
Contains logic to check if current time is within defined session
Usage
This indicator is useful for:
Monitoring active NY trading session hours
Planning trades during the most liquid hours of the US market
Visual orientation in the chart during different trading sessions

Bitcoin Cycle Master [InvestorUnknown]The "Bitcoin Cycle Master" indicator is designed for in-depth, long-term analysis of Bitcoin's price cycles, using several key metrics to track market behavior and forecast potential price tops and bottoms. The indicator integrates multiple moving averages and on-chain metrics, offering a comprehensive view of Bitcoin’s historical and projected performance. Each of its components plays a crucial role in identifying critical cycle points:
Top Cap: This is a multiple of the Average Cap, which is calculated as the cumulative sum of Bitcoin’s price (price has a longer history than Market Cap) divided by its age in days. Top Cap serves as an upper boundary for speculative price peaks, multiplied by a factor of 35.
Time_dif() =>
date = ta.valuewhen(bar_index == 0, time, 0)
sec_r = math.floor(date / 1000)
min_r = math.floor(sec_r / 60)
h_r = math.floor(min_r / 60)
d_r = math.floor(h_r / 24)
// Launch of BTC
start = timestamp(2009, 1, 3, 00, 00)
sec_rb = math.floor(start / 1000)
min_rb = math.floor(sec_rb / 60)
h_rb = math.floor(min_rb / 60)
d_rb = math.floor(h_rb / 24)
difference = d_r - d_rb
AverageCap() =>
ta.cum(btc_price) / (Time_dif() + btc_age)
TopCap() =>
// To calculate Top Cap, it is first necessary to calculate Average Cap, which is the cumulative sum of Market Cap divided by the age of the market in days.
// This creates a constant time-based moving average of market cap.
// Once Average cap is calculated, those values are multiplied by 35. The result is Top Cap.
// For AverageCap the BTC price was used instead of the MC because it has more history
// (the result should have minimal if any deviation since MC would have to be divided by Supply)
AverageCap() * 35
Delta Top: Defined as the difference between the Realized Cap and the Average Cap, this metric is further multiplied by a factor of 7. Delta Top provides a historically reliable signal for Bitcoin market cycle tops.
DeltaTop() =>
// Delta Cap = Realized Cap - Average Cap
// Average Cap is explained in the Top Cap section above.
// Once Delta Cap is calculated, its values over time are then multiplied by 7. The result is Delta Top.
(RealizedPrice() - AverageCap()) * 7
Terminal Price: Derived from Coin Days Destroyed, Terminal Price normalizes Bitcoin’s historical price behavior by its finite supply (21 million bitcoins), offering an adjusted price forecast as all bitcoins approach being mined. The original formula for Terminal Price didn’t produce expected results, hence the calculation was adjusted slightly.
CVDD() =>
// CVDD stands for Cumulative Value Coin Days Destroyed.
// Coin Days Destroyed is a term used for bitcoin to identify a value of sorts to UTXO’s (unspent transaction outputs). They can be thought of as coins moving between wallets.
(MCR - TV) / 21000000
TerminalPrice() =>
// Theory:
// Before Terminal price is calculated, it is first necessary to calculate Transferred Price.
// Transferred price takes the sum of > Coin Days Destroyed and divides it by the existing supply of bitcoin and the time it has been in circulation.
// The value of Transferred Price is then multiplied by 21. Remember that there can only ever be 21 million bitcoin mined.
// This creates a 'terminal' value as the supply is all mined, a kind of reverse supply adjustment.
// Instead of heavily weighting later behavior, it normalizes historical behavior to today. By normalizing by 21, a terminal value is created
// Unfortunately the theoretical calculation didn't produce results it should, in pinescript.
// Therefore the calculation was slightly adjusted/improvised
TransferredPrice = CVDD() / (Supply * math.log(btc_age))
tp = TransferredPrice * 210000000 * 3
Realized Price: Calculated as the Market Cap Realized divided by the current supply of Bitcoin, this metric shows the average value of Bitcoin based on the price at which coins last moved, giving a market consensus price for long-term holders.
CVDD (Cumulative Value Coin Days Destroyed): This on-chain metric analyzes Bitcoin’s UTXOs (unspent transaction outputs) and the velocity of coins moving between wallets. It highlights key market dynamics during prolonged accumulation or distribution phases.
Balanced Price: The Balanced Price is the difference between the Realized Price and the Terminal Price, adjusted by Bitcoin's supply constraints. This metric provides a useful signal for identifying oversold market conditions during bear markets.
BalancedPrice() =>
// It is calculated by subtracting Transferred Price from Realized Price
RealizedPrice() - (TerminalPrice() / (21 * 3))
Each component can be toggled individually, allowing users to focus on specific aspects of Bitcoin’s price cycle and derive meaningful insights from its long-term behavior. The combination of these models provides a well-rounded view of both speculative peaks and long-term value trends.
Important consideration:
Top Cap did historically provide reliable signals for cycle peaks, however it may not be a relevant indication of peaks in the future.

Daily Moving Average for Intraday TimeframesThis indicator provides a dynamic tool for visualizing the Daily Moving Average (DMA) on intraday timeframes.
It allows you to analyze how the price behaves in relation to the daily moving average in timeframes from 1 minute up to 1 day.
KEY FEATURES
DMA on Intraday timeframes only : This indicator is designed to work exclusively on intraday charts with timeframes between 1 minute and 1 day. It will not function on tick, second-based, or daily-and-above charts.
Color-Coded Zones for Trend Identification :
Green Zone: The price is above a rising DMA, signaling a bullish momentum.
Red Zone: The price is below a falling DMA, signaling a bearish momentum.
Yellow Zone: Signaling uncertainty or mixed conditions, where either the price is above a falling DMA or below a rising/flat DMA.
Configurable DMA Period : You can adjust the number of days over which the DMA is calculated (default is 5 days). This can be customized based on your trading strategy or market preferences.
24/7 Market Option : For assets that trade continuously (e.g., cryptocurrencies), activate the "Is trading 24/7?" setting to ensure accurate calculations.
WHAT IS THE DMA AND WHY USE IT INTRADAY?
The Daily Moving Average is a Simple Moving Average indicator used to smooth out price fluctuations over a specified period (in days) and reveal the underlying trend.
Typically, a SMA takes price value for the current timeframe and reveal the trend for this timeframe. It gives you the average price for the last N candles for the given timeframe.
But what makes the Intraday DMA interesting is that it shows the underlying trend of the Daily timeframe on a chart set on a shorter timeframe . This helps to align intraday trades with broader market movements.
HOW IS THE DMA CALCULATED?
If we are to build a N-day Daily Moving Average using a Simple Moving Average, we need to take the amount of candles A needed in that timeframe to account for a period of a day and multiply it by the number of days N of the desired DMA.
So for instance, let say we want to compute the 5-Day DMA on the 10 minute timeframe :
In the 10 minute timeframe there are 39 candles in a day in the regular session.
We would take the 39 candles per day and then multiply that by 5 days. 39 x 5 = 195.
So a 5-day moving average is represented by a simple moving average with a period of 195 when looking at a 10 minute timeframe.
So for each period, to create a 5-day DMA, you would have to set the period of your simple moving average like so :
- 195 minutes = 10 period
- 130 minutes = 15 period
- 65 minutes = 30 period
- 30 minutes = 65 period
- 15 minutes = 130 period
- 10 minutes = 195 period
- 5 minutes = 390 period
and so on.
This indicator attempts to do this calculation for you on any intraday timeframe and whatever the period you want to use is for your DMA. You can create a 10-day moving average, a 30-day moving average, etc.

Digital Clock with Market Status and AlertsDigital Clock with Market Status and Alerts - 日本語解説は下記
Overview:
The Digital Clock with Market Status and Alerts indicator is designed to display the current time in various global time zones while also providing the status of major financial markets such as Tokyo, London, and New York. This indicator helps traders monitor the open and close times of different markets and alerts them when a market opens. Customizable options are provided for table positioning, background, text colors, and font size.
Key Features:
Real-Time Digital Clock: The indicator shows the current time in your selected time zone (Asia/Tokyo, America/New_York, Europe/London, Australia/Sydney). The time updates in real-time and includes hours, minutes, and seconds, providing a convenient and accurate way to monitor time across different trading sessions.
Global Market Status: Displays the open or closed status of major financial markets.
・Tokyo Market: Open from 9:00 AM to 3:00 PM (JST).
・London Market: Open from 16:00 to 24:00 during summer time and from 17:00 to 1:00 during winter time (JST).
・New York Market: Open from 21:00 to 5:00 during summer time and from 22:00 to 6:00 during winter time (JST).
Customizable Display:
・Background Color: The indicator allows you to set the background color for the clock display, while the leftmost empty cell can be independently customized with its own background color for table alignment.
・Clock and Market Status Colors: Separate color options are available for the clock text, market status during open, and market status during closed periods.
・Text Size: You can adjust the size of the text (small, normal, large) to fit your preferences.
・Table Position: You can position the digital clock and market status table in different locations on the chart: top left, top center, top right, bottom left, bottom center, and bottom right.
Alerts for Market Opening: The indicator will trigger alerts when a market (Tokyo, London, or New York) opens, notifying traders in real-time. This can help ensure that you don't miss any important market openings.
How to Use:
Setup:
Apply the Indicator: Add the Digital Clock with Market Status and Alerts indicator to your chart. Customize the time zone, text size, background colors, and table position based on your preferences.
Monitor Market Status: Watch the market status displayed for Tokyo, London, and New York to keep track of market openings and closings in real-time.
Receive Alerts: The indicator provides built-in alerts for market openings, helping you stay informed when a key market opens for trading.
Time Monitoring:
・Real-Time Clock: The current time is displayed with hours, minutes, and seconds for accurate tracking. The clock updates every second and reflects the selected time zone.
・Global Time Zones: Choose your desired time zone (Tokyo, New York, London, Sydney) to monitor the time most relevant to your trading strategy.
Market Status:
・Tokyo Market: The status will display "Tokyo OPEN" when the Tokyo market is active, and "Tokyo CLOSED" when it is outside of trading hours.
・London Market: Similarly, the indicator will show "London OPEN" or "London CLOSED" depending on whether the London market is currently active.
・New York Market: The New York market status follows the same structure, showing "NY OPEN" or "NY CLOSED."
Customization:
・Table Positioning: Easily move the table to the desired location on the chart to avoid overlap with other chart elements. The leftmost empty cell helps with alignment.
・Text and Background Color: Adjust the text and background colors to suit your personal preferences. You can also set independent colors for open and closed market statuses to easily distinguish between them.
Cautions and Disclaimer:
・Indicator Modifications: This indicator may be updated without prior notice, which could change or remove certain features.
・Trade Responsibility: This indicator is a tool to assist your trading, but responsibility for all trades remains with you. No guarantee of profit or success is implied, and losses can occur. Use it alongside your own analysis and strategy.
Digital Clock with Market Status and Alerts - 解説と使い方
概要:
Digital Clock with Market Status and Alerts インジケーターは、さまざまな世界のタイムゾーンで現在の時刻を表示し、東京、ロンドン、ニューヨークなどの主要な金融市場のステータスを提供します。このインジケーターにより、複数の市場のオープンおよびクローズ時間をリアルタイムで監視でき、市場がオープンする際にアラートを受け取ることができます。テーブルの位置、背景色、テキストカラー、フォントサイズなどのカスタマイズが可能です。
主な機能:
リアルタイムデジタル時計: 選択したタイムゾーン(東京、ニューヨーク、ロンドン、シドニー)の現在時刻を表示します。リアルタイムで更新され、時間、分、秒を正確に表示します。
世界の市場ステータス: 主要な金融市場のオープン/クローズ状況を表示します。
・東京市場: 午前9時~午後3時(日本時間)。
・ロンドン市場: 夏時間では16時~24時、冬時間では17時~1時(日本時間)。
・ニューヨーク市場: 夏時間では21時~5時、冬時間では22時~6時(日本時間)。
カスタマイズ可能な表示設定:
・背景色: 時計表示の背景色を設定できます。また、テーブルの左側に空白のセルを配置し、独立した背景色を設定することでテーブルの配置調整が可能です。
・時計と市場ステータスの色: 時計テキスト、オープン市場、クローズ市場の色を個別に設定できます。
・テキストサイズ: 小、標準、大から選択し、テキストサイズをカスタマイズ可能です。
・テーブル位置: デジタル時計と市場ステータスのテーブルをチャートのさまざまな場所(左上、中央上、右上、左下、中央下、右下)に配置できます。
市場オープン時のアラート: 市場(東京、ロンドン、ニューヨーク)がオープンするときにアラートを発し、リアルタイムで通知されます。これにより、重要な市場のオープン時間を逃さないようサポートします。
使い方:
セットアップ:
インジケーターを適用: チャートに「Digital Clock with Market Status and Alerts」インジケーターを追加し、タイムゾーン、テキストサイズ、背景色、テーブル位置を好みに応じてカスタマイズします。
市場ステータスを確認: 東京、ロンドン、ニューヨークの市場ステータスをリアルタイムで表示し、オープン/クローズ時間を把握できます。
アラートを受け取る: 市場オープン時のアラート機能により、重要な市場のオープンを見逃さないように通知が届きます。
時間管理:
・リアルタイム時計: 現在の時刻が秒単位で表示され、選択したタイムゾーンに基づいて正確に追跡できます。
・グローバルタイムゾーン: 東京、ニューヨーク、ロンドン、シドニーなど、トレードに関連するタイムゾーンを選択して監視できます。
市場ステータス:
・東京市場: 東京市場が開いていると「Tokyo OPEN」と表示され、閉じている場合は「Tokyo CLOSED」と表示されます。
・ロンドン市場: 同様に、「London OPEN」または「London CLOSED」が表示され、ロンドン市場のステータスを確認できます。
・ニューヨーク市場: ニューヨーク市場も「NY OPEN」または「NY CLOSED」で現在の状況が表示されます。
カスタマイズ:
・テーブル位置の調整: テーブルの位置を簡単に調整し、チャート上の他の要素と重ならないように配置できます。左側の空白セルで位置調整が可能です。
・テキストと背景色のカスタマイズ: テキストと背景の色を自分の好みに合わせて調整できます。また、オープン時とクローズ時の市場ステータスを区別するため、独立した色設定が可能です。
注意事項と免責事項:
・インジケーターの変更: このインジケーターは、予告なく変更や機能の削除が行われる場合があります。
・トレード責任: このインジケーターはトレードをサポートするツールであり、トレードに関する全責任はご自身にあります。利益を保証するものではなく、損失が発生する可能性があります。自分の分析や戦略と組み合わせて使用してください。

KillZones + ACD Fisher [TradingFinder] Sessions + Reversal Level🔵 Introduction
🟣 ACD Method
"The Logical Trader" opens with a thorough exploration of the ACD Methodology, which focuses on pinpointing particular price levels associated with the opening range.
This approach enables traders to establish reference points for their trades, using "A" and "C" points as entry markers. Additionally, the book covers the concept of the "Pivot Range" and how integrating it with the ACD method can help maximize position size while minimizing risk.
🟣 Session
The forex market is operational 24 hours a day, five days a week, closing only on Saturdays and Sundays. Typically, traders prefer to concentrate on one specific forex trading session rather than attempting to trade around the clock.
Trading sessions are defined time periods when a particular financial market is active, allowing for the execution of trades.
The most crucial trading sessions within the 24-hour cycle are the Asia, London, and New York sessions, as these are when substantial money flows and liquidity enter the market.
🟣 Kill Zone
Traders in financial markets earn profits by capitalizing on the difference between their buy/sell prices and the prevailing market prices.
Traders vary in their trading timelines.Some traders engage in daily or even hourly trading, necessitating activity during periods with optimal trading volumes and notable price movements.
Kill zones refer to parts of a session characterized by higher trading volumes and increased price volatility compared to the rest of the session.
🔵 How to Use
🟣 Session Times
The "Asia Session" comprises two parts: "Sydney" and "Tokyo." This session begins at 23:00 and ends at 06:00 UTC. The "Asia KillZone" starts at 23:00 and ends at 03:55 UTC.
The "London Session" includes "Frankfurt" and "London," starting at 07:00 and ending at 14:25 UTC. The "London KillZone" runs from 07:00 to 09:55 UTC.
The "New York" session starts at 14:30 and ends at 19:25 UTC, with the "New York am KillZone" beginning at 14:30 and ending at 22:55 UTC.
🟣 ACD Methodology
The ACD strategy is versatile, applicable to various markets such as stocks, commodities, and forex, providing clear buy and sell signals to set price targets and stop losses.
This strategy operates on the premise that the opening range of trades holds statistical significance daily, suggesting that initial market movements impact the market's behavior throughout the day.
Known as a breakout strategy, the ACD method thrives in volatile or strongly trending markets like crude oil and stocks.
Some key rules for employing the ACD strategy include :
Utilize points A and C as critical reference points, continually monitoring these during trades as they act as entry and exit markers.
Analyze daily and multi-day pivot ranges to understand market trends. Prices above the pivots indicate an upward trend, while prices below signal a downward trend.
In forex trading, the ACD strategy can be implemented using the ACD indicator, a technical tool that gauges the market's supply and demand balance. By evaluating trading volume and price, this indicator assists traders in identifying trend strength and optimal entry and exit points.
To effectively use the ACD indicator, consider the following :
Identifying robust trends: The ACD indicator can help pinpoint strong, consistent market trends.
Determining entry and exit points: ACD generates buy and sell signals to optimize trade timing.
Bullish Setup :
When the "A up" line is breached, it’s wise to wait briefly to confirm it’s not a "Fake Breakout" and that the price stabilizes above this line.
Upon entering the trade, the most effective stop loss is positioned below the "A down" line. It's advisable to backtest this to ensure the best outcomes. The recommended reward-to-risk ratio for this strategy is 1, which should also be verified through backtesting.
Bearish Setup :
When the "A down" line is breached, it’s prudent to wait briefly to ensure it’s not a "Fake Breakout" and that the price stabilizes below this line.
Upon entering the trade, the most effective stop loss is positioned above the "A up" line. Backtesting is recommended to confirm the best results. The recommended reward-to-risk ratio for this strategy is 1, which should also be validated through backtesting.
Advantages of Combining Kill Zone and ACD Method in Market Analysis :
Precise Trade Timing : Integrating the Kill Zone strategy with the ACD Method enhances precision in trade entries and exits. The ACD Method identifies key points for trading, while the Kill Zone focuses on high-activity periods, together ensuring optimal timing for trades.
Better Trend Identification : The ACD Method’s pivot ranges help spot market trends, and when combined with the Kill Zone’s emphasis on periods of significant price movement, traders can more effectively identify and follow strong market trends.
Maximized Profits and Minimized Risks : The ACD Method's structured approach to setting price targets and stop losses, coupled with the Kill Zone's high-volume trading periods, helps maximize profit potential while reducing risk.
Robust Risk Management : Combining these methods provides a comprehensive risk management strategy, strategically placing stop losses and protecting capital during volatile periods.
Versatility Across Markets : Both methods are applicable to various markets, including stocks, commodities, and forex, offering flexibility and adaptability in different trading environments.
Enhanced Confidence : Using the combined insights of the Kill Zone and ACD Method, traders gain confidence in their decision-making process, reducing emotional trading and improving consistency.
By merging the Kill Zone’s focus on trading volumes and the ACD Method’s structured breakout strategy, traders benefit from a synergistic approach that enhances precision, trend identification, and risk management across multiple markets.

Volatility and Volume by Hour EXT(Extended republication, use this instead of the old one)
The goal of this indicator is to show a “characteristic” of the instrument, regarding the price change and trading volume. You can see how the instrument “behaved” throughout the day in the lookback period. I've found this useful for timing in day trading.
The indicator creates a table on the chart to display various statistics for each hour of the day.
Important: ONLY SHOWS THE TABLE IF THE CHART’S TIMEFRAME IS 1H!
Explanation of the columns:
1. Volatility Percentage (Volat): This column shows the volatility of the price as a percentage. For example, a value of "15%" means the price movement was 15% of the total daily price movement within the hour.
2. Hourly Point Change (PointCh): This column shows the change in price points for each hour in the lookback period. For example, a value of "5" means the price has increased by 5 points in the hour, while "-3" means it has decreased by 3 points.
3. Hourly Point Change Percentage (PrCh% (LeverageX)): This column shows the percentage change in price points for each hour, adjusted with leverage multiplier. Displayed green (+) or red (-) accordingly. For example, a value of "10%" with a leverage of 2X means the price has effectively changed by 5% due to the leverage.
4. Trading Volume Percentage (TrVol): This column shows the percentage of the daily total volume that was traded in a specific hour. For example, a value of "10%" would mean that 10% of the day's total trading volume occurred in that hour.
5. Added New! - Relevancy Check: The indicator checks the last 24 candle. If the direction of the price movement was the same in the last 24 hour as the statistical direction in that hour, the background of the relevant hour in the second column goes green.
For example: if today at 9 o'clock the price went lower, so as at 9 o'clock in the loopback period, the instrument "behaves" according to statistics . So the statistics is probably more relevant for today. The more green background row the more relevancy.
Settings:
1. Lookback period: The lookback period is the number of previous bars from which data is taken to perform calculations. In this script, it's used in a loop that iterates over a certain number of past bars to calculate the statistics. TIP: Select a period the contains a trend in one direction, because an upward and a downward trend compensate the price movement in opposite directions.
2. Timezone: This is a string input that represents the user's timezone. The default value is "UTC+2". Adjust it to your timezone in order to view the hours properly.
3. Leverage: The default value is 10(!). This input is used to adjust the hourly point change percentage. For FOREX traders (for example) the statistics can show the leveraged percentage of price change. Set that according the leverage you trade the instrument with.
Use at your own risk, provided “as is” basis!
Hope you find it useful! Cheers!
Rolling VWAPThe Rolling VWAP indicator is a powerful technical analysis tool designed to help traders identify significant price levels and potential reversal points. This indicator combines a rolling volume-weighted average price (VWAP) with multiple standard deviation bands to provide a dynamic view of price volatility and market trends.
Key Features:
Rolling VWAP Calculation: The indicator calculates the VWAP using the high, low, and close prices (HLC3) over a user-defined rolling period. This VWAP is then plotted on the chart, providing a reliable benchmark for average price levels over a specified timeframe.
Adjustable Timeframes: Users can select from multiple timeframes (1 hour, 4 hours, 1 day, 3 days, 1 week) to calculate the RVWAP, allowing flexibility to analyze market trends over different periods.
Multiple Standard Deviation Bands: The indicator includes up to five adjustable standard deviation bands, each with customizable multipliers. These bands are plotted around the RVWAP to indicate potential support and resistance levels, helping traders identify areas of high and low volatility.
Customizable Display Settings: Users can toggle the visibility of each band and adjust their colors and transparency, making it easy to tailor the indicator to their specific analysis needs.
How to Use:
Selecting the VWAP Timeframe: Choose the desired timeframe for VWAP calculation from the options provided (1 hour, 4 hours, 1 day, 3 days, 1 week). This allows you to analyze price action over different periods and identify significant trends.
Adjusting Band Multipliers: Customize the multipliers for each standard deviation band to suit your trading strategy. By default, the indicator includes bands with multipliers of 2.0, 2.5, 3.0, 3.5, and 4.0. Adjust these values based on your preferred levels of price deviation.
Interpreting the Bands: The standard deviation bands provide key insights into market volatility. Inner Bands (e.g., 2.0 StdDev) indicate areas of normal price fluctuation. Price movement within these bands is generally considered stable. Outer Bands (e.g., 3.5 or 4.0 StdDev) highlight extreme price deviations. Price reaching these bands may signal overbought or oversold conditions, potentially leading to reversals.
Combining with Other Indicators: Enhance your analysis by using this indicator in conjunction with other technical tools such as moving averages, RSI, or MACD. This helps confirm signals and improve trading decisions.
Best Practices:
Trend Identification: Use the Rolling VWAP to identify the prevailing market trend. A rising VWAP indicates an uptrend, while a falling VWAP suggests a downtrend.
Support and Resistance Levels: The standard deviation bands act as dynamic support and resistance levels. Monitor price action around these bands for potential entry and exit points.
Volatility Analysis: Wider bands indicate higher market volatility, while narrower bands suggest lower volatility. Adjust your trading strategy accordingly based on the observed volatility levels.
24/7 Trading Instruments: This indicator is particularly useful for instruments that trade 24/7 and do not have defined sessions, such as cryptocurrencies. Unlike a session-anchored VWAP, the rolling VWAP provides a continuous measure of average price levels, making it ideal for analyzing markets that operate around the clock.
By integrating the Rolling VWAP indicator into your trading routine, you can gain a deeper understanding of price dynamics and make more informed trading decisions. Whether you are a day trader, swing trader, or long-term investor, this indicator provides valuable insights to help you navigate the markets with confidence.
chrono_utilsLibrary "chrono_utils"
Collection of objects and common functions that are related to datetime windows session days and time
ranges. The main purpose of this library is to handle time-related functionality and make it easy to reason about a
future bar checking if it will be part of a predefined session and/or inside a datetime window. All existing session
functionality I found in the documentation e.g. "not na(time(timeframe, session, timezone))" are not suitable for
strategy scripts, since the execution of the orders is delayed by one bar, due to the script execution happening at
the bar close. Moreover, a history operator with a negative value that looks forward is not allowed in any pinescript
expression. So, a prediction for the next bar using the bars_back argument of "time()"" and "time_close()" was
necessary. Thus, I created this library to overcome this small but very important limitation. In the meantime, I
added useful functionality to handle session-based behavior. An interesting utility that emerged from this
development is the data anomaly detection where a comparison between the prediction and the actual value is happening.
If those two values are different then a data inconsistency happened between the prediction bar and the actual bar
(probably due to a holiday, half session day, a timezone change etc..)
exTimezone(timezone)
exTimezone - Convert extended timezone to timezone string
Parameters:
timezone (simple string) : - The timezone or a special string
Returns: string representing the timezone
nameOfDay(day)
nameOfDay - Convert the day id into a short nameOfDay
Parameters:
day (int) : - The day id to convert
Returns: - The short name of the day
today()
today - Get the day id of this day
Returns: - The day id
nthDayAfter(day, n)
nthDayAfter - Get the day id of n days after the given day
Parameters:
day (int) : - The day id of the reference day
n (int) : - The number of days to go forward
Returns: - The day id of the day that is n days after the reference day
nextDayAfter(day)
nextDayAfter - Get the day id of next day after the given day
Parameters:
day (int) : - The day id of the reference day
Returns: - The day id of the next day after the reference day
nthDayBefore(day, n)
nthDayBefore - Get the day id of n days before the given day
Parameters:
day (int) : - The day id of the reference day
n (int) : - The number of days to go forward
Returns: - The day id of the day that is n days before the reference day
prevDayBefore(day)
prevDayBefore - Get the day id of previous day before the given day
Parameters:
day (int) : - The day id of the reference day
Returns: - The day id of the previous day before the reference day
tomorrow()
tomorrow - Get the day id of the next day
Returns: - The next day day id
normalize(num, min, max)
normalizeHour - Check if number is inthe range of
Parameters:
num (int)
min (int)
max (int)
Returns: - The normalized number
normalizeHour(hourInDay)
normalizeHour - Check if hour is valid and return a noralized hour range from
Parameters:
hourInDay (int)
Returns: - The normalized hour
normalizeMinute(minuteInHour)
normalizeMinute - Check if minute is valid and return a noralized minute from
Parameters:
minuteInHour (int)
Returns: - The normalized minute
monthInMilliseconds(mon)
monthInMilliseconds - Calculate the miliseconds in one bar of the timeframe
Parameters:
mon (int) : - The month of reference to get the miliseconds
Returns: - The number of milliseconds of the month
barInMilliseconds()
barInMilliseconds - Calculate the miliseconds in one bar of the timeframe
Returns: - The number of milliseconds in one bar
method to_string(this)
to_string - Formats the time window into a human-readable string
Namespace types: DateTimeWindow
Parameters:
this (DateTimeWindow) : - The time window object with the from and to datetimes
Returns: - The string of the time window
method to_string(this)
to_string - Formats the session days into a human-readable string with short day names
Namespace types: SessionDays
Parameters:
this (SessionDays) : - The session days object with the day selection
Returns: - The string of the session day short names
method to_string(this)
to_string - Formats the session time into a human-readable string
Namespace types: SessionTime
Parameters:
this (SessionTime) : - The session time object with the hour and minute of the time of the day
Returns: - The string of the session time
method to_string(this)
to_string - Formats the session time into a human-readable string
Namespace types: SessionTimeRange
Parameters:
this (SessionTimeRange) : - The session time range object with the start and end time of the daily session
Returns: - The string of the session time
method to_string(this)
to_string - Formats the session into a human-readable string
Namespace types: Session
Parameters:
this (Session) : - The session object with the day and the time range selection
Returns: - The string of the session
method init(this, fromDateTime, toDateTime)
init - Initialize the time window object from boolean values of each session day
Namespace types: DateTimeWindow
Parameters:
this (DateTimeWindow) : - The time window object that will hold the from and to datetimes
fromDateTime (int) : - The starting datetime of the time window
toDateTime (int) : - The ending datetime of the time window
Returns: - The time window object
method init(this, refTimezone, chTimezone, fromDateTime, toDateTime)
init - Initialize the time window object from boolean values of each session day
Namespace types: DateTimeWindow
Parameters:
this (DateTimeWindow) : - The time window object that will hold the from and to datetimes
refTimezone (simple string) : - The timezone of reference of the 'from' and 'to' dates
chTimezone (simple string) : - The target timezone to convert the 'from' and 'to' dates
fromDateTime (int) : - The starting datetime of the time window
toDateTime (int) : - The ending datetime of the time window
Returns: - The time window object
method init(this, sun, mon, tue, wed, thu, fri, sat)
init - Initialize the session days object from boolean values of each session day
Namespace types: SessionDays
Parameters:
this (SessionDays) : - The session days object that will hold the day selection
sun (bool) : - Is Sunday a trading day?
mon (bool) : - Is Monday a trading day?
tue (bool) : - Is Tuesday a trading day?
wed (bool) : - Is Wednesday a trading day?
thu (bool) : - Is Thursday a trading day?
fri (bool) : - Is Friday a trading day?
sat (bool) : - Is Saturday a trading day?
Returns: - The session days object
method init(this, unixTime)
init - Initialize the object from the hour and minute of the session time in exchange timezone (syminfo.timezone)
Namespace types: SessionTime
Parameters:
this (SessionTime) : - The session time object with the hour and minute of the time of the day
unixTime (int) : - The unix time
Returns: - The session time object
method init(this, hourInDay, minuteInHour)
init - Initialize the object from the hour and minute of the session time in exchange timezone (syminfo.timezone)
Namespace types: SessionTime
Parameters:
this (SessionTime) : - The session time object with the hour and minute of the time of the day
hourInDay (int) : - The hour of the time
minuteInHour (int) : - The minute of the time
Returns: - The session time object
method init(this, hourInDay, minuteInHour, refTimezone)
init - Initialize the object from the hour and minute of the session time
Namespace types: SessionTime
Parameters:
this (SessionTime) : - The session time object with the hour and minute of the time of the day
hourInDay (int) : - The hour of the time
minuteInHour (int) : - The minute of the time
refTimezone (string) : - The timezone of reference of the 'hour' and 'minute'
Returns: - The session time object
method init(this, startTime, endTime)
init - Initialize the object from the start and end session time in exchange timezone (syminfo.timezone)
Namespace types: SessionTimeRange
Parameters:
this (SessionTimeRange) : - The session time range object that will hold the start and end time of the daily session
startTime (SessionTime) : - The time the session begins
endTime (SessionTime) : - The time the session ends
Returns: - The session time range object
method init(this, startTimeHour, startTimeMinute, endTimeHour, endTimeMinute, refTimezone)
init - Initialize the object from the start and end session time
Namespace types: SessionTimeRange
Parameters:
this (SessionTimeRange) : - The session time range object that will hold the start and end time of the daily session
startTimeHour (int) : - The time hour the session begins
startTimeMinute (int) : - The time minute the session begins
endTimeHour (int) : - The time hour the session ends
endTimeMinute (int) : - The time minute the session ends
refTimezone (string)
Returns: - The session time range object
method init(this, days, timeRanges)
init - Initialize the session object from session days and time range
Namespace types: Session
Parameters:
this (Session) : - The session object that will hold the day and the time range selection
days (SessionDays) : - The session days object that defines the days the session is happening
timeRanges (array) : - The array of all the session time ranges during a session day
Returns: - The session object
method init(this, days, timeRanges, names, colors)
init - Initialize the session object from session days and time range
Namespace types: SessionView
Parameters:
this (SessionView) : - The session view object that will hold the session, the names and the color selections
days (SessionDays) : - The session days object that defines the days the session is happening
timeRanges (array) : - The array of all the session time ranges during a session day
names (array) : - The array of the names of the sessions
colors (array) : - The array of the colors of the sessions
Returns: - The session object
method get_size_in_secs(this)
get_size_in_secs - Count the seconds from start to end in the given timeframe
Namespace types: DateTimeWindow
Parameters:
this (DateTimeWindow) : - The time window object with the from and to datetimes
Returns: - The number of seconds inside the time widow for the given timeframe
method get_size_in_secs(this)
get_size_in_secs - Calculate the seconds inside the session
Namespace types: SessionTimeRange
Parameters:
this (SessionTimeRange) : - The session time range object with the start and end time of the daily session
Returns: - The number of seconds inside the session
method get_size_in_bars(this)
get_size_in_bars - Count the bars from start to end in the given timeframe
Namespace types: DateTimeWindow
Parameters:
this (DateTimeWindow) : - The time window object with the from and to datetimes
Returns: - The number of bars inside the time widow for the given timeframe
method get_size_in_bars(this)
get_size_in_bars - Calculate the bars inside the session
Namespace types: SessionTimeRange
Parameters:
this (SessionTimeRange) : - The session time range object with the start and end time of the daily session
Returns: - The number of bars inside the session for the given timeframe
method is_bar_included(this, offset_forward)
is_bar_included - Check if the given bar is between the start and end dates of the window
Namespace types: DateTimeWindow
Parameters:
this (DateTimeWindow) : - The time window object with the from and to datetimes
offset_forward (simple int) : - The number of bars forward. Default is 1
Returns: - Whether the current bar is inside the datetime window
method is_bar_included(this, offset_forward)
is_bar_included - Check if the given bar is inside the session as defined by the input params (what "not na(time(timeframe.period, this.to_sess_string()) )" should return if you could write it
Namespace types: Session
Parameters:
this (Session) : - The session with the day and the time range selection
offset_forward (simple int) : - The bar forward to check if it is between the from and to datetimes. Default is 1
Returns: - Whether the current time is inside the session
method to_sess_string(this)
to_sess_string - Formats the session days into a session string with day ids
Namespace types: SessionDays
Parameters:
this (SessionDays) : - The session days object
Returns: - The string of the session day ids
method to_sess_string(this)
to_sess_string - Formats the session time into a session string
Namespace types: SessionTime
Parameters:
this (SessionTime) : - The session time object with the hour and minute of the time of the day
Returns: - The string of the session time
method to_sess_string(this)
to_sess_string - Formats the session time into a session string
Namespace types: SessionTimeRange
Parameters:
this (SessionTimeRange) : - The session time range object with the start and end time of the daily session
Returns: - The string of the session time
method to_sess_string(this)
to_sess_string - Formats the session into a session string
Namespace types: Session
Parameters:
this (Session) : - The session object with the day and the time range selection
Returns: - The string of the session
method from_sess_string(this, sess)
from_sess_string - Initialize the session days object from the session string
Namespace types: SessionDays
Parameters:
this (SessionDays) : - The session days object that will hold the day selection
sess (string) : - The session string part that represents the days
Returns: - The session days object
method from_sess_string(this, sess)
from_sess_string - Initialize the session time object from the session string in exchange timezone (syminfo.timezone)
Namespace types: SessionTime
Parameters:
this (SessionTime) : - The session time object that will hold the hour and minute of the time
sess (string) : - The session string part that represents the time HHmm
Returns: - The session time object
method from_sess_string(this, sess, refTimezone)
from_sess_string - Initialize the session time object from the session string
Namespace types: SessionTime
Parameters:
this (SessionTime) : - The session time object that will hold the hour and minute of the time
sess (string) : - The session string part that represents the time HHmm
refTimezone (simple string) : - The timezone of reference of the 'hour' and 'minute'
Returns: - The session time object
method from_sess_string(this, sess)
from_sess_string - Initialize the session time range object from the session string in exchange timezone (syminfo.timezone)
Namespace types: SessionTimeRange
Parameters:
this (SessionTimeRange) : - The session time range object that will hold the start and end time of the daily session
sess (string) : - The session string part that represents the time range HHmm-HHmm
Returns: - The session time range object
method from_sess_string(this, sess, refTimezone)
from_sess_string - Initialize the session time range object from the session string
Namespace types: SessionTimeRange
Parameters:
this (SessionTimeRange) : - The session time range object that will hold the start and end time of the daily session
sess (string) : - The session string part that represents the time range HHmm-HHmm
refTimezone (simple string) : - The timezone of reference of the time ranges
Returns: - The session time range object
method from_sess_string(this, sess)
from_sess_string - Initialize the session object from the session string in exchange timezone (syminfo.timezone)
Namespace types: Session
Parameters:
this (Session) : - The session object that will hold the day and the time range selection
sess (string) : - The session string that represents the session HHmm-HHmm,HHmm-HHmm:ddddddd
Returns: - The session time range object
method from_sess_string(this, sess, refTimezone)
from_sess_string - Initialize the session object from the session string
Namespace types: Session
Parameters:
this (Session) : - The session object that will hold the day and the time range selection
sess (string) : - The session string that represents the session HHmm-HHmm,HHmm-HHmm:ddddddd
refTimezone (simple string) : - The timezone of reference of the time ranges
Returns: - The session time range object
method nth_day_after(this, day, n)
nth_day_after - The nth day after the given day that is a session day (true) in the object
Namespace types: SessionDays
Parameters:
this (SessionDays) : - The session days object with the day selection
day (int) : - The day id of the reference day
n (int) : - The number of days after
Returns: - The day id of the nth session day of the week after the given day
method nth_day_before(this, day, n)
nth_day_before - The nth day before the given day that is a session day (true) in the object
Namespace types: SessionDays
Parameters:
this (SessionDays) : - The session days object with the day selection
day (int) : - The day id of the reference day
n (int) : - The number of days after
Returns: - The day id of the nth session day of the week before the given day
method next_day(this)
next_day - The next day that is a session day (true) in the object
Namespace types: SessionDays
Parameters:
this (SessionDays) : - The session days object with the day selection
Returns: - The day id of the next session day of the week
method previous_day(this)
previous_day - The previous day that is session day (true) in the object
Namespace types: SessionDays
Parameters:
this (SessionDays) : - The session days object with the day selection
Returns: - The day id of the previous session day of the week
method get_sec_in_day(this)
get_sec_in_day - Count the seconds since the start of the day this session time represents
Namespace types: SessionTime
Parameters:
this (SessionTime) : - The session time object with the hour and minute of the time of the day
Returns: - The number of seconds passed from the start of the day until that session time
method get_ms_in_day(this)
get_ms_in_day - Count the milliseconds since the start of the day this session time represents
Namespace types: SessionTime
Parameters:
this (SessionTime) : - The session time object with the hour and minute of the time of the day
Returns: - The number of milliseconds passed from the start of the day until that session time
method is_day_included(this, day)
is_day_included - Check if the given day is inside the session days
Namespace types: SessionDays
Parameters:
this (SessionDays) : - The session days object with the day selection
day (int) : - The day to check if it is a trading day
Returns: - Whether the current day is included in the session days
DateTimeWindow
DateTimeWindow - Object that represents a datetime window with a beginning and an end
Fields:
fromDateTime (series int) : - The beginning of the datetime window
toDateTime (series int) : - The end of the datetime window
SessionDays
SessionDays - Object that represent the trading days of the week
Fields:
days (map) : - The map that contains all days of the week and their session flag
SessionTime
SessionTime - Object that represents the time (hour and minutes)
Fields:
hourInDay (series int) : - The hour of the day that ranges from 0 to 24
minuteInHour (series int) : - The minute of the hour that ranges from 0 to 59
minuteInDay (series int) : - The minute of the day that ranges from 0 to 1440. They will be calculated based on hourInDay and minuteInHour when method is called
SessionTimeRange
SessionTimeRange - Object that represents a range that extends from the start to the end time
Fields:
startTime (SessionTime) : - The beginning of the time range
endTime (SessionTime) : - The end of the time range
isOvernight (series bool) : - Whether or not this is an overnight time range
Session
Session - Object that represents a session
Fields:
days (SessionDays) : - The map of the trading days
timeRanges (array) : - The array with all time ranges of the session during the trading days
SessionView
SessionView - Object that visualize a session
Fields:
sess (Session) : - The Session object to be visualized
names (array) : - The names of the session time ranges
colors (array) : - The colors of the session time ranges

Periodic Activity Tracker [LuxAlgo]The Periodic Activity Tracker tool periodically tracks the cumulative buy and sell volume in a user-defined period and draws the corresponding matching bars and volume delta for each period.
Users can select a predefined aggregation period from the following options: Hourly, Daily, Weekly, and Monthly.
🔶 USAGE
This tool provides a simple and clear way of analyzing volumes for each aggregated period and is made up of the following elements:
Buy and sell volumes by period as red and green lines with color gradient area
Delta (difference) between buy & sell volume for each period
Buy & sell volume bars for each period
Separator between lines and bars, and period tags below each pair of bars for ease of reading
On the chart above we can see all the elements displayed, the volume level on the lines perfectly matches the volume level on the bars for each period.
In this case, the tool has the default settings so the anchor period is set to Daily and we can see how the period tag (each day of the week) is displayed below each pair of bars.
Users can disable the delta display and adjust the bar size.
🔹 Reading The Tool
In trading, assessing the strength of the bulls (buyers) and bears (sellers) is key to understanding the current trading environment. Which side, if any, has the upper hand? To answer this question, some traders look at volume in relation to price.
This tool provides you with a view of buy volume versus sell volume, allowing you to compare both sides of the market.
As with any volume tool, the key is to understand when the forces of the two groups are balanced or unbalanced.
As we can observe on the chart:
NOV '23: Buy volume greater than sell volume, both moving up close together, flat delta. We can see that the price is in range.
DEC '23: Buy volume bigger than Sell volume, both moving up but with a bigger difference, bigger delta than last month but still flat. We can see the price in the range above last month's range.
JAN '24: Buy and sell volume tied together, no delta whatsoever. We can see the price in range but testing above and below last month's range.
FEB '24: Buy volume explodes higher and sell volume cannot keep up, big growing delta. Price explodes higher above last month's range.
Traders need to understand that there is always an equal number of buyers and sellers in a liquid market, the quality here is how aggressive or passive they are. Who is 'attacking' and who is 'defending', who is using market orders to move prices, and who is using limit orders waiting to be filled?
This tool gives you the following information:
Lines: if the top line is green, the buyers are attacking, if it is red, the sellers are attacking.
Delta: represents the difference in their strength, if it is above 0 the buyers are stronger, if it is below 0 the sellers are stronger.
Bars: help you to see the difference in strength between buyers and sellers for each period at a glance.
🔹 Anchor Period
By default, the tool is set to Hourly. However, users can select from a number of predefined time periods.
Depending on the user's selection, the bars are displayed as follows:
Hourly : hours of the current day
Daily : days of the current week
Weekly : weeks of the current month
Monthly : months of the current year
On the chart above we can see the four periods displayed, starting at the top left and moving clockwise we have hourly, daily, weekly, and monthly.
🔶 DETAILS
🔹 Chart TimeFrame
The chart timeframe has a direct impact on the visualization of the tool, and the user should select a chart timeframe that is compatible with the Anchor period in the tool's settings panel.
For the chart timeframe to be compatible it must be less than the Anchor period parameter. If the user selects an incompatible chart timeframe, a warning message will be displayed.
As a rule of thumb, the smaller the chart timeframe, the more data the tool will collect, returning indications for longer-term price variations.
These are the recommended chart timeframes for each period:
Hourly : 5m charts or lower
Daily : 1H charts or lower
Weekly : 4H charts or lower
Monthly : 1D charts or lower
🔹 Warnings
This chart shows both types of warnings the user may receive
At the top, we can see the warning that is given when the 'Bar Width' parameter exceeds the allowed value.
At the bottom is the incompatible chart timeframe warning, which prompts the user to select a smaller chart timeframe or a larger "Anchor Period" parameter.
🔶 SETTINGS
🔹 Data Gathering
Anchor period: Time period representing each bar: hours of the day, days of the week, weeks of the month, and months of the year. The timeframe of the chart must be less than this parameter, otherwise a warning will be displayed.
🔹 Style
Bars width: Size of each bar, there is a maximum limit so a warning will be displayed if it is reached.
Volume color
Delta: Enable/Disable Delta Area Display

Tops & Bottoms - Day of Week Report█ OVERVIEW
The indicator tracks when the weekly tops and bottoms occur and reports the statistics by the days of the week.
█ CONCEPTS
Not all the days of the week are equal, and the market dynamic can follow through or shift over the trading week. Tops and bottoms are vital when entering a trade, as they will decide if you are catching the train or being straight offside. They are equally crucial when exiting a position, as they will determine if you are closing at the optimal price or seeing your unrealized profits vanish.
This indicator is before all for educational purposes. It aims to make the knowledge available to all traders, facilitate understanding of the various markets, and ultimately get to know your trading pairs by heart (and saving a lot of your time backtesting!).
USDJPY tops and bottoms percentages on any given week.
USDJPY tops and bottoms percentages on up weeks versus down weeks.
█ FEATURES
Custom interval
By default, the indicator uses the weekly interval defined by the symbol (e.g., Monday to Sunday). This option allows you to specify your custom interval.
Weekly interval type filter
Analyze the weekly interval on any weeks, up weeks, or down weeks.
Configurable time range filter
Select the period to report from.
█ NOTES
Trading session
The indicator analyzes the days of the week from the daily chart. The daily trading sessions are defined by the symbol (e.g., 17:00 - 17:00 on EURUSD).
Extended/electronic trading session
The indicator can include the extended hours when activated on the chart, using the 24-hour or 1440-minute timeframe.
█ HOW TO USE
Plot the indicator and navigate on the 1-day or 24-hour timeframe.
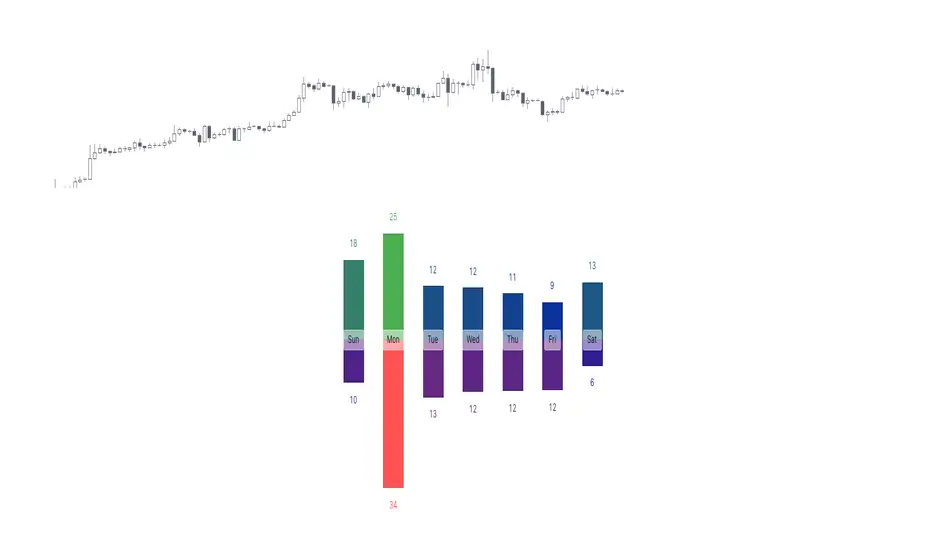
Cast ForwardThis indicator will not forecast price action. It will not predict price movement nor will it in any way predict the outcome of any trade you may take. This is not a signal for buying or selling. You must do your own back testing and analysis for trading.
Time and price are the two most important components of market data. Where was price at what time? To help visualize this question I created this indicator. It allows for the previous session data to be overlayed onto the chart offset forward 24 hours. What this means is that you have the high, (high/low)/2, and low of each candle plotted on top of your chart for the time frame of the current chart, but offset so that the data from the current candle has the data from the corresponding candle 24 hours prior lined up on the x-axis.
SMA Logic: I used the SMA (Simple Moving Average) function with a length of 1 to plot the data points without any smoothing to give the true values of the data.
For Intraday Charting
For Electronic Trading Hours:
In order to line up the data correctly, for intraday charts, I used the current chart timeframe and divided it into 1380 (number of minutes in the 23 hour futures market trading day) to set the data offset. Using the same math logic, this indicator also gives the correct correlated data on the 30 second time frame. If the chart time frame that is currently being used does not allow for correct data correlation (not a factor of 1380) it will not plot the data.
For Regular Trading Hours:
In order to line up the data correctly, for intraday charts, I used the current chart timeframe and divided it into 405 (number of minutes in the 6 hour 45 minutes New York regular session trading day, including the 15 minute settlement time) to set the data offset. This indicator also gives the correct correlated data on the 30 second time frame. If the chart time frame that is currently being used does not allow for correct data correlation (not a factor of 405) it will not plot the data.
For the Daily Chart:
This indicator plots a visualization of the 20-40-60 day IPDA data range; (The IPDA data range helps traders identify liquidity, price gaps, and equilibrium points in the market, providing insights for optimal trade entries and market structure shifts). It does this using the same SMA logic as the intraday plot. What this means is it offsets the historical data of the daily chart 20, 40, or 60 bars forward. You can plot any combination of the three on the chart at one time, but these will not show on the intraday chart. This allows for visualization of where the market will possibly seek liquidity, seek to rebalance, or seek equilibrium in the future.
