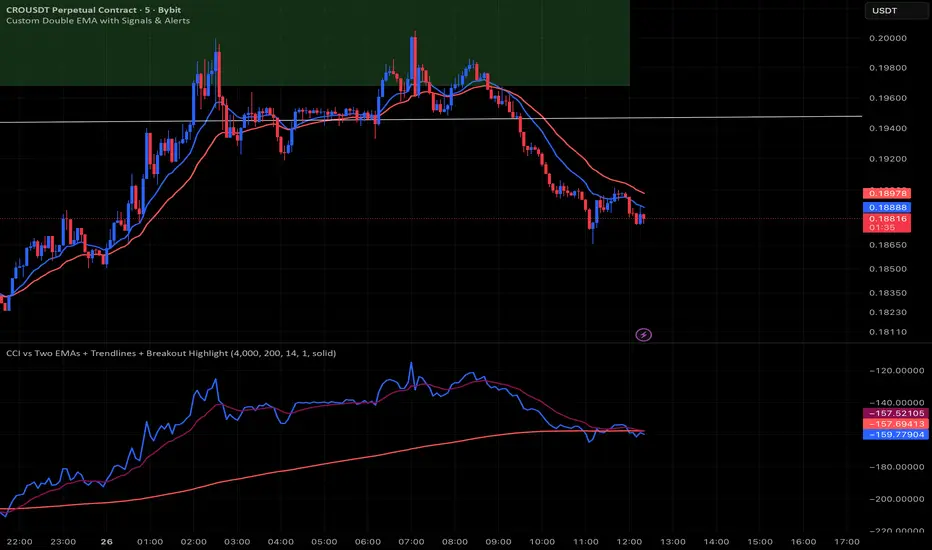
CCI vs Two EMAs + Trendlines + Breakout HighlightPerfect indicator which analyzes the cci4000 & 2 EMAS.
Cari dalam skrip untuk "采列VS新圣徒"
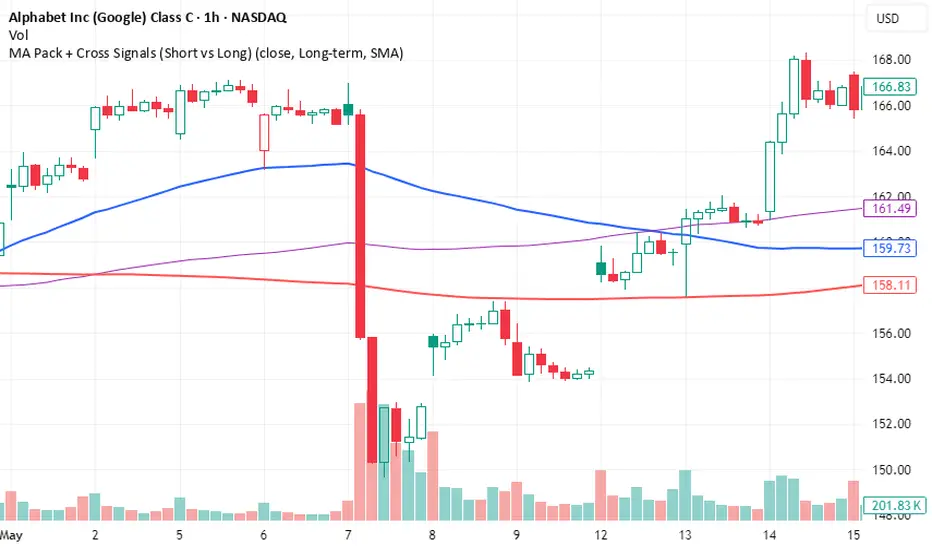
MA Pack + Cross Signals (Short vs Long)Overview
A flexible moving average pack that lets you switch between short-term trend detection and long-term trend confirmation .
Short-term mode: plots 5, 10, 20, and 50 MAs with early crossovers (10/50, 20/50).
Long-term mode: plots 50, 100, 200 MAs with Golden Cross and Death Cross signals.
Choice of SMA or EMA .
Alerts included for all crossovers.
Why Use It
Catch early trend shifts in short-term mode.
Confirm institutional trend levels in long-term mode.
Visual signals (triangles + labels) make spotting setups easy.
Alert-ready for automated trade monitoring.
Usage
Add to chart.
In settings, choose Short-term or Long-term .
Watch for markers:
Green triangles = bullish cross
Red triangles = bearish cross
Green label = Golden Cross
Red label = Death Cross
Optional: enable alerts for notifications.
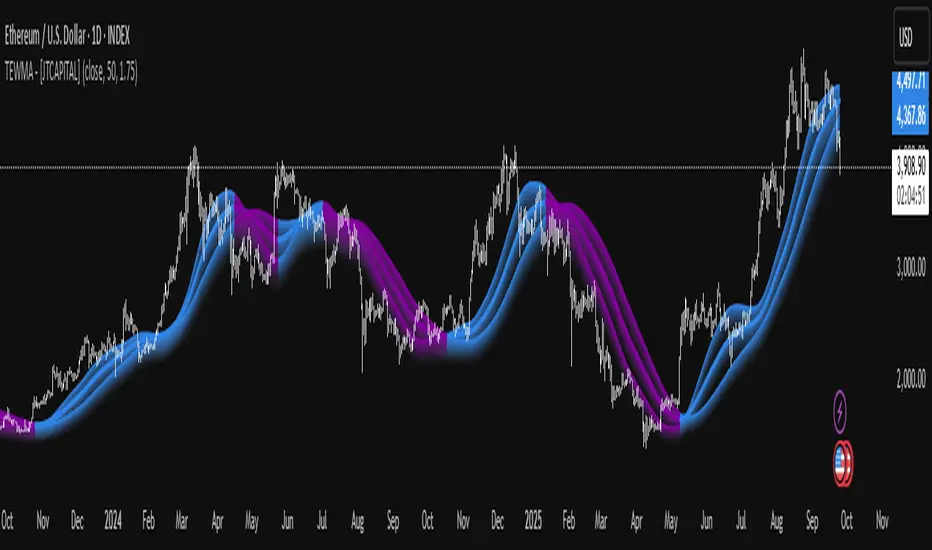
TEWMA - [JTCAPITAL]TEWMA - is a modified way to use Triple Exponential Moving Average (TEMA) combined with Weighted Moving Average (WMA) and adaptive multi-length averaging for Trend-Following.
The indicator blends short- and extended-length smoothed signals into a single adaptive line, then assigns directional bias to highlight bullish or bearish phases more clearly.
The indicator works by calculating in the following steps:
Source Selection
The script begins with a selectable price source (default: Close, but can be changed to Open, High, Low, HL2, etc.). This ensures flexibility depending on the user’s preferred market perspective.
Dual-Length Calculation
A base length ( len ) is chosen, and then multiplied by a factor ( multi , default 1.75). This produces a secondary, longer period ( len2 ) that adapts proportionally to the base.
Weighted + Triple Exponential Smoothing
-First, a WMA (Weighted Moving Average) is applied to the price source.
-Then, the TEMA (Triple Exponential Moving Average) is applied to smooth the WMA even further.
-This process is repeated for both len and len2 , producing TEWMA1 and TEWMA2 .
Adaptive Averaging
The final TEWMA line is calculated as the average of TEWMA1 and TEWMA2, creating a blend between the short-term and extended-term signals. This balances reactivity and stability, reducing lag while avoiding excessive noise.
Trend Direction Detection
-If TEWMA is greater than its previous value → Bullish .
-If TEWMA is lower than its previous value → Bearish .
-A Signal variable is used to store this directional bias, ensuring continuity between bars.
Visual Plotting
-The main TEWMA is plotted with bold coloring (Blue for bullish, Purple for bearish).
-TEWMA1 and TEWMA2 are plotted as thinner supporting lines.
-Each line is given a shadow-fill (between 100% and 90% of its value) for emphasis and visual clarity.
Alerts
Custom alerts are defined:
- TEWMA Long → when bullish.
- TEWMA Short → when bearish.
-These alerts can be integrated into TradingView’s alerting system for automated notifications.
Buy and Sell Conditions :
- Buy : Triggered when TEWMA rises (bullish slope). The indicator colors the line blue and an alert can be fired.
- Sell : Triggered when TEWMA declines (bearish slope). The line turns purple, signaling potential short or exit points.
Features and Parameters :
- Source → Selectable price input (Close, Open, HL2, etc.).
- Length (len) → Base period for the WMA/TEMA calculation.
- Multiplier (multi) → Scales the secondary length to create a longer-term smoothing.
- Color-coded Trend Lines → Blue for bullish, Purple for bearish.
- Shadow Fill Effects → Provides depth and easier visualization of trend direction.
- Alert Conditions → Prebuilt alerts for both Long and Short scenarios.
Specifications :
Weighted Moving Average (WMA)
The WMA assigns more weight to recent price values, making it more responsive than a Simple Moving Average (SMA). This enhances early detection of market turns while reducing lag compared to longer-term averages.
Triple Exponential Moving Average (TEMA)
TEMA is designed to minimize lag by combining multiple EMA layers (EMA of EMA of EMA). It is smoother and more adaptive than traditional EMAs, making it ideal for detecting true market direction without overreacting to small fluctuations.
Multi-Length Averaging
By calculating two versions of WMA → TEMA with different lengths and then averaging them, the indicator balances responsiveness (short-term sensitivity) and reliability (long-term confirmation). This prevents whipsawing while keeping signals timely.
Adaptive Signal Assignment
Instead of simply flipping signals at crossovers, the indicator checks slope direction of TEWMA. This ensures smoother trend-following behavior, reducing false positives in sideways conditions.
Color-Coding & Visual Shading
Visual clarity is achieved by coloring bullish periods differently from bearish ones, with shaded fills beneath each line. This allows traders to instantly identify trend conditions and compare short- vs long-term signals.
Alert Conditions
Trading decisions can be automated by attaching alerts to the TEWMA’s bullish and bearish states. This makes it practical for active trading, swing setups, or algorithmic strategies.
Enjoy!
Positional Toolbox v6 (distinct colors)what the lines mean (colors)
EMA20 (green) = fast trend
EMA50 (orange) = intermediate trend
EMA200 (purple, thicker) = primary trend
when the chart is “bullish” vs “bearish”
Bullish bias (look for buys):
EMA20 > EMA50 > EMA200 and EMA200 sloping up.
Bearish bias (avoid longs / consider exits):
EMA20 < EMA50 < EMA200 or price closing under EMA50/EMA200.
the two buy signals the script gives you
Pullback Long (triangle up)
Prints when price dips to EMA20 (green) and closes back above it while trend is bullish and ADX is decent.
Entry: buy on the same close or on a break of that candle’s high next day.
Stop: below the pullback swing-low (or below EMA50 for simplicity).
Best for: adding on an existing uptrend after a shallow dip.
Breakout 55D (“BO55” label)
Prints when price closes above prior 55-day high with volume surge in a bullish trend.
Entry: on the close that triggers, or next day above the breakout candle’s high.
Stop: below the breakout candle’s low (conservative: below base low).
Best for: fresh trend legs from bases.
simple “sell / exit” rules
Trend exit (clean & mechanical): exit if daily close < EMA50 (orange).
More conservative: only exit if close < EMA200 (purple).
Momentum fade / weak breakout: if BO55 triggers but price re-closes back inside the base within 1–3 sessions on above-avg volume → exit or cut size.
Profit taking: book some at +1.5R to +2R, trail the rest (e.g., below prior swing lows or EMA20).
quick visual checklist (what to look for)
Are the EMAs stacked up (green over orange over purple)? → ok to buy setups.
Did a triangle print near EMA20? → pullback long candidate.
Did a BO55 label print with strong volume? → breakout candidate.
Any close under EMA50 after you’re in? → reduce/exit.
timeframe
Use Daily for positional signals.
If you want a tighter entry, drop to 30m/1h only to time the trigger—but keep decisions anchored to the daily trend.
alerts to set (so you don’t miss signals)
Add alert on Breakout 55D and Pullback Long (from the indicator’s alertconditions).
Optional price alerts at the breakout level or EMA20 touch.
risk guardrails (MTF friendly)
Risk ≤1% of capital per trade.
Avoid fresh entries within ~5 trading days of earnings unless you accept gap risk.
Prefer high-liquidity NSE F&O names (your CSV watchlist covers this).
TL;DR (super short):
Green > Orange > Purple = uptrend.
Triangle near green = buy the pullback; stop under swing low/EMA50.
BO55 label = buy the breakout; stop under breakout candle/base.
Exit on close below EMA50 (or below EMA200 if you’re giving more room).

CNagda Anchor2EntryCNagda Anchor2Entry Pine Script v6 overlay indicator pulls higher-timeframe (HTF) signal events to define anchor high/low levels and then projects visual entry labels on the lower-timeframe (LTF). It also draws auto-oriented Fibonacci retracement/extension levels for context, but it does not execute orders, stops, or targets—only visual guidance.
Inputs
Key inputs include Lookback Length for HTF scanning and a Signal Timeframe used with request.security to import HTF events onto the active chart.
Entry behavior can be set to “Confirm only” or “Wait candle,” trade side can be restricted to Buy/Sell/Both, and individual strategies (Buy WAIT/S1; Sell REV/S1/S2/S3) can be toggled.
HTF logic
The script defines WAIT/BUY setup and confirmation, SELL reversal on breaking the WAIT BUY low, and several volume/candle-based patterns (Sell S1/S2/S3, Buy S1).
It captures the associated highs/lows at those events with ta.valuewhen and imports them via request.security to form anchors (anc_hi/anc_lo) and “new trigger” booleans that gate label creation on the LTF.
Flip entries
When enabled, “Flip entries” generate contrarian labels based on breaking or confirming HTF anchors: crossing above anc_hi can trigger a flip-to-sell label, and crossing below anc_lo can trigger a flip-to-buy label.
The flip mode supports Immediate (on cross) or Confirm (on sustained break) to control how strict the trigger is.
Fibonacci drawing
User-specified Fib levels are parsed from a string, safely converted to floats, and drawn as dotted horizontal lines only when they fall inside an approximate visible viewport. Orientation (up or down) is decided automatically from pending signal direction and a simple context score (candle bias, trend, and price vs. mid), with efficient redraw/clear guards to avoid clutter.
Dynamic anchors
If HTF anchors are missing or too far from current price (checked with an ATR-based threshold), the script falls back to local swing highs/lows to keep the reference range relevant. This dynamic switch helps Fib levels and labels remain close to current market structure without manual intervention.
Signal labels
Labels are created only on confirmed bars to avoid repainting noise, with one “latest” label kept by deleting the previous one. The script places BUY/SELL labels for WAIT/CONFIRM, direct HTF patterns (Buy S1, Sell S1/S2/S3), and contrarian flip events, offset slightly from highs/lows with clear coloring and configurable sizes.
Visual context
Bars are softly colored (lime tint for bullish, orange tint for bearish) for quick context, and everything renders as an overlay on the price chart. Fib labels include a Δ readout (distance from current close), and line extension length, label sizes, and viewport padding are adjustable.
How to use
Set the Signal Timeframe and Lookback Length to establish which HTF structures and ranges will drive the anchors and entry conditions. Choose entry flow (Wait vs Confirm), enable Flip if contrarian triggers are desired, select the trade side, toggle strategies, and customize Fibonacci levels plus dynamic-anchor fallback for practical on-chart guidance.
Notes
This is a visual decision-support tool; it does not place trades, stops, or targets and should be validated on charts before live use. It is written for Pine Script v6 and relies heavily on request.security for HTF-to-LTF transfer of signals and anchors.

triple Keltner Channels with Z-Score V2This script expands on the classic Keltner Channel by plotting three adaptive volatility bands around an EMA baseline and introducing a dynamic Z-Score calculation to quantify price positioning within or beyond those bands.
Features
Three Keltner Channels:
Inner Channel at ×2 ATR
Outer Channel at ×3 ATR
Extended Channel at ×3.5 ATR
Customizable Inputs: EMA length, ATR length, and multipliers can be adjusted to suit different market conditions or asset volatility.
Z-Score Integration: Converts price location relative to the channels into standardized scores (from +2.5 to –2.5). Positive Z indicate a good value/zone to buy while negative one is the contrary (do not use it alone, use it with other indicators )
This provides a statistical lens for identifying overextended, neutral, or mean-reverting conditions.
Visual Clarity: Channel fills highlight volatility zones, while an on-chart label dynamically displays the current Z-Score.
How to Use
Overbought/Oversold Signals: Extreme Z-Score readings (±2 and beyond) suggest stretched conditions that often precede pullbacks or reversions.
Mean Reversion vs Breakout: Traders can assess whether price is likely to revert to the mean (EMA) or sustain momentum beyond outer bands.
Originality
Unlike a standard Keltner Channel, this one:
Uses three progressively wider ATR multiples for deeper volatility mapping.
Adds a Z-Score framework to statistically measure price displacement.
Provides a visual + numerical hybrid output (bands + live Z-Score label).
use only on 1W timeframe

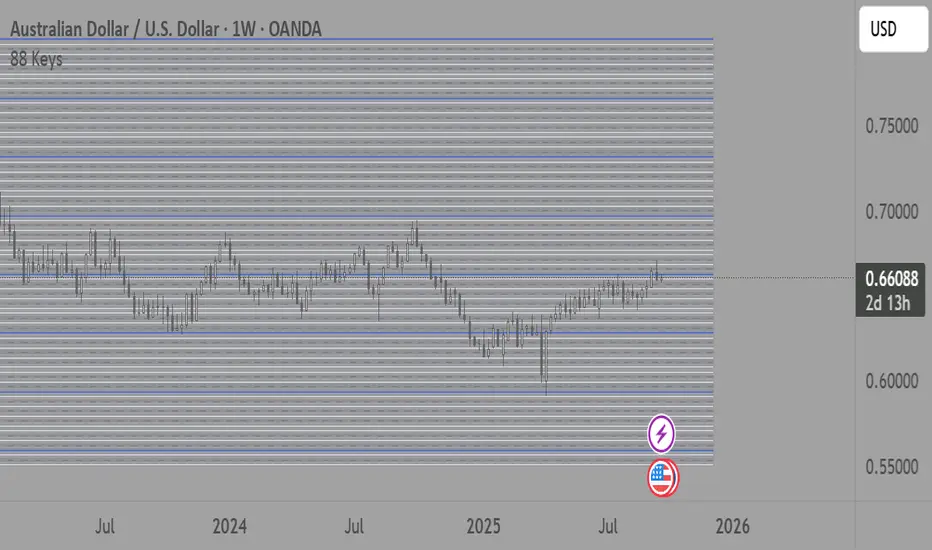
88-Key Piano Range - Musical Price Levels88-Key Piano Range - Musical Price Levels
Description:
Explore price analysis through musical harmony! This educational indicator maps price movements to the standard 88-key piano keyboard (A0 to C8), offering a creative way to visualize market ranges and explore harmonic price relationships with authentic keyboard-style background fills.
🎹 KEY FEATURES:
• Complete 88-Key Mapping - Full piano range from A0 to C8 mapped to your price range
• Piano-Style Visual Design - Clean background fills distinguishing white keys, black keys, and octaves
• Dual Anchor System - Set two time/price points to define your analytical range
• Flexible Display Options - Show all 88 keys, octaves only (C notes), or custom selections
• Harmonic Exploration - Explore consonant/dissonant key relationships based on music theory
• Real-time Price Note - See what musical note your current price represents
• Customizable Interface - Adjust colors, line widths, fills, and visual elements
🎵 EDUCATIONAL CONCEPTS:
• Octave Levels - C notes as harmonic reference points (similar to round numbers)
• Key Classifications - Natural notes (white keys) vs chromatic notes (black keys)
• Harmonic Intervals - Musical relationships applied to price analysis
• Creative Visualization - Alternative way to view price ranges and movements
⚙️ HOW TO USE:
1. Select Your Price Leg - Choose an upleg, downleg, or significant price movement to explore
2. Set Anchor A - Place at the start of your selected leg (swing low for upleg, swing high for downleg)
3. Set Anchor B - Place at the end of your selected leg (swing high for upleg, swing low for downleg)
4. Configure Display - Select all keys, octaves only, or enable background fills
5. Explore Harmonics - Enable harmony coloring to see musical relationships
6. Study Patterns - Observe how price movements align with musical intervals
🎼 CREATIVE APPLICATIONS:
• Experimental Analysis - Try a musical approach to leg analysis
• Educational Tool - Learn about mathematical relationships in both music and markets
• Alternative Perspective - View support/resistance through a musical lens
• Pattern Recognition - Explore if harmonic levels show interesting price behavior
• Fun Learning - Combine musical knowledge with trading concepts
📊 EXPERIMENTAL USE:
• Creative alternative to traditional Fibonacci levels
• Educational exploration of mathematical harmony in markets
• Interesting way to visualize price ranges and retracements
• Novel approach for musicians interested in trading concepts
Important Note: This is an educational and experimental tool that applies musical theory concepts to price analysis. It should be used for learning and exploration purposes alongside proven technical analysis methods. The musical relationships are mathematically based but not validated as reliable trading signals.
Options Max Pain Calculator [BackQuant]Options Max Pain Calculator
A visualization tool that models option expiry dynamics by calculating "max pain" levels, displaying synthetic open interest curves, gamma exposure profiles, and pin-risk zones to help identify where market makers have the least payout exposure.
What is Max Pain?
Max Pain is the theoretical expiration price where the total dollar value of outstanding options would be minimized. At this price level, option holders collectively experience maximum losses while option writers (typically market makers) have minimal payout obligations. This creates a natural gravitational pull as expiration approaches.
Core Features
Visual Analysis Components:
Max Pain Line: Horizontal line showing the calculated minimum pain level
Strike Level Grid: Major support and resistance levels at key option strikes
Pin Zone: Highlighted area around max pain where price may gravitate
Pain Heatmap: Color-coded visualization showing pain distribution across prices
Gamma Exposure Profile: Bar chart displaying net gamma at each strike level
Real-time Dashboard: Summary statistics and risk metrics
Synthetic Market Modeling**
Since Pine Script cannot access live options data, the indicator creates realistic synthetic open interest distributions based on configurable market parameters including volume patterns, put/call ratios, and market maker positioning.
How It Works
Strike Generation:
The tool creates a grid of option strikes centered around the current price. You can control the range, density, and whether strikes snap to realistic market increments.
Open Interest Modeling:
Using your inputs for average volume, put/call ratios, and market maker behavior, the indicator generates synthetic open interest that mirrors real market dynamics:
Higher volume at-the-money with decay as strikes move further out
Adjustable put/call bias to reflect current market sentiment
Market maker inventory effects and typical short-gamma positioning
Weekly options boost for near-term expirations
Pain Calculation:
For each potential expiry price, the tool calculates total option payouts:
Call options contribute pain when finishing in-the-money
Put options contribute pain when finishing in-the-money
The strike with minimum total pain becomes the Max Pain level
Gamma Analysis:
Net gamma exposure is calculated at each strike using standard option pricing models, showing where hedging flows may be most intense. Positive gamma creates price support while negative gamma can amplify moves.
Key Settings
Basic Configuration:
Number of Strikes: Controls grid density (recommended: 15-25)
Days to Expiration: Time until option expiry
Strike Range: Price range around current level (recommended: 8-15%)
Strike Increment: Spacing between strikes
Market Parameters:
Average Daily Volume: Baseline for synthetic open interest
Put/Call Volume Ratio: Market sentiment bias (>1.0 = bearish, <1.0 = bullish) It does not work if set to 1.0
Implied Volatility: Current option volatility estimate
Market Maker Factors: Dealer positioning and hedging intensity
Display Options:
Model Complexity: Simple (line only), Standard (+ zones), Advanced (+ heatmap/gamma)
Visual Elements: Toggle individual components on/off
Theme: Dark/Light mode
Update Frequency: Real-time or daily calculation
Reading the Display
Dashboard Table (Top Right):
Current Price vs Max Pain Level
Distance to Pain: Percentage gap (smaller = higher pin risk)
Pin Risk Assessment: HIGH/MEDIUM/LOW based on proximity and time
Days to Expiry and Strike Count
Model complexity level
Visual Elements:
Red Line: Max Pain level where payout is minimized
Colored Zone: Pin risk area around max pain
Dotted Lines: Major strike levels (green = support, orange = resistance)
Color Bar: Pain heatmap (blue = high pain, red = low pain/max pain zones)
Horizontal Bars: Gamma exposure (green = positive, red = negative)
Yellow Dotted Line: Gamma flip level where hedging behavior changes
Trading Applications
Expiration Pinning:
When price is near max pain with limited time remaining, there's increased probability of gravitating toward that level as market makers hedge their positions.
Support and Resistance:
High open interest strikes often act as magnets, with max pain representing the strongest gravitational pull.
Volatility Expectations:
Above gamma flip: Expect dampened volatility (long gamma environment)
Below gamma flip: Expect amplified moves (short gamma environment)
Risk Assessment:
The pin risk indicator helps gauge likelihood of price manipulation near expiry, with HIGH risk suggesting potential range-bound action.
Best Practices
Setup Recommendations
Start with Model Complexity set to "Standard"
Use realistic strike ranges (8-12% for most assets)
Set put/call ratio based on current market sentiment
Adjust implied volatility to match current levels
Interpretation Guidelines:
Small distance to pain + short time = high pin probability
Large gamma bars indicate key hedging levels to monitor
Heatmap intensity shows strength of pain concentration
Multiple nearby strikes can create wider pin zones
Update Strategy:
Use "Daily" updates for cleaner visuals during trading hours
Switch to "Every Bar" for real-time analysis near expiration
Monitor changes in max pain level as new options activity emerges
Important Disclaimers
This is a modeling tool using synthetic data, not live market information. While the calculations are mathematically sound and the modeling realistic, actual market dynamics involve numerous factors not captured in any single indicator.
Max pain represents theoretical minimum payout levels and suggests where natural market forces may create gravitational pull, but it does not guarantee price movement or predict exact expiration levels. Market gaps, news events, and changing volatility can override these dynamics.
Use this tool as additional context for your analysis, not as a standalone trading signal. The synthetic nature of the data makes it most valuable for understanding market structure and potential zones of interest rather than precise price prediction.
Technical Notes
The indicator uses established option pricing principles with simplified implementations optimized for Pine Script performance. Gamma calculations use standard financial models while pain calculations follow the industry-standard definition of minimized option payouts.
All visual elements use fixed positioning to prevent movement when scrolling charts, and the tool includes performance optimizations to handle real-time calculation without timeout errors.

StdDev Supertrend {CHIPA}StdDev Supertrend ~ C H I P A is a supertrend style trend engine that replaces ATR with standard deviation as the volatility core. It can operate on raw prices or log return volatility, with optional smoothing to control noise.
Key features include:
Supertrend trailing rails built from a stddev scaled envelope that flips the regime only when price closes through the opposite rail.
Returns-based mode that scales volatility by log returns for more consistent behavior across price regimes.
Optional smoothing on the volatility input to tune responsiveness versus stability.
Directional gap fill between price and the active trend line on the main chart; opacity adapts to the distance (vs ATR) so wide gaps read stronger and small gaps stay subtle.
Secondary pane view of the rails with the same adaptive fade, plus an optional candle overlay for context.
Clean alerts that fire once when state changes
Use cases: medium-term trend following, stop/flip systems, and visual regime confirmation when you prefer stddev-based distance over ATR.
Note: no walk-forward or robustness testing is implied; parameter choices and risk controls are on you.

Simple Turnover (Enhanced v2)📊 Simple Turnover (Enhanced)
🔹 Overview
The Simple Turnover Indicator calculates a stock’s turnover by combining both price and volume, and then compares it against quarterly highs. This helps traders quickly gauge whether market participation in a move is strong enough to confirm a breakout, or weak and likely to be false.
Unlike volume alone, turnover considers both traded volume and price level, giving a truer reflection of capital flow in/out of a stock.
________________________________________
🔹 Formulae Used
1. Average Price (SMA)
AvgPrice=SMA(Close,n)
2. Average Volume (SMA)
AvgVol=SMA(Volume,n)
3. Turnover (Raw)
Turnover raw=AvgPrice × AvgVol
4. Unit Adjustment
• If Millions → Turnover = Turnover raw × 10^−6
• If Crores → Turnover = Turnover raw × 10^−7
• If Raw → Turnover = Turnover raw
5. Quarterly High Turnover (qHigh)
Within each calendar quarter (Jan–Mar, Apr–Jun, Jul–Sep, Oct–Dec), we track the maximum turnover seen:
qHigh=max (Turnover within current quarter)
________________________________________
🔹 Visualization
• Bars → Color follows price candle:
o Green if Close ≥ Open
o Red if Close < Open
• Blue Line → Rolling Quarterly High Turnover (qHigh)
________________________________________
🔹 Strategy Use Case
The Simple Turnover Indicator is most effective for confirming true vs false breakouts.
• A true breakout should be supported by increasing turnover, showing real capital backing the move.
• A false breakout often occurs with weak or declining turnover, suggesting lack of conviction.
📌 Example Strategy (3H timeframe):
1. Identify a demand zone using your preferred supply-demand indicator.
2. From this demand zone, monitor turnover bars.
3. A potential long entry is validated when:
o The current turnover bar is at least 20% higher than the previous one or two bars.
o Example setting: SMA length = 5 (i.e., turnover = 5-bar average close × 5-bar average volume).
4. This confirms strong participation in the move, increasing probability of a sustained breakout.
________________________________________
🔹 Disclaimer
⚠️ This indicator/strategy does not guarantee 100% accurate results.
It is intended to improve the probability of identifying true breakouts.
The actual success of the strategy will depend on price action, market momentum, and prevailing market conditions.
Always use this as a supporting tool along with broader trading analysis and risk management.

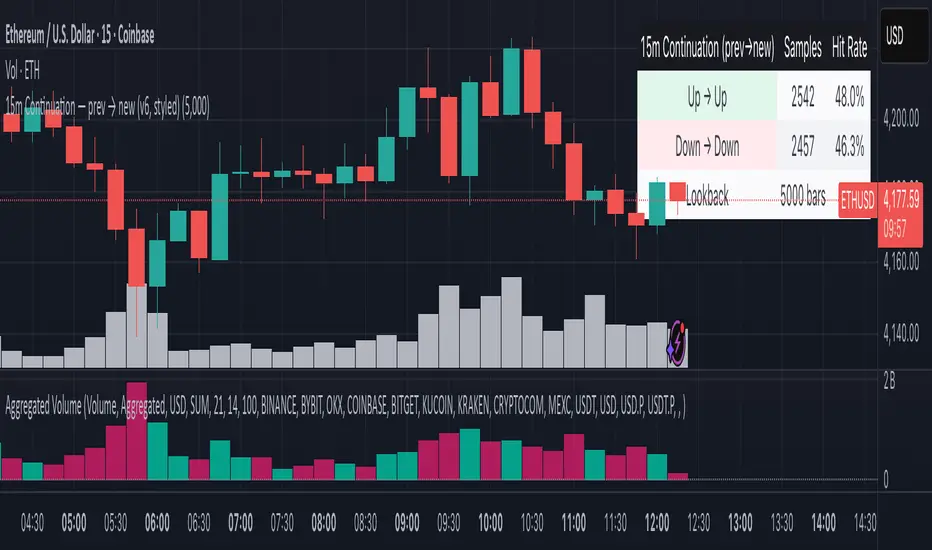
15m Continuation — prev → new (v6, styled)This indicator gives you backtested statistics on how often reversals vs continuations occur on 15 minute candles on any pair you want to trade. This is great for 15m binary markets like on Polymarket.
Momentum Shift Oscillator (MSO) [SharpStrat]Momentum Shift Oscillator (MSO)
The Momentum Shift Oscillator (MSO) is a custom-built oscillator that combines the best parts of RSI, ROC, and MACD into one clean, powerful indicator. Its goal is to identify when momentum shifts are happening in the market, filtering out noise that a single momentum tool might miss.
Why MSO?
Most traders rely on just one momentum indicator like RSI, MACD, or ROC. Each has strengths, but also weaknesses:
RSI → great for overbought/oversold, but often lags in strong trends.
ROC (Rate of Change) → captures price velocity, but can be too noisy.
MACD Histogram → shows trend strength shifts, but reacts slowly at times.
By blending all three (with adjustable weights), MSO gives a balanced view of momentum. It captures trend strength, velocity, and exhaustion in one oscillator.
How MSO Works
Inputs:
RSI, ROC, and MACD Histogram are calculated with user-defined lengths.
Each is normalized (so they share the same scale of -100 to +100).
You can set weights for RSI, ROC, and MACD to emphasize different components.
The components are blended into a single oscillator value.
Smoothing (SMA, EMA, or WMA) is applied.
MSO plots as a smooth line, color-coded by slope (green rising, red falling).
Overbought and oversold levels are plotted (default: +60 / -60).
A zero line helps identify bullish vs bearish momentum shifts.
How to trade with MSO
Zero line crossovers → crossing above zero suggests bullish momentum; crossing below zero suggests bearish momentum.
Overbought and oversold zones → values above +60 may indicate exhaustion in bullish moves; values below -60 may signal exhaustion in bearish moves.
Slope of the line → a rising line shows strengthening momentum, while a falling line signals fading momentum.
Divergences → if price makes new highs or lows but MSO does not, it can point to a possible reversal.
Why MSO is Unique
Combines trend + momentum + velocity into one view.
Filters noise better than standalone RSI/MACD.
Adapts to both trend-following and mean-reversion styles.
Can be used across any timeframe for confirmation.

Strong Trend Suite — Clean v6A clean, rules-based trend tool for swing traders. It identifies strong up/down trends by syncing five pillars:
Trend structure: price above/below a MA stack (EMA20 > SMA50 > EMA200 for up; inverse for down).
Momentum: RSI (50 line) and MACD (line > signal and side of zero).
Trend strength: ADX above a threshold and rising.
Volume confirmation: OBV vs its short MA (accumulation/distribution).
Optional higher-TF bias: weekly filter to avoid fighting bigger flows.
When all align, the background tints and the mini-meter flips green/red (UP/DOWN).
It also marks entry cues: pullbacks to EMA20/SMA50 with a MACD re-cross, or breakouts of recent highs/lows on volume.
Built-in alerts for strong trend, pullback, and breakout keep you hands-off; use “Once per bar close” on the Daily chart for best signal quality.
Apex Edge Sentinel - Stop Loss HUDApex Edge – ATR Sentinel Stop Loss HUD
The Apex Edge – ATR Sentinel is a complete stop-loss intelligence system built as a clean, always-on HUD.
It delivers institutional-level risk guidance by calculating and displaying live ATR-based stop levels for both long and short trades at multiple risk tolerances.
Forget cluttered charts and repainting lines — Sentinel gives you a clear stop-loss reference panel that updates dynamically with every bar.
✅ Features
• Triple ATR Multipliers
User-defined (e.g. x1.5 / x2.0 / x2.5). Compare tight, medium, and wide stops instantly.
• Dual-Side SL Levels
Both Long and Short safe stop prices displayed side by side. No more guessing trend
bias.
• ATR Transparency
HUD shows ATR(length) so you always know the calculation basis. Default = 14, adjustable
to your style.
• ATR Regime Meter
Detects volatility conditions (LOW / NORMAL / HIGH) by comparing ATR to its SMA. Helps
you avoid over-tight stops in high-volatility markets.
• Tick-Aware Rounding
Stop levels auto-rounded to the instrument’s tick size (Gold = 0.10, FX = 0.0001, indices =
whole points).
Custom HUD Design
• Location: Top/Bottom, Left/Right
• Sizes: Compact / Medium / Large (desktop or mobile)
• Opacity control (25% default Apex styling)
How to Use
1. Load Sentinel on your chart.
2. Check the HUD:
• ATR(14): 2.6 → base volatility measure.
• x1.5 / x2.0 / x2.5 → instant SL levels for both long & short trades.
3. Before entering a trade → decide which multiplier matches your style (tight scalper vs wider swing).
4. Manually place your SL at the level displayed in the HUD.
Sentinel works as both:
• A pre-trade check (is ATR stop too wide for my RR?).
• A live risk compass (updated stop levels every bar).
Why Apex Sentinel?
Most ATR stop indicators clutter charts with lagging lines or repainting trails. Sentinel strips it back to what matters:
• The numbers.
• The risk levels.
• The context.
It’s a pure stop-loss HUD, designed for serious traders who want clarity, discipline, and instant reference points across any market or timeframe.
Notes
• This is a HUD-only system (no automatic SL line). Traders manually apply the SL level
shown in the panel.
• Defaults: ATR(14), multipliers 1.5 / 2.0 / 2.5. Adjust to your trading style.
• Best used on intraday pairs like XAUUSD, EURUSD, indices, but works universally.
Apex Edge Philosophy: Clean. Smart. Institutional.
No clutter. No gimmicks. Just precision tools for modern markets.

ORB + Session VWAP Pro (London & NY) — fixedORB + Session VWAP Pro (London & NY) — Listing copy (EN)
What it is
A clean, non-repainting intraday tool that fuses the classic Opening Range Breakout (ORB) with a session-anchored VWAP filter for London and New York. It highlights only the higher-quality breakouts (above/below session VWAP), adds an optional retest confirmation, and scores each signal with an intuitive Confidence metric (0–100).
Why it works
• ORB provides the day’s first actionable structure (range high/low).
• Session VWAP filters “cheap” breaks and favors flows aligned with session value.
• Optional retest reduces first-tick whipsaws.
• Confidence blends breakout depth (vs ATR), VWAP slope and band distance.
Key visuals
• LDN/NY OR High/Low (line break style) + optional OR boxes.
• Active Session VWAP (resets per signal window; falls back to daily VWAP outside).
• Optional VWAP bands (stdev or %).
• Session shading (London/NY windows).
• Signal markers (LDN BUY/SELL, NY BUY/SELL) fired with cooldown.
Signals
• London Long / Short: Break of LDN OR High/Low ± ATR buffer, aligned with VWAP side.
• NY Long / Short: Same logic during NY window.
• Retest (optional): Requires a tag back to the OR level ± tolerance before confirmation.
• Confidence: 0–100; gate via Min Confidence (default 55).
Inputs that matter
• Open Range Length (min): Default 15.
• London/NY times & timezones.
• ATR buffer & retest tolerance.
• Bands mode: Stdev (with lookback) or % (e.g., 1%).
• Signal cooldown: Avoids clutter on fast moves.
Non-repaint policy
• OR lines build within fixed time windows using the current bar’s timestamp.
• VWAP is cumulative within the session window; no lookahead.
• All ta.crossover/ta.crossunder are precomputed every bar (no conditional execution).
• Signals are based on live bar values, not future bars.
⸻
Quick start (examples)
1) EURUSD, London momentum
• Chart: 5m or 15m.
• OR: 15 min starting 08:00 Europe/London.
• Signals: Use defaults; keep ATR buffer = 0.2 and Retest = ON, Min Confidence ≥ 55.
• Play:
• BUY when price breaks LDN OR High + buffer and stays above VWAP; retest confirms.
• Trail behind VWAP or band #1; partials into band #2.
2) NAS100, New York breakout & run
• Chart: 5m.
• NY window: 09:30 America/New_York, OR = 15 min.
• Retest OFF on high momentum days; Min Confidence ≥ 60.
• Use band mode Stdev, bandLen=50, show ±1/±2.
• Momentum continuation: add on pullbacks that hold above VWAP after the breakout.
3) XAUUSD, London fake & VWAP fade
• Chart: 5m.
• Keep Retest ON; accept only shorts that break OR Low but retest fails back under VWAP.
• Confidence gate ≥ 50 to allow more mean-reversion setups.
⸻
Pro tips
• Adjust ATR buffer to the instrument: FX 0.15–0.25, indices 0.20–0.35, metals 0.20–0.30.
• Retest ON for choppy conditions; OFF for news momentum.
• Use VWAP bands: take partials at ±1; stretch targets at ±2/±3.
• Session timezones are explicit (London/New York). Ensure they match your instrument’s behavior.
• Pair with a higher-TF bias (e.g., 1H/4H trend) for directional filtering.
⸻
Alerts (ready to use)
• ORB+SVWAP — LDN Long, LDN Short, NY Long, NY Short
(Respect your cooldown; alerts fire only after confirmation and confidence gate.)
⸻
Known limits & notes
• Designed for intraday. On 1D+ charts, session windows compress.
• If your broker session differs from London/NY clocks on a holiday, adjust input times.
• Session-anchored VWAP uses the script’s signal window, not exchange sessions, by design.

DynamoSent DynamoSent Pro+ — Professional Listing (Preview)
— Adaptive Macro Sentiment (v6)
— Export, Adaptive Lookback, Confidence, Boxes, Heatmap + Dynamic OB/OS
Preview / Experimental build. I’m actively refining this tool—your feedback is gold.
If you spot edge cases, want new presets, or have market-specific ideas, please comment or DM me on TradingView.
⸻
What it is
DynamoSent Pro+ is an adaptive, non-repainting macro sentiment engine that compresses VIX, DXY and a price-based activity proxy (e.g., SPX/sector ETF/your symbol) into a 0–100 sentiment line. It scales context by volatility (ATR%) and can self-calibrate with rolling quantile OB/OS. On top of that, it adds confidence scoring, a plain-English Context Coach, MTF agreement, exportable sentiment for other indicators, and a clean Light/Dark UI.
Why it’s different
• Adaptive lookback tracks regime changes: when volatility rises, we lengthen context; when it falls, we shorten—less whipsaw, more relevance.
• Dynamic OB/OS (quantiles) self-calibrates to each instrument’s distribution—no arbitrary 30/70 lines.
• MTF agreement + Confidence gate reduce false positives by highlighting alignment across timeframes.
• Exportable output: hidden plot “DynamoSent Export” can be selected as input.source in your other Pine scripts.
• Non-repainting rigor: all request.security() calls use lookahead_off + gaps_on; signals wait for bar close.
Key visuals
• Sentiment line (0–100), OB/OS zones (static or dynamic), optional TF1/TF2 overlays.
• Regime boxes (Overbought / Oversold / Neutral) that update live without repaint.
• Info Panel with confidence heat, regime, trend arrow, MTF readout, and Coach sentence.
• Session heat (Asia/EU/US) to match intraday behavior.
• Light/Dark theme switch in Inputs (auto-contrasted labels & headers).
⸻
How to use (examples & recipes)
1) EURUSD (swing / intraday blend)
• Preset: EURUSD 1H Swing
• Chart: 1H; TF1=1H, TF2=4H (default).
• Proxies: Defaults work (VIX=D, DXY=60, Proxy=D).
• Dynamic OB/OS: ON at 20/80; Confidence ≥ 55–60.
• Playbook:
• When sentiment crosses above 50 + margin with Δ ≥ signalK and MTF agreement ≥ 0.5, treat as trend breakout.
• In Oversold with rising Coach & TF agreement, take fade longs back toward mid-range.
• Alerts: Enable Breakout Long/Short and Fade; keep cooldown 8–12 bars.
2) SPY (daytrading)
• Preset: SPY 15m Daytrade; Chart: 15m.
• VIX (D) matters more; preset weights already favor it.
• Start with static 30/70; later try dynamic 25/75 for adaptive thresholds.
• Use Coach: in US session, when it says “Overbought + MTF agree → sell rallies / chase breakouts”, lean momentum-continuation after pullbacks.
3) BTCUSD (crypto, 24/7)
• Preset: BTCUSD 1H; Chart: 1H.
• DXY and BTC.D inform macro tone; keep Carry-forward ON to bridge sparse ticks.
• Prefer Dynamic OB/OS (15/85) for wider swings.
• Fade signals on weekend chop; Breakout when Confidence > 60 and MTF ≥ 1.0.
4) XAUUSD (gold, macro blend)
• Preset: XAUUSD 4H; Chart: 4H.
• Weights tilt to DXY and US10Y (handled by preset).
• Coach + MTF helps separate trend legs from news pops.
⸻
Best practices
• Theme: Switch Light/Dark in Inputs; the panel adapts contrast automatically.
• Export: In another script → Source → DynamoSent Pro+ → DynamoSent Export. Build your own filters/strategies atop the same sentiment.
• Dynamic vs Static OB/OS:
• Static 30/70: fast, universal baseline.
• Dynamic (quantiles): instrument-aware; use 20/80 (default) or 15/85 for choppy markets.
• Confidence gate: Start at 50–60% to filter noise; raise when you want only A-grade setups.
• Adaptive Lookback: Keep ON. For ultra-liquid indices, you can switch it OFF and set a fixed lookback.
⸻
Non-repainting & safety notes
• All request.security() calls use lookahead=barmerge.lookahead_off and gaps=barmerge.gaps_on.
• No forward references; signals & regime flips are confirmed on bar close.
• History-dependent funcs (ta.change, ta.percentile_linear_interpolation, etc.) are computed each bar (not conditionally).
• Adaptive lookback is clamped ≥ 1 to avoid lowest/highest errors.
• Missing-data warning triggers only when all proxies are NA for a streak; carry-forward can bridge small gaps without repaint.
⸻
Known limits & tips
• If a proxy symbol isn’t available on your plan/exchange, you’ll see the NA warning: choose a different symbol via Symbol Search, or keep Carry-forward ON (it defaults to neutral where needed).
• Intraday VIX is sparse—using Daily is intentional.
• Dynamic OB/OS needs enough history (see dynLenFloor). On short histories it gracefully falls back to static levels.
Thanks for trying the preview. Your comments drive the roadmap—presets, new proxies, extra alerts, and integrations.

Apex Edge – HTF Overlay Candles“Trade your 5m chart with the eyes of the 1H — Apex Edge brings higher-timeframe structure and liquidity sweeps directly onto your execution chart.”
Apex Edge – HTF Overlay Candles
The Apex Edge – HTF Overlay Candles indicator overlays higher-timeframe (HTF) candles directly onto your lower-timeframe chart. Instead of flipping between timeframes, you see HTF structure “breathe” live on your execution chart.
What It Does
• HTF Body Boxes → open/close zones drawn as semi-transparent rectangles.
• HTF Wick Boxes → high/low extremes projected as envelopes around each body.
• Midpoint Line → a dynamic equilibrium line that flips bias as price trades above or below.
• Sweep Arrows → one-time markers showing the first liquidity raid at HTF highs or lows.
Under the Hood
This isn’t just a visual overlay — it’s engineered for accuracy and performance in PineScript.
1. HTF Data Retrieval
• Uses request.security() to import open, high, low, close, time from any selected HTF.
• lookahead=barmerge.lookahead_off ensures OHLC values update bar by bar as the HTF
candle builds.
• When the HTF bar closes, boxes and midpoint lock to historical values — matching the
native HTF chart exactly.
2. Box Construction
• Body box: built from HTF open → close.
• Wick box: built from HTF high → low.
• Boxes extend dynamically across each HTF period, updating in real time, then freeze at
close.
3. Midpoint Logic
• (htfOpen + htfClose) / 2 calculates intrabar midpoint.
• Line drawn edge-to-edge across the active HTF body.
• Style, width, color, and opacity are user-controlled.
4. Sweep Detection
• Flags (sweepedHigh / sweepedLow) prevent clutter: only the first tap per side per HTF
candle is marked.
• Lower-timeframe price breaking the HTF high/low triggers the sweep arrow.
• Arrows are offset above/below wick envelopes for clean visuals.
5. Customisation
• Every layer (body, wick, midpoint, arrows) has independent color + opacity settings.
• Arrow size, arrow color, and transparency are adjustable.
• Default HTF = 1H (perfect for 5m/15m traders) but can be switched to 30m, 4H, Daily,
etc.
Why It’s Useful
• HTF intent + LTF execution without chart hopping.
• Liquidity mapping: see where liquidity is swept in real time.
• Bias clarity: midpoint line defines HTF equilibrium.
• Clean signals: only the first sweep prints — no spam.
What Makes It Different
Most MTF overlays just plot candles or single lines. This tool:
• Splits body vs wick zones for institutional precision.
• Updates live intrabar (no repainting).
• Highlights liquidity sweeps clearly.
• Built for readability and professional use — not another retail signal toy.
Cheat-Sheet Playbook
1️⃣ Structure Bias
• Above midpoint line = bullish intent.
• Below midpoint line = bearish intent.
• Chop around midpoint = no clear direction.
2️⃣ Liquidity Sweeps
• ▲ Green up arrow below wick box = sell-side liquidity taken → watch for longs.
• ▼ Red down arrow above wick box = buy-side liquidity taken → watch for shorts.
• First sweep is the cleanest.
3️⃣ Trade Logic
• Body box = where institutions transact.
• Wick box = liquidity traps.
• Midpoint = bias filter.
• Best setups occur when sweep + midpoint flip align.
4️⃣ Example (5m + 1H Overlay)
1. ▲ Green up arrow prints below HTF wick.
2. Price reclaims the body box.
3. Midpoint flips to support.
4. Enter long → stop below sweep → targets = midpoint first, opposite wick second.
In short:
• Boxes = structure
• Wicks = liquidity pools
• Midpoint = bias line
• Arrows = liquidity sweeps
This is your SMC edge on one chart — HTF structure and liquidity fused directly into your execution timeframe.

Dynamic Stop Loss Optimizer [BackQuant]Dynamic Stop Loss Optimizer
Overview
Stop placement decides expectancy. This tool gives you three professional-grade, adaptive stop engines, ATR, Volatility, and Hybrid. So your exits scale with current conditions instead of guessing fixed ticks. It trails intelligently, redraws as the market evolves, and annotates the chart with clean labels/lines and a compact stats table. Pick the engine that fits the trade, or switch on the fly.
What it does
Calculates three adaptive stops in real time (ATR-based, Volatility-based, and Hybrid) and keeps them trailed as price makes progress.
Shows exactly where your risk lives with on-chart levels, color-coded markers (long/short), and precise “Risk %” labels at the current bar.
Surfaces context you actually use - current ATR, daily volatility, selected method, and the live stop level—in a tidy, movable table.
Fires alerts on stop hits so you can automate exits or journal outcomes without staring at the screen.
Why it matters
Adaptive risk control: Stops expand in fast tape and tighten in quiet tape. You’re not punished for volatility; you’re aligned with it.
Consistency across assets: The same playbook works whether you’re trading indexes, FX, crypto, or equities, because the engine normalizes to each symbol’s behavior.
Cleaner decision-making: One chart shows your entry idea and its invalidation in the same breath. If price trespasses, you know it instantly.
The three methods (choose your engine)
1) ATR Based “Structure-aware” distance
This classic approach keys off Average True Range to set a stop just beyond typical bar-to-bar excursion. It adapts smoothly to changing ranges and respects swing structure.
Use when: you want a steady, intuitive buffer that tracks trend legs without hugging price.
See it in action:
2) Volatility Based “Behavior-aware” distance
This engine derives stop distance from current return volatility (annualized, then scaled back down to the session). It reacts to regime shifts quickly and normalizes risk across symbols with very different prices.
Use when: you want the stop to breathe with realized volatility and respond faster to heat-ups/cool-downs.
See it in action:
3) Hybrid “Best of both worlds”
The Hybrid blends the ATR and Volatility distances into one consensus level, then trails it intelligently. You get the structural common sense of ATR and the regime sensitivity of Vol.
Use when: you want robust, all-weather behavior without micromanaging inputs.
See it in action:
How it trails
Longs: The stop ratchets up with favorable movement and holds its ground on shallow pullbacks. If price closes back into the risk zone, the level refreshes to the newest valid distance.
Shorts: Mirror logic ratchets down with trend, resists noise, and refreshes if price reclaims the zone.
Hybrid trailing: Uses the blended distance and the same “no give-backs” principle to keep gains protected as structure builds.
Reading the chart
Markers: Circles = ATR stops, Crosses = Vol stops, Diamonds = Hybrid. Colors indicate long (red level under price) vs short (green level above price).
Lines: The latest active stop is extended with a dashed line so you can see it at a glance.
Labels: “Long SL / Short SL” shows the exact price and current risk % from the last close no math required.
Table: ATR value, Daily Vol %, your chosen Method, the Current SL, and Risk %—all in one compact block that you can pin top-left/right/center.
Quick workflow
Define the idea: Long or Short, and which engine fits the tape (ATR, Vol, or Hybrid).
Place and trail: Let the optimizer print the level; trail automatically as the move develops.
Manage outcomes: If the line is tagged, you’re out clean. If it holds, you’ve contained heat while giving the trade room to work.
Inputs you’ll actually touch
Calculation Settings
ATR Length / Multiplier: Controls the “structural” cushion.
Volatility Length / Multiplier: Controls the “behavioral” cushion.
Trading Days: 252 or 365 to keep the volatility math aligned with the asset’s trading calendar.
Stop Loss Method
ATR Based | Volatility Based | Hybrid : Switch engines instantly to fit the trade.
Position Type
Long | Short | Both : Show only what you need for the current strategy.
Visual Settings
Show ATR / Vol / Hybrid Stops: Toggle families on/off.
Show Labels: Print price + Risk % at the live stop.
Table Position: Park the metrics where you like.
Coloring
Long/Short/Hybrid colors: Set a palette that matches your theme and stands out on your background.
Practical patterns to watch
Trend-pullback continuation: The stop ratchets behind higher lows (long) or lower highs (short). If price tests the level and rejects, that’s your risk-defined continuation cue.
Break-and-run: After a clean break, the Hybrid will usually sit slightly wider than pure Vol, use it to avoid getting shaken on the first retest.
Range compression: When the ATR and Vol distances converge, the table will show small Risk %. That’s your green light to size up with the same dollar risk, or keep it conservative if you expect expansion.
Alerts
Long Stop Loss Hit : Notifies when price crosses below the live long stop.
Short Stop Loss Hit : Notifies when price crosses above the live short stop.
Why this feels “set-and-serious”
You get a single look that answers three questions in real time: “Where’s my line in the sand?”, “How much heat am I taking right now?”, and “Is this distance appropriate for current conditions?” With ATR, Vol, and Hybrid in one tool, you can run the exact same playbook across symbols and regimes while keeping your chart clean and your risk explicit.

Bar Statistics - DELTA/OI/TOTAL/BUY/SELL/LONGS/SHORTSBar Statistics - Advanced Volume & Open Interest Analysis
Overview
The Bar Statistics indicator is a comprehensive analytical tool designed to provide traders with detailed insights into market microstructure through advanced volume analysis, open interest tracking, and market flow detection. This indicator transforms complex market data into easily digestible visual information, displaying six key metrics in customizable colored boxes that update in real-time.
Unlike traditional volume indicators that only show basic volume data, this indicator combines multiple data sources to reveal the underlying forces driving price movement, including volume delta calculations from lower timeframes, open interest changes, and estimated market positioning.
What Makes This Indicator Unique
1. Multi-Timeframe Volume Delta Precision
The indicator utilizes lower timeframe data (default 1-second) to calculate highly accurate volume delta measurements, providing much more precise buy/sell pressure analysis than standard timeframe-based calculations. This approach captures intraday volume dynamics that are often missed by conventional indicators.
2. Real-Time Updates
Unlike many indicators that only update on bar completion, this tool provides live updates for the developing candle, allowing traders to see evolving market conditions as they happen.
3. Market Flow Analysis
The unique "L/S" (Long/Short) metric combines open interest changes with price/volume direction to estimate net market positioning, helping identify when participants are accumulating or distributing positions.
4. Adaptive Visual Intensity
The gradient color system automatically adjusts based on historical context, making it easy to identify when current values are significant relative to recent market activity.
5. Complete Customization
Every aspect of the display can be customized, from the order of metrics to individual color schemes, allowing traders to adapt the tool to their specific analysis needs.
6.All In One Solution
6 Metrics in one indicator no more using 5 different indicators.
Core Features Explained
DELTA (Volume Delta)
What it shows: Net difference between aggressive buy volume and aggressive sell volume
Calculation: Uses lower timeframe data to determine whether each trade was initiated by buyers or sellers
Interpretation:
Positive values indicate aggressive buying pressure
Negative values indicate aggressive selling pressure
Magnitude indicates the strength of directional pressure
OI Δ (Open Interest Change)
What it shows: Change in open interest from the previous bar
Data source: Fetches open interest data using the "_OI" symbol suffix
Interpretation:
Positive values indicate new positions entering the market
Negative values indicate positions being closed
Combined with price direction, reveals market participant behavior
L/S (Net Long/Short Bias)
What it shows: Estimated net change in long vs short market positions
Calculation method: Combines open interest changes with price/volume direction using configurable logic
Scenarios analyzed:
New Longs: Rising OI + Rising Price/Volume = Long position accumulation
Liquidated Longs: Falling OI + Falling Price/Volume = Long position exits
New Shorts: Rising OI + Falling Price/Volume = Short position accumulation
Covered Shorts: Falling OI + Rising Price/Volume = Short position exits
Result: Net bias toward long (positive) or short (negative) market sentiment
TOTAL (Total Volume)
What it shows: Standard volume for the current bar
Purpose: Provides context for other metrics and baseline activity measurement
Enhanced display: Uses gradient intensity based on recent volume history
BUY (Estimated Buy Volume)
What it shows: Estimated aggressive buy volume
Calculation: (Total Volume + Delta) / 2
Use case: Helps quantify the actual buying pressure in monetary/contract terms
SELL (Estimated Sell Volume)
What it shows: Estimated aggressive sell volume
Calculation: (Total Volume - Delta) / 2
Use case: Helps quantify the actual selling pressure in monetary/contract terms
Configuration Options
Timeframe Settings
Custom Timeframe Toggle: Enable/disable custom lower timeframe selection
Timeframe Selection: Choose the precision level for volume delta calculations
Auto-Selection Logic: Automatically selects optimal timeframe based on chart timeframe
Net Positions Calculation
Direction Method: Choose between Price-based or Volume Delta-based direction determination
Value Method: Select between Open Interest Change or Volume for position size calculations
Display Customization
Row Order: Completely customize which metrics appear and in what order (6 positions available)
Color Schemes: Individual color selection for positive/negative values of each metric
Gradient Intensity: Configurable lookback period (10-200 bars) for relative intensity calculations
Visual Elements
Box Format: Clean, professional box display with clear labels
Color Coding: Intuitive color schemes with customizable transparency gradients
Real-time Updates: Live updating for developing candles with historical stability
How to Use This Indicator
For Day Traders
Volume Confirmation: Use DELTA to confirm breakout validity - strong directional moves should show corresponding volume delta
Entry Timing: Watch for volume delta divergences at key levels to time entries
Exit Signals: Monitor when aggressive volume shifts against your position
For Swing Traders
Market Flow: Focus on the L/S metric to identify when participants are accumulating or distributing
Open Interest Analysis: Use OI Δ to confirm whether moves are backed by new money or position adjustments
Trend Validation: Combine multiple metrics to validate trend strength and sustainability
For Scalpers
Real-time Edge: Utilize the live updates to see developing imbalances before bar completion
Quick Decision Making: Focus on DELTA and BUY/SELL for immediate market pressure assessment
Volume Profile: Use TOTAL volume context for optimal entry/exit sizing
Setup Recommendations
Futures Markets: Enable OI tracking and use Volume Delta direction method
Crypto Markets: Focus on DELTA and volume metrics; OI may not be available
Stock Markets: Use Price direction method with volume value calculations
High-Frequency Analysis: Set lower timeframe to 1S for maximum precision
Technical Implementation
Data Accuracy
Utilizes TradingView's ta.requestVolumeDelta() function for precise buy/sell classification
Implements error checking for data availability
Handles missing data gracefully with fallback calculations
Performance Optimization
Efficient array management with configurable lookback periods
Smart box creation and deletion to prevent memory issues
Optimized real-time updates without historical data corruption
Compatibility
Works on all timeframes from seconds to daily
Compatible with futures, forex, crypto, and stock markets
Automatically adjusts calculation methods based on available data
Risk Disclaimers
This indicator is designed for educational and analytical purposes. It provides statistical analysis of market data but does not guarantee trading success. Users should:
Combine with other forms of analysis
Practice proper risk management
Understand that past performance doesn't predict future results
Be aware that volume delta and open interest data quality varies by market and data provider
Conclusion
The Bar Statistics indicator represents a significant advancement in retail trader access to professional-grade market analysis tools. By combining multiple data sources into a single, customizable display, it provides the depth of analysis needed for comprehensive market microstructure understanding while maintaining the simplicity required for effective decision-making.

Trades in FavorTrades in Favor Indicator
Overview
The Trades in Favor indicator is a volume-weighted momentum oscillator that helps traders identify market conditions favoring long or short positions. It analyzes the relationship between price movements and volume to determine whether buying or selling pressure is dominating the market.
How It Works
The indicator calculates the percentage of volume-weighted price movements that are bullish versus bearish over a specified lookback period. It outputs values between 0-100:
Values above 70: Short Trade Zone (bearish conditions)
Values below 30: Long Trade Zone (bullish conditions)
Values around 50: Neutral Zone (balanced conditions)
Key Features
Volume-Weighted Analysis: Incorporates volume data for more accurate momentum readings
Clear Trading Zones: Visual zones with labels for immediate context
Customizable Parameters: Adjustable calculation length and smoothing periods
Built-in Alerts: Notifications when entering different trading zones
Information Table: Real-time display of current readings and percentages
Parameters
Calculation Length (20): Number of bars for momentum calculation
Smoothing Period (5): Moving average smoothing for cleaner signals
Short Trade Zone (70): Upper threshold for short trade conditions
Long Trade Zone (30): Lower threshold for long trade conditions
Trading Applications
Trend Confirmation: Validate trend direction with volume-backed momentum
Entry Timing: Identify optimal entry points in respective trade zones
Market Sentiment: Gauge overall buying vs selling pressure
Risk Management: Avoid trades against dominant market flow
Visual Elements
White oscillator line with clear zone boundaries
Background coloring in extreme zones
On-chart labels for immediate context
Information table showing current percentages
Customizable alert conditions
Best Practices
Use in conjunction with other technical analysis tools
Consider multiple timeframes for confirmation
Pay attention to volume spikes in extreme zones
Watch for divergences between price and the indicator
Perfect for swing traders, day traders, and anyone looking to align their trades with volume-backed market momentum.
BB + OBV + RSI Strategy (Enhanced + Daily Table) Script Brief – *BB + OBV + RSI Strategy (Enhanced + Daily Table)*
This TradingView Pine Script combines **Bollinger Bands (BB)**, **On-Balance Volume (OBV)**, **Relative Strength Index (RSI)**, and **Exponential Moving Average (EMA)** to help traders identify potential trend conditions and market strength.
**Key Features:**
* **Bollinger Bands** (20-period SMA ± 2 Std Dev by default) to track volatility and price extremes.
* **OBV & OBV Moving Average** to confirm buying or selling pressure.
* **RSI** to highlight overbought and oversold zones.
* **200 EMA** as a long-term trend filter.
* **Daily Comparison Table** (top-right corner):
* Displays today’s vs. yesterday’s values for Close, RSI, OBV vs MA, BB Position, and EMA Trend.
* Helps quickly assess whether momentum and trend conditions are strengthening or weakening.
**Usage:**
* The chart shows **BB lines and EMA** for real-time analysis on any timeframe.
* The **table provides higher-timeframe context** (daily values), making it easier to confirm signals across multiple timeframes.
* Best applied with backtesting and proper risk management.

[delta2win] ShockSentinel Early Warnings🚀 ShockSentinel Early Warnings — Advanced Multi-Symbol Shock Detection System
📊 UNIQUE METHODOLOGY:
This indicator implements a proprietary concordance-based shock detection system that goes beyond simple price movement analysis. Unlike basic pump/dump detectors, it uses a sophisticated multi-symbol correlation algorithm to validate signals across multiple assets simultaneously, significantly reducing false positives while maintaining sensitivity to genuine market shocks.
🔬 TECHNICAL APPROACH:
• Adaptive Threshold System: Automatically adjusts detection sensitivity based on timeframe using proprietary scaling algorithms:
- 1m: 0.5% threshold (ultra-sensitive for scalping)
- 3m: 1.0% threshold (high-frequency trading)
- 5m: 2.0% threshold (short-term momentum)
- 15m: 3.0% threshold (intraday swings)
- 1h: 6.0% threshold (daily moves)
- 4h+: 10.0% threshold (swing trading)
• Dual Detection Modes:
- Percent Mode: Calculates maximum percentage change within configurable lookback window (1-6 bars) using the formula: max(|(close - close ) / close * 100|) for i = 1 to window
- ATR-Normalized Mode: Uses Average True Range for volatility-adjusted detection across different market regimes: max(|close - close | / ATR) for i = 1 to window
• Concordance Algorithm: Proprietary multi-symbol validation system that requires minimum correlation count across up to 4 additional symbols, ensuring signals are validated by market-wide participation rather than isolated price movements
• Non-Repainting Architecture: Optional bar-close confirmation prevents false signals from intraday noise while maintaining real-time alert capability for immediate response
🎯 MATHEMATICAL FOUNDATION:
The core algorithm implements a sliding window maximum change detection:
Percent Change Calculation:
For each bar, the system calculates the maximum absolute percentage change over the specified window:
- PctChange = (close - close ) / close * 100
- MaxPct = max(|PctChange |) for i = 1 to window
- Signal triggers when MaxPct >= threshold
ATR-Normalized Calculation:
For volatility-adjusted detection:
- ATRChange = (close - close ) / ATR
- MaxATR = max(|ATRChange |) for i = 1 to window
- Signal triggers when MaxATR >= ATR_multiplier
Concordance Validation:
- Requires minimum N symbols showing same directional movement
- Validates signal strength through market participation
- Reduces false signals from isolated price movements
- Improves signal quality through correlation analysis
⚙️ ADVANCED FEATURES:
• Preset System: 7 pre-configured strategies with optimized parameters:
- Scalp (Ultra-Fast): 0.6x scaling, 2-bar window, real-time alerts
- Aggressive: 0.7x scaling, 2-bar window, real-time alerts
- Balanced: 1.0x scaling, 3-bar window, confirmed signals
- Conservative: 1.3x scaling, 4-bar window, confirmed signals
- Volatility-Adaptive: ATR mode, 7-period ATR, 2.5x multiplier
- Momentum (Intraday): ATR mode, 10-period ATR, 2.0x multiplier
- Swing (Slow): ATR mode, 14-period ATR, 2.8x multiplier
• Real-time vs Confirmed: Choose between immediate alerts or bar-close confirmation
• Visual Analytics: Integrated signal history table with concordance gauges and performance metrics
• Professional Alerts: Multi-format alert system (Compact, Extended, Plain, CSV) with Telegram integration and customizable messaging
💡 UNIQUE VALUE PROPOSITION:
Unlike simple price change detectors, this system provides:
1. Multi-Symbol Validation: Validates signals across multiple correlated assets, ensuring market-wide participation
2. Adaptive Thresholds: Automatically adjusts sensitivity based on timeframe and market conditions
3. Dual Signal Types: Provides both real-time and confirmed signal options for different trading styles
4. Comprehensive Analytics: Includes signal history, concordance gauges, and performance tracking
5. Advanced Concordance: Uses sophisticated correlation algorithms for signal validation
6. Professional Integration: Built-in Telegram support with customizable message formats
🔧 USAGE INSTRUCTIONS:
1. Select Preset: Choose appropriate strategy for your trading style and timeframe
2. Configure Symbols: Add up to 4 additional symbols for concordance validation
3. Set Concordance: Adjust minimum count (higher = more selective, lower = more sensitive)
4. Choose Mode: Select between real-time or confirmed signals based on your risk tolerance
5. Enable Alerts: Configure notification preferences and message formats
6. Monitor Performance: Use integrated tables to track signal quality and concordance
📈 PERFORMANCE CHARACTERISTICS:
• Optimized for Crypto: Designed specifically for high-volatility cryptocurrency markets
• Multi-Timeframe: Effective across all timeframes from 1-minute to 4-hour charts
• False Signal Reduction: Multi-symbol validation significantly reduces false positives
• Flexible Sensitivity: Adjustable thresholds allow customization for different market conditions
• Real-time Capability: Provides immediate alerts for fast-moving markets
• Confirmation Option: Bar-close confirmation for conservative trading approaches
⚠️ TECHNICAL CONSIDERATIONS:
• Real-time Mode: May generate multiple alerts per bar; use cooldown settings to manage frequency
• Data Dependencies: Concordance requires data availability for all configured symbols
• Market Regimes: ATR mode provides better performance in varying volatility conditions
• Signal Quality: Higher concordance requirements reduce false signals but may miss opportunities
• Latency: request.security calls depend on data provider latency and availability
🎯 TARGET MARKETS:
• Cryptocurrency Trading: High-volatility crypto markets with frequent shock events
• Scalping: Short-term trading strategies requiring immediate signal detection
• Swing Trading: Medium-term strategies benefiting from confirmed signals
• Portfolio Management: Multi-asset correlation analysis for risk management
• Algorithmic Trading: Systematic strategies requiring reliable signal validation
📊 SIGNAL INTERPRETATION:
• Green Arrows (Pump): Upward price shock with sufficient concordance
• Red Arrows (Dump): Downward price shock with sufficient concordance
• Large Markers: Confirmed signals with high concordance
• Small Markers: Early signals with lower concordance
• Background Colors: Visual intensity based on concordance strength
• Tables: Historical signal tracking with performance metrics

Volume Pressure Arrows[Blk0ut]Volume Pressure Arrows are an innovative (I think) market pressure tool designed to cut through noise and provide traders with a realistic, but quick insight into buying vs selling pressure and which has real control. Rather than relying on any single classic indicator, this script blends five complementary measures of price–volume dynamics—Cumulative Volume Delta (CVD), VWAP distance, OBV slope, ATR expansion, and the DMI ratio—into a unified “pressure score.”
Each component is normalized, weighted, and combined into a single metric that can be read at a glance through intuitive up and down arrows plotted directly on the chart. By transforming multiple complex data streams into a single aggregated signal, Volume Pressure Arrows help traders answer some of the hardest questions we can face: is the current move backed by conviction? is there true momentum? Is price action about to reverse?
Why It’s Different
Traditional oscillators often create conflicting signals, forcing traders to guess which one to trust. This indicator integrates five perspectives on volume and momentum pressure into a single framework, balancing raw flow (CVD), relative positioning (VWAP), trend conviction (OBV slope), volatility expansion (ATR), and directional bias (DMI). The result is a weighted, probability-minded score capped between -100 and +100 for consistency and clarity.
Important note : Inspiration for the use of directly plotted arrows came from dgtrd "https://www.tradingview.com/u/dgtrd/" and their brilliant work on LazyBear's Squeeze Indicator "https://www.tradingview.com/script/Dsr7B2xE-Squeeze-Momentum-Indicator-LazyBear-vX-by-DGT/"
How to Read It
Bullish Arrows appear below the candles when the pressure score pushes above the neutral threshold, signaling meaningful buyer dominance.
Bearish Arrows appear above the candles when pressure drops below the negative threshold, indicating strong selling pressure.
Neutral Arrows (smaller, faded) mark conditions where pressure exists but is not decisive—useful for spotting early rotations or fading momentum.
Color Gradients dynamically adjust with score intensity, making stronger signals visually brighter and weaker ones softer.
How to Use It Effectively
This tool is best applied as a confirmation and timing layer. It is not meant to replace your core strategy, but to validate whether momentum pressure supports your trade thesis.
Combine with trendlines, chart patterns, or breakouts to gauge conviction.
Use bullish or bearish arrows as filters, only take trades when price action aligns with strong directional pressure.
Watch neutral arrows near key levels; they often foreshadow balance breaking into directional moves.
Adjust the weightings to emphasize the components that matter most to your style (e.g., more weight on CVD for scalpers, or ATR expansion for volatility traders).
As with any indicator, this is not a magic ball and does not guarantee success. But it does allow you to increase the probability odds to your favor if you align it with your edge. Happy trading!
