Morning ORB FVG Trigger✅ Overview
Morning ORB FVG Trigger is a complete intraday trading framework built around:
A Morning Opening Range Breakout (ORB)
The first Fair Value Gap (FVG) after that breakout
Strict risk management and position sizing
Optional HTF trend filter (Daily / Weekly / Monthly)
Optional Daily ATR filter to avoid extreme days
The script is designed for futures / indices / FX on intraday charts up to 15 minutes and for traders who want a clean, mechanical entry framework with clear risk.
🧠 Core idea
Define a morning opening range (e.g. 09:30–09:45).
Wait for a clean breakout above/below that range.
After the breakout, wait for the first FVG in breakout direction,
confirmed by the next candle (no immediate full reclaim).
Use a chosen stop logic + R:R factor to build risk/reward boxes.
Calculate position size based on your account risk.
(Optional) Only take trades:
In the direction of the HTF EMA trend (D/W/M).
On days where the morning range is within a band of the Daily ATR.
You can also disable all signals/boxes and use the script just as a visual ORB tool.
⏰ 1. ORB / Morning Range
Inputs (Main section)
Morning Range Session
Time window of the opening range in exchange time
Example: 09:30–09:45 for a 15-minute ORB.
You can type custom ranges (e.g. 09:30–09:35 for a 5-minute ORB).
Risk/Reward (TP factor)
Multiplier for the take-profit distance relative to the stop.
2.0 = TP is 2× the stop distance
1.5 = TP is 1.5× the stop distance
Show ORB range
If enabled, draws:
ORB high/low lines
ORB labels (e.g. 15min ORB high / low)
Optional midline
Extend ORB lines to the right (bars)
How many bars to extend the ORB high/low horizontally beyond the ORB itself.
Trade box width (bars)
Horizontal width (in bars) of:
Red risk box (entry–stop)
Green reward box (entry–TP)
Implementation details
The ORB is always calculated on 1-minute data internally, so it stays precise even on 5m/15m charts.
The script only works on intraday timeframes up to 15 minutes.
📦 2. FVG Block
Group: “FVG”
Threshold %
Minimum size of an FVG in % of price.
0 = every FVG
Higher values = only larger gaps
Auto threshold (from volatility)
If enabled, the minimum FVG size is derived from historical volatility
instead of a fixed percentage.
Allow breakout FVG partly inside ORB
Off (default): the FVG must lie fully outside the ORB.
On: the breakout FVG itself may still overlap the ORB a bit,
as long as it is the first one attached to the breakout move.
Enable FVG entry signals, boxes & alerts
On: full system – FVG detection, entry labels, risk/TP boxes, alerts.
Off: no entries, no risk/TP boxes, no alerts.
You only get the ORB and (optionally) the HTF dashboard, so you can trade your own setups.
Entry mode
Entry mode (Mid / Edge / NextOpen)
Mid – Entry at the midpoint of the FVG.
Edge – Long at the upper FVG edge, short at the lower FVG edge.
NextOpen – No limit order in the gap. Entry is placed at the next bar open after FVG confirmation.
Edge offset (ticks)
Additional offset for Edge entries:
Long:
+ticks = a bit above the FVG (more conservative)
-ticks = deeper into the FVG (more aggressive)
Short:
+ticks = a bit below the FVG
-ticks = deeper into the FVG
FVG detection logic
Uses a LuxAlgo-style 3-candle FVG pattern (gap between candle 1 and 3).
Only one FVG is taken: the first valid FVG after the ORB breakout in breakup direction.
The FVG candle is the middle bar; the script:
Detects the FVG on the previous bar.
Waits for the current bar to confirm it:
Bullish: current low must stay above the lower FVG boundary
Bearish: current high must stay below the upper FVG boundary
Only then an entry signal is generated.
🛑 3. Stop Logic
Group: “Stop Logic”
Stop mode (PrevBar / Pivot / FVG Candle)
PrevBar – Stop at the low/high of the candle before the FVG
(tight/aggressive).
FVG Candle – Stop at the low/high of the FVG candle itself
(medium).
Pivot – Stop at the most recent swing high/low
using pivotLeft / pivotRight pivots (more conservative).
Ticks (stop buffer)
Offset (in ticks) from the selected stop level.
> 0 = further away (more room, more risk)
< 0 = closer (tighter stop)
Pivot left / Pivot right
Number of candles left/right to define a swing high/low
when using Pivot stop mode.
Typical intraday values: 2–3.
The script also sanity-checks the stop:
if the calculated stop would be invalid (e.g. above entry in a long), it moves it by a minimal distance (2 ticks) to keep a valid risk.
📈 4. HTF Trend Filter (Daily / Weekly / Monthly)
Group: “HTF Trend Filter”
Enable HTF trend filter
If enabled, trades are only allowed:
Long when at least 2 of D/W/M closes are above their EMA
Short when at least 2 of D/W/M closes are below their EMA
EMA length (D/W/M)
EMA length for all three higher timeframes (Daily, Weekly, Monthly).
This helps focus entries in the direction of the dominant higher-timeframe trend.
📊 5. ATR Filter (Daily)
Group: “ATR Filter (Daily)”
Use daily ATR filter
If enabled, the height of the ORB (ORB high – ORB low) must be within
a band of the Daily ATR to allow any signals.
Daily ATR length
ATR period on the Daily timeframe.
Min ORB size vs ATR
Lower bound:
Example: 0.3 → ORB must be at least 0.3 × Daily ATR
0.0 = no minimum.
Max ORB size vs ATR
Upper bound:
Example: 1.5 → ORB must be ≤ 1.5 × Daily ATR
0.0 = no maximum.
If the ORB is too small (choppy) or too large (exhausted move), no breakout or FVG signal will be generated on that day.
🧭 6. HTF Dashboard & Signal Labels
Group: “HTF Trend Dashboard”
Show HTF dashboard
Draws a small label at the top of the chart showing:
HTF Trend (EMA X)
D: UP/FLAT/DOWN
W: UP/FLAT/DOWN
M: UP/FLAT/DOWN
Dashboard position
Top Right, Top Center, Top Left – places the dashboard at the top.
Over Risk Info – no top dashboard; instead, the HTF trend info is shown as a label near the risk box when a new signal appears.
Lookback (bars) for top anchor
How many bars to use to determine the top price level for dashboard placement.
Show HTF trend above risk box on signal
Only relevant if Dashboard position = Over Risk Info.
When enabled, a small HTF label appears near the risk box for each new trade.
Signal label vertical offset (ticks)
Vertical spacing between risk info label and HTF label.
Minimum spacing HTF/Risk (ticks)
Ensures a minimum vertical distance so the two labels don’t overlap.
HTF signal label X offset (bars)
Horizontal offset (left/right) relative to the risk info label.
⏳ 7. ORB–FVG Filters (Session & Time Window)
Group: “ORB FVG Filter”
Only same session day
If enabled, FVG entries are only allowed on the same calendar day
as the ORB. When the date changes, all state & drawings are reset.
Limit hours after ORB
Enables a time window after the ORB end.
Trading window after ORB (hours)
Length of that window in hours.
Example: 2.0 → FVG signals only in the first 2 hours after ORB end.
💰 8. Risk Management & Position Sizing
Group: “Risk Management”
Calculate position size
If enabled, the script computes suggested mini and micro contract size for you.
Account size
Your trading account size (in account currency).
Risk mode
Percent – risk is a % of account size (Account risk %).
Fixed amount – risk is a fixed dollar amount (Fixed risk ($)).
Account risk %
Risk per trade as a percentage of account size (e.g. 1.0 for 1%).
Fixed risk ($)
Fixed risk per trade in dollars when using Fixed amount mode.
Micro factor (vs mini)
How much a micro contract is worth relative to a mini.
Example:
0.1 → one micro moves 1/10 of one mini.
Risk Info label
For each new trade, a label is shown above the boxes with:
Stop distance in price and $ risk per mini
Max risk allowed for the trade
Suggested mini and micro size
Text like:
Suggested: 2 mini
Suggested: 5 micro
or Suggested: no trade
This makes the script especially useful for prop-firm rules or strict risk discipline.
🎨 9. Visual Style (Boxes, Labels, ORB Lines)
Group: “Box & Label Style (Trade)”
Label font size (Very small, Small, Normal, Large)
Entry label BG / text color
Stop label BG / text color
TP label BG / text color
Risk info BG / text color
Risk box color (entry–stop zone)
Reward box color (entry–TP zone)
Group: “ORB Style”
ORB high line color
ORB low line color
ORB line width
ORB label font size
ORB label background color
ORB label text color
Show ORB midline
ORB midline color / width / style (Solid / Dashed / Dotted)
⚠️ 10. Alerts
Group: “Alerts”
The script defines three alert conditions:
Long entry FVG breakout
Triggered when a new long signal appears.
Short entry FVG breakout
Triggered when a new short signal appears.
FVG entry (long/short)
Generic alert for any new signal (long or short).
To use them:
Add the indicator to the chart.
Open the Alerts dialog → “Condition”.
Select this script and one of the alert conditions.
Set your preferred expiration and notification settings.
Alerts only fire when Enable FVG entry signals, boxes & alerts is on.
🧩 11. How the trading logic flows (summary)
Build ORB on 1-minute data during the selected session.
Optionally reject the day if ORB is outside the ATR bounds.
Wait for a breakout (close above high or below low), respecting HTF trend filter.
After breakout, look for the first valid FVG in that direction:
Outside the ORB (unless breakout FVG allowed inside)
Confirmed by the next candle (no full reclaim)
Once confirmed:
Compute entry, stop, target.
Draw risk/reward boxes and all labels.
Optionally show HTF signal label over the risk info.
Trigger alerts if enabled.
If you disable FVG signals, only steps 1–3 (plus dashboard) are effectively active.
⚠️ 12. Notes & Disclaimer
Script is intended for intraday trading up to 15-minute timeframes.
All signals are mechanical and do not guarantee profitability.
Always backtest and forward-test on your own data before risking real money.
This script is for educational purposes only and is not financial advice.
🚀 Quick-start guide
Add the script to your chart
Use an intraday timeframe ≤ 15 minutes (1m, 3m, 5m, 15m).
Works best on liquid indices, futures, FX and large-cap stocks.
Set the Morning Range
In “Morning Range Session” choose the exchange’s opening window.
Examples
US index futures (CME): 08:30–08:45 or 08:30–08:35
US stocks (NYSE/Nasdaq): 09:30–09:45 or 09:30–09:35
The ORB is always calculated on 1-minute data internally, so the range stays accurate on higher intraday charts.
Keep the default filters at first
HTF Trend Filter: ON
EMA length = 20
This will only allow trades in the direction of the dominant D/W/M trend.
ATR Filter: OFF (optional; you can enable later once you’re comfortable).
Use the full trade system
In the FVG group leave
“Enable FVG entry signals, boxes & alerts” = ON
Entry mode: Mid
Stop mode: FVG Candle or PrevBar
Risk/Reward: 2.0 as a starting point.
Set your risk
Turn on “Calculate position size”.
Enter your Account size and choose either:
Risk mode = Percent (e.g. 1.0 = 1% per trade), or
Risk mode = Fixed amount (e.g. $250 per trade).
The risk info label will show:
Stop distance in price and $/contract
Max allowed risk
Suggested mini and micro contract size.
Enable alerts (optional)
Open the Alerts dialog → Condition: this script.
Choose one of:
Long entry FVG breakout
Short entry FVG breakout
FVG entry (long/short)
Choose “Once per bar” or “Once per bar close”, and your preferred notification type.
Replay & journal
Use the TradingView bar replay tool to step through past days.
Focus on:
How the ORB defines the structure.
How the first confirmed FVG outside the ORB behaves.
Whether the risk/TP levels fit your own style and product.
🎛 Recommended settings & profiles
These are starting points, not rules. Always adapt to the instrument and your own risk tolerance.
1. Conservative / Trend-following
Timeframe: 5m or 15m
Morning Range Session: 15-minute ORB around the cash or futures open
FVG
Threshold %: 0.05–0.1 (filter out very small gaps)
Auto threshold: OFF (keep it simple)
Allow breakout FVG partly inside ORB: OFF
Enable FVG entry signals/boxes/alerts: ON
Entry mode: Mid
Stop Logic
Stop mode: Pivot
Pivot left/right: 2–3
Stop buffer: +1–2 ticks
HTF Trend Filter
Enabled: ON
EMA length: 20
ATR Filter
Enabled: ON
Daily ATR length: 14
Min ORB vs ATR: 0.3–0.4
Max ORB vs ATR: 1.2–1.5
Risk Management
Risk mode: Percent
Account risk: 0.5–1.0%
Idea: Only trade when the higher-timeframe trend supports the move and the opening range is of a “normal” size for the current volatility.
2. Balanced / Intraday directional
Timeframe: 3m or 5m
FVG
Threshold %: 0.02–0.05
Auto threshold: ON (lets the script adapt to volatility)
Allow breakout FVG partly inside ORB: ON
(first breakout FVG may partly sit inside the ORB)
Entry mode: Edge
Edge offset (ticks): 0 or +1
Stop Logic
Stop mode: FVG Candle
Stop buffer: 0–1 ticks
HTF Trend Filter
Enabled: ON
ATR Filter
Enabled: OFF (optional)
Risk Management
Risk mode: Percent
Account risk: 1.0–1.5% (if this fits your plan)
Idea: Slightly more aggressive entries at the gap edge, still aligned with HTF trend, but with more flexibility on ATR.
3. Aggressive / Scalping around the ORB
Timeframe: 1m or 3m
FVG
Threshold %: 0.0–0.02
Auto threshold: ON
Allow breakout FVG partly inside ORB: ON
Entry mode: NextOpen or Edge with a negative offset (deeper into the gap)
Stop Logic
Stop mode: PrevBar
Stop buffer: 0 or -1 tick
HTF Trend Filter
Enabled: OFF (or ON but treat as soft guidance)
ATR Filter
Enabled: OFF
Risk Management
Risk mode: Percent
Account risk: lower, e.g. 0.25–0.5% per trade
Idea: More trades and tighter stops. Best for experienced traders who understand the limitations of scalping and whipsaw risk.
Final reminder
All of these are templates, not guarantees:
Always check how the system behaves on your market and session.
Start on replay and demo before trading real money.
Adjust filters (HTF, ATR, thresholds) until the signals fit your personal approach.
Cari dalam skrip untuk "黄金近20年走势"

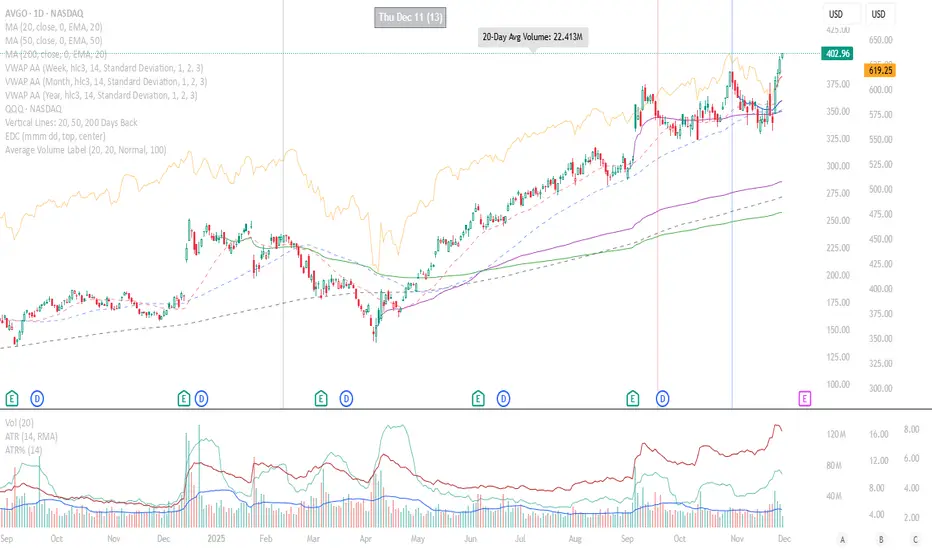
Average Volume LabelAverage Volume Label Indicator
This TradingView Pine Script creates a customizable label that displays the average trading volume over a specified period directly on your price chart.
Core Functionality:
Calculates the simple moving average (SMA) of volume over a user-defined number of days (default: 20 days)
Displays this average in a positioned label at the top of the chart
The label shows text like "20-Day Avg Volume: 1.2M" with automatic volume formatting
Key Customization Options:
Volume Calculation:
Adjustable lookback period (1-200 days) for the volume average
Label Appearance:
Text color, background color, and transparency controls
Five size options (Tiny to Huge)
Configurable horizontal position (how many bars back from the current bar to place the label)
Technical Implementation:
Updates only on the most recent bar to optimize performance
Positions the label at the highest price point within the visible range for consistent top-of-chart placement
Includes safety checks to prevent runtime errors with lookback periods
Also plots the average volume data (visible in the data window for reference)
This indicator is useful for traders who want to quickly assess whether current volume is above or below the recent average without cluttering their chart with additional panes.
Breakout Pullback Continuation//@version=5
indicator("Breakout Pullback Continuation", overlay=true)
// === Parameters ===
lookback = 20 // Look for breakouts above this many bars
volumeFactor = 1.3 // How much volume needs to exceed average
pullbackDepth = 3 // Max bars to wait for pullback + green
// === Track State ===
var float breakoutLevel = na
var int breakoutBar = na
volumeSMA = ta.sma(volume, 20)
// === Detect Breakout ===
recentHigh = ta.highest(high, lookback)
breakout = close > recentHigh
if breakout
breakoutLevel := close
breakoutBar := bar_index
// === Check for Pullback After Breakout
pullbackOccurred = na(breakoutLevel) ? false : close < breakoutLevel and bar_index > breakoutBar
// === Check for Confirmation Candle
greenCandle = close > open
decentRange = (high - low) > (close * 0.003)
volumeSpike = volume > volumeSMA * volumeFactor
confirmation = pullbackOccurred and greenCandle and decentRange and volumeSpike and (bar_index - breakoutBar <= pullbackDepth)
// === Signal Plot ===
plotshape(confirmation, title="Pullback Continuation", location=location.belowbar, color=color.lime, style=shape.triangleup)
alertcondition(confirmation, title="Breakout Pullback Alert", message="🚀 {{ticker}} breakout-pullback-confirmation at {{close}}")

Momentum Breakout Signal//@version=5
indicator("Momentum Breakout Signal", overlay=true)
// === Breakout Logic ===
length = 20 // Lookback for recent high
recentHigh = ta.highest(high, length)
// === Breakout Condition: Close > prior high
priceBreakout = close > recentHigh
// === Volume Spike Confirmation ===
volumeSMA = ta.sma(volume, 20)
volumeSpike = volume > volumeSMA * 1.3 // Customize sensitivity
// === Optional: Filter for strong candles only
isGreen = close > open
decentRange = (high - low) > (close * 0.003)
// === Final Signal Logic ===
signal = priceBreakout and volumeSpike and isGreen and decentRange
plotshape(signal, title="Breakout Signal", location=location.abovebar, color=color.orange, style=shape.triangleup, size=size.small)
alertcondition(signal, title="Momentum Breakout Alert", message="🚀 {{ticker}} breakout confirmed at {{close}}")

Price Channel ScalpingMy X account:@CTF_bule_lotus
1. Core Logic (Price Channel Breakout)
The strategy relies on a single, simple indicator: the highest high of the past 20 bars.
When the current price breaks above this 20-period high, a stop entry is used to initiate a long position.
This design avoids prediction.
The model waits for the market to demonstrate momentum before participating.
2. Trade Direction (Long Only)
The strategy exclusively trades long positions and does not take shorts.
This choice is based on:
ETH’s historically upward-biased structure
Avoiding noise from two-sided signals during high-volatility periods
Keeping the direction consistent, which is beneficial for scalping-style systems
3. Risk Management (Fixed TP / SL)
Immediately after entry, the strategy sets two fixed exit conditions:
Take Profit: +10 price units
Stop Loss: –10 price units
Both are automatically converted using the market’s minimum tick size to ensure cross-instrument applicability.
This fixed TP/SL structure is typical in scalping systems:
small wins, fast exits, controlled losses, high turnover.
4. Transaction Costs
A 0.03% fee is applied to every trade throughout the entire backtest.
This fee level reflects the cost structure of major centralized exchanges, making results closer to real-world conditions.
5. Data & Time Range (2016–2025 Full Sample)
The backtest uses ETH’s complete historical dataset from 2016 to 2025.
No subjective filtering is applied—large moves, flash crashes, and black-swan events are all included.
The strategy does not rely on heavy parameter tuning, reducing the risk of overfitting.
6. Backtest Results (Including Fees)
Under this fixed, rule-based structure, the cumulative return is:
1,202,002.77% (2016 → 2025)
Even after including transaction fees, performance is driven by:
High trade frequency and small profit targets
Strict loss containment
Capturing momentum during breakout regimes
7. Transparency & Reproducibility
I will publish the full Pine Script implementation, including:
Entry logic
Exit logic
Fee configuration
All parameters
Backtesting framework
Transparency and reproducibility remain the core principles of this research.

Dual MACD AccelerationDual MACD Acceleration Indicator – Synopsis
Purpose:
This indicator identifies early momentum shifts in the market by comparing a fast MACD (8/20/6) with a slower MACD (12/26/9). It highlights potential strong buy and sell signals when the faster MACD crosses the slower MACD, allowing traders to catch trend accelerations before the full move develops.
Components
Fast MACD (8/20/6)
Responds quickly to short-term price changes.
Detects early momentum shifts.
Slow MACD (12/26/9)
Captures the dominant trend.
Provides a smoother reference for comparison.
Acceleration Signals
Long (▲): Fast MACD crosses above Slow MACD → potential bullish acceleration.
Short (▼): Fast MACD crosses below Slow MACD → potential bearish acceleration.
Zero Line
Optional visual reference for overall trend direction.
Crosses above zero = bullish trend, below zero = bearish trend.
Key Features
Clean, minimal chart display.
Optional toggles to show/hide each MACD line.
Label markers indicate crossovers.
Built-in alert conditions for automated notifications.
Trading Use
Trend Confirmation:
Best used with higher timeframe filters (VWAP or EMAs) to avoid fakeouts.
Entry Timing:
Enter on the first pullback after a crossover signal.
Only trade in the direction of the dominant trend.
Stops & Risk:
Use recent swing lows/highs for stop placement.
TP levels can be structure-based or trailing with price momentum.
Synopsis Summary:
The Dual MACD Acceleration Indicator is a lightweight, early-momentum tool designed for scalpers and short-term traders. It captures fast shifts in trend by comparing a faster and slower MACD, highlighting strong buy and sell opportunities while remaining clean and easy to read. For higher accuracy, combine with trend filters like VWAP or EMAs.

Roshan Dash Ultimate Trading DashboardHas the key moving averages sma (10,20,50,200) in daily and above timeframe. And for lower timeframe it has ema (10,20,50,200) and vwap. Displays key information like marketcap, sector, lod%, atr, atr% and distance of atr from 50sma . All things which help determine whether or not to take trade.

Breakout with Alma & Slope - for high volatility playSometimes best not to overthink,
buy at line crosses ;)
NFA, DYOR
best for 15m-1Hr, high volatility FX,Gold etc
Long only when 3 conditions met:-
- Fast Alma crosses Slow Alma
-Angle Pointing UP
-ADX above 20
Short when
- aqua line below navy line
- navy line pointing down
- adx >20
EXIT
- Trailing Stop: The trade closes automatically if price hits the **Red Stepped Line** (this is your safety net that follows the price).
- Emergency Exit:** The trade closes immediately if the ALMA lines cross back in the opposite direction (Reversal).

Sk M Sir JiSimple indicator that plots three alma moving averages and provides bgcolor based on below conditions
Red => If RSI (length 14) is below 50 or low is below the lower Bollinger band (length 20)
Green => If RSI (length 14) is above 50 or high is above the upper Bollinger band (length 20)

Consolidation Breakout PRO — Clean Boxes + 200 EMA Trend Filter High-probability range breakout detector that draws perfect, always-visible consolidation boxes and only alerts when price breaks out with strong volume and (optionally) in the direction of the prevailing trend.
Features
Automatically draws and extends clean consolidation boxes in real time
Boxes stop extending the moment the breakout occurs — no more “ghost” lines
Optional but powerful 200 EMA trend filter (dramatically reduces false breakouts)
Stronger volume confirmation (default 1.8× the 20-period average, fully adjustable)
Auto-deletes old boxes so your chart stays perfectly clean even after hundreds of signals
Clear “BREAKOUT ↑” and “BREAKDOWN ↓” labels + ready-to-use alerts
Works on any market and any timeframe (best on 1H, 4H, Daily)
How to trade it (edge > 65 % when used correctly)
Wait for the labeled breakout candle to close
Enter on pullback/retest of the box edge (or on strong close + retest)
Stop-loss just outside the opposite side of the box
Take-profit: minimum 1:2, ideally measured move (box height added/subtracted) or trailing with the 20 EMA
This is the cleanest and most professional public consolidation breakout tool available in 2025 — no repainting, no lag, no chart clutter.
Created and continuously improved with love for the TradingView community.

Grok/Claude MoneyLine Fusion * Grok/Claude X SeriesMoneyLine Fusion Indicator
This is a technical analysis indicator designed to help traders identify potential buy and sell opportunities in the market. It combines several well-known trading concepts into one unified tool, displaying visual bands on the chart and generating signals when multiple conditions align.
The Core Concept: The "Money Line"
At the heart of this indicator is something called the Money Line, which is essentially a smoothed trend line calculated using linear regression over the last 16 bars (by default). Think of it as a "best fit" line through recent prices that shows you the general direction the market is heading. The indicator colors this line green when the trend is rising, red when it's falling, and yellow when it's essentially flat or undecided.
The Dynamic Bands
Surrounding the Money Line are upper and lower bands that expand and contract based on market volatility. These bands use the ATR (Average True Range) to measure how much the price typically moves. Here's where it gets clever: the bands also factor in the ADX indicator (which measures trend strength). When the market is trending strongly, the bands widen more aggressively to account for bigger price swings. When the trend is weak, they stay tighter. This adaptive behavior helps the indicator adjust to different market conditions automatically.
The area between the bands is shaded in the trend color (green, red, or yellow) to give you a quick visual of the current market bias.
How Buy and Sell Signals Are Generated
The indicator doesn't just look at one thing — it requires multiple conditions to align before triggering a signal. This is designed to filter out false signals and only alert you when several factors agree.
Signal TypeRequired ConditionsBUYFisher Transform is below -2.0 (oversold), Aroon Up is low (below 20), Aroon Down is high (above 80), and optionally a positive TA ScoreSELLFisher Transform is above +2.0 (overbought), Aroon Up is high (above 80), Aroon Down is low (below 20), and optionally a negative TA Score
Fisher Transform is a mathematical technique that converts price data into a bell curve distribution, making extreme readings (overbought/oversold) easier to spot.
Aroon measures how long it's been since the highest high or lowest low. When Aroon Down is high and Aroon Up is low, it suggests recent price action has been dominated by lows — a potential reversal setup for a buy.
The indicator also prevents signal spam by requiring at least 5 bars between signals of the same type.
The TA Scoring System
Behind the scenes, the indicator calculates a composite score based on four different technical indicators:
MACD — Momentum and trend direction (scores -2 to +2)
DMI — Directional movement comparing buyers vs sellers (scores -2 to +2)
MFI — Money Flow Index, similar to RSI but incorporates volume (scores -2 to +2)
RSI — Classic overbought/oversold measure (scores -1 to +1)
These scores are added together, and the result is displayed in the info panel with labels like "very bullish," "slightly bearish," or "neutral." You can optionally require a minimum TA score before signals trigger, adding another layer of confirmation.
Visual Display Elements
The indicator offers several optional display features:
Shaded bands between upper and lower lines
Buy/Sell labels directly on the chart showing the entry price
Bright blue candle highlighting when a signal fires
Info panel in the corner showing the Money Line value, volatility percentile, RSI, and TA score
Score dots at the bottom of the chart (green for bullish, red for bearish, yellow for neutral)
Debug table for troubleshooting that shows real-time values of Fisher, Aroon, and signal conditions
In Summary
This indicator is essentially a multi-factor confirmation system. Rather than relying on a single indicator that might give many false signals, it waits until the trend direction (Money Line), momentum extremes (Fisher Transform), price cycle position (Aroon), and overall technical picture (TA Score) all point in the same direction. The adaptive bands help visualize where price "should" be trading given current volatility and trend strength. It's designed for traders who prefer fewer but higher-conviction signals.

Dumb Money Flow - Retail Panic & FOMO# Dumb Money Flow (DMF) - Retail Panic & FOMO
## 🌊 Overview
**Dumb Money Flow (DMF)** is a powerful **contrarian indicator** designed to track the emotional state of the retail "herd." It identifies moments of extreme **Panic** (irrational selling) and **FOMO** (irrational buying) by analyzing on-chain data, volume anomalies, and price velocity.
In crypto markets, retail traders often buy the top (FOMO) and sell the bottom (Panic). This indicator helps you do the opposite: **Buy when the herd is fearful, and Sell when the herd is greedy.**
---
## 🧠 How It Works
The indicator combines multiple data points into a single **Sentiment Index** (0-100), normalized over a 90-day period to ensure it always uses the full range of the chart.
### 1. Panic Index (Bearish Sentiment)
Tracks signs of capitulation and fear. High values contribute to the **Panic Zone**.
* **Exchange Inflows:** Spikes in funds moving to exchanges (preparing to sell).
* **Volume Spikes:** High volume during price drops (panic selling).
* **Price Crash (ROC):** Rapid, emotional price drops over 3 days.
* **Volatility (ATR):** High market nervousness and instability.
### 2. FOMO Index (Bullish Sentiment)
Tracks signs of euphoria and greed. High values contribute to the **FOMO Zone**.
* **Exchange Outflows:** Funds moving to cold storage (HODLing/Greed).
* **Profitable Addresses:** When >90% of holders are in profit, tops often form.
* **Parabolic Rise:** Rapid, unsustainable price increases.
---
## 🎨 Visual Guide
The indicator uses a distinct color scheme to highlight extremes:
* **🟢 Dark Green Zone (> 80): Extreme FOMO**
* **Meaning:** The crowd is euphoric. Risk of a correction is high.
* **Action:** Consider taking profits or looking for short entries.
* **🔴 Dark Burgundy Zone (< 20): Extreme Panic**
* **Meaning:** The crowd is capitulating. Prices may be oversold.
* **Action:** Look for buying opportunities (catching the knife with confirmation).
* **🔵 Light Blue Line:**
* The smoothed moving average of the sentiment, helpful for seeing the trend direction.
---
## 🛠️ How to Use (Trading Strategies)
### 1. Contrarian Reversals (The Primary Strategy)
* **Buy Signal:** Wait for the line to drop deep into the **Burgundy Panic Zone (< 20)** and then start curling up. This indicates that the worst of the selling pressure is over.
* **Sell Signal:** Wait for the line to spike into the **Green FOMO Zone (> 80)** and then start curling down. This suggests buying exhaustion.
### 2. Divergences
* **Bullish Divergence:** Price makes a **Lower Low**, but the DMF Indicator makes a **Higher Low** (less panic on the second drop). This is a strong reversal signal.
* **Bearish Divergence:** Price makes a **Higher High**, but the DMF Indicator makes a **Lower High** (less FOMO/buying power on the second peak).
### 3. Trend Confirmation (Midline Cross)
* **Crossing 50 Up:** Sentiment is shifting from Fear to Greed (Bullish).
* **Crossing 50 Down:** Sentiment is shifting from Greed to Fear (Bearish).
---
## ⚙️ Settings
* **Data Source:** Defaults to `INTOTHEBLOCK` for on-chain data.
* **Crypto Asset:** Auto-detects BTC/ETH, but can be forced.
* **Normalization Period:** Default 90 days. Determines the "window" for defining what is considered "Extreme" relative to recent history.
* **Weights:** You can customize how much each factor (Volume, Inflows, Price) contributes to the index.
---
**Disclaimer:** This indicator is for educational purposes only. "Dumb Money" analysis is a probability tool, not a crystal ball. Always manage your risk.
**Indicator by:** @iCD_creator
**Version:** 1.0
**Pine Script™ Version:** 6
---
## Updates & Support
For questions, suggestions, or bug reports, please comment below or message the author.
**Like this indicator? Leave a 👍 and share your feedback!**

💀 DarkPool's Moving Averages 💀DarkPool's Moving Averages is a consolidated trend analysis tool that allows traders to plot up to five distinct moving averages (MAs) within a single indicator pane. This script is designed to declutter trading charts by replacing multiple individual indicator instances with one comprehensive solution.
Beyond standard plotting, the indicator features Multi-Timeframe (MTF) capabilities, allowing users to overlay higher-timeframe trends (e.g., Daily or Weekly averages) onto lower-timeframe charts (e.g., 5-minute or 1-hour). It also utilizes dynamic color-coding to visually indicate instantaneous trend direction based on the slope of the moving average.
Key Features
5-in-1 Architecture: Configure and toggle up to five independent moving averages simultaneously.
Multi-Timeframe (MTF) Support: Calculate moving averages based on timeframes different from the current chart (e.g., view a 200-day EMA while trading on a 15-minute chart).
Dynamic Trend Coloring: Lines automatically change color based on their slope (rising vs. falling) to provide immediate visual trend confirmation.
Versatile Calculation Models: Supports major averaging methods including SMA, EMA, WMA, RMA, VWMA, and HMA.
How to Use
1. Trend Identification The primary use of this tool is to identify the market trend direction at a glance.
Bullish Trend: When the Moving Average line is colored in the "Bullish Color" (default: dark/green tones) and sloping upward.
Bearish Trend: When the Moving Average line is colored in the "Bearish Color" (default: light/red tones) and sloping downward.
2. Dynamic Support and Resistance Traders can use specific lengths (e.g., 50, 100, 200) to identify dynamic support and resistance levels.
Entry: In an uptrend, price retracing to a rising MA often presents a buying opportunity.
Exit: In a downtrend, price rallying to a falling MA often presents a selling opportunity.
3. The "Ribbon" Effect By enabling multiple MAs with sequential lengths (e.g., 10, 20, 50, 100, 200), traders can visualize the strength of the trend.
Expansion: When the lines spread apart, the trend is strengthening.
Contraction/Crossover: When the lines converge or cross, the trend is weakening or consolidating.
4. Multi-Timeframe Analysis Use the "Timeframe" input in the General Settings to lock the calculations to a specific period.
Example: Set the Timeframe to "D" (Daily) and the Length to 200. You can now drop down to a 5-minute chart, and the indicator will still display the significant 200-Day Moving Average, acting as a major anchor for intraday price action.
Configuration Guide
General Settings
Timeframe: Determines the data source for all MAs. Leave at default to use the current chart's timeframe, or select a specific higher timeframe for macro analysis.
Price Source: Selects the data point used for calculation (Close, Open, High, Low, etc.).
Moving Average Configurations (MA1 - MA5) Each of the five slots allows for individual customization:
Enable: Toggle the visibility of the specific MA.
Type: Select the calculation method.
SMA: Simple Moving Average (Standard).
EMA: Exponential Moving Average (Weight on recent data).
HMA: Hull Moving Average (Reduced lag).
VWMA: Volume Weighted Moving Average.
WMA/RMA: Weighted and Rolling Moving Averages.
Note: While many types are listed, the script explicitly calculates the types listed above; others may default to standard SMA behavior.
Length: The lookback period (e.g., 20, 50, 200).
Colors (Bull/Bear): Customize the colors used when the line is rising versus falling.
Line Style: Choose between Solid, Dashed, or Dotted lines to differentiate between the five MAs.
Disclaimer: This indicator is provided for educational and informational purposes only. It does not constitute financial advice, investment recommendations, or a guarantee of future results.

🔥 DarkPool's Fear & Greed v4 🔥DarkPool Fear & Greed v4 is a composite sentiment indicator designed to gauge market psychology in real-time. Unlike standard oscillators that rely on a single metric, this tool aggregates data from four distinct technical sources—RSI, MACD, Bollinger Bands, and Moving Averages—to create a unified "Index Score" ranging from 0 to 100.
Beyond general sentiment, the script employs custom algorithms to detect specific market anomalies, including sustainable buying pressure (FOMO), capitulation events (Panic), and trend reversals (Divergences).
Key Features
Composite Index: A weighted average of Momentum, Trend, Volatility, and Price Location.
Anomaly Detection: Specialized logic to flag high-momentum "FOMO" events and high-volatility "Panic" drops.
Divergences: Automatically spots bearish and bullish discrepancies between the sentiment index and price action.
Live Dashboard: A real-time data table displaying current sentiment zones, intensity scores, and volume ratios.
How to Use
1. The Fear & Greed Index The main oscillator line moves between 0 and 100 to visualize market sentiment:
0-20 (Extreme Fear): Deeply oversold; potential capitulation or buying opportunity.
20-40 (Fear): General bearish sentiment.
40-60 (Neutral): Indecisive market.
60-80 (Greed): General bullish sentiment.
80-100 (Extreme Greed): Overbought conditions; potential for a pullback.
2. Visual Signals
FOMO (Triangle Up): Marks candles with excessive buying volume and RSI momentum.
Panic (Triangle Down): Marks candles with sharp percentage drops and volatility spikes.
Divergences (Circles): distinct markers appear when price action contradicts the sentiment index, often signaling a reversal.
3. The Dashboard Located on the chart, the dashboard provides a snapshot of the current market state, including the specific "Intensity" of FOMO or Panic events and a Volume-to-MA ratio to gauge participation.
4. Alerts The script is fully integrated with the alert system. You can set alerts for "Any alert() function call" to receive dynamic notifications for FOMO detections, Panic drops, Extreme Zone entries, and confirmed Divergences.
Disclaimer This indicator is provided for educational and informational purposes only. It does not constitute financial advice, investment recommendations, or a guarantee of future results.

Pin Bar Highlighter//@version=5
indicator("Pin Bar Highlighter", overlay=true)
body = math.abs(close - open)
upperWick = high - math.max(open, close)
lowerWick = math.min(open, close) - low
bullPin = (lowerWick >= body * 2) and (close > open)
bearPin = (upperWick >= body * 2) and (close < open)
bullColor = color.rgb(10, 20, 80)
bearColor = color.rgb(255, 20, 150)
barcolor(bullPin ? bullColor : bearPin ? bearColor : na)

Futures Momentum Scanner – jyoti//@version=5
indicator("Futures Momentum Scanner – Avvu Edition", overlay=false, max_lines_count=500)
//------------------------------
// USER INPUTS
//------------------------------
rsiLen = input.int(14, "RSI Length")
macdFast = input.int(12, "MACD Fast")
macdSlow = input.int(26, "MACD Slow")
macdSignal = input.int(9, "MACD Signal")
stLength = input.int(10, "Supertrend Length")
stMult = input.float(3.0, "Supertrend Multiplier")
//------------------------------
// SUPER TREND
//------------------------------
= ta.supertrend(stMult, stLength)
trendUp = stDirection == 1
//------------------------------
// RSI
//------------------------------
rsi = ta.rsi(close, rsiLen)
rsiBull = rsi > 50 and rsi < 65
//------------------------------
// MACD
//------------------------------
= ta.macd(close, macdFast, macdSlow, macdSignal)
macdBull = macd > signal and macd > 0
//------------------------------
// MOVING AVERAGE TREND
//------------------------------
ema20 = ta.ema(close, 20)
ema50 = ta.ema(close, 50)
ema200 = ta.ema(close, 200)
trendStack = ema20 > ema50 and ema50 > ema200
//------------------------------
// BREAKOUT LOGIC
//------------------------------
prevHigh = ta.highest(high, 20)
breakout = close > prevHigh
//------------------------------
// FINAL SCANNER LOGIC
//------------------------------
bullishCandidate = trendUp and rsiBull and macdBull and trendStack and breakout
//------------------------------
// TABLE OUTPUT FOR SCANNER FEEL
//------------------------------
var table t = table.new(position.top_right, 1, 1)
if barstate.islast
msg = bullishCandidate ? "✔ BUY Candidate" : "– Not a Setup"
table.cell(t, 0, 0, msg, bgcolor=bullishCandidate ? color.new(color.green, 0) : color.new(color.red, 70))
//------------------------------
// ALERT
//------------------------------
alertcondition(bullishCandidate, title="Scanner Trigger", message="This stock meets Avvu's futures scanner criteria!")
