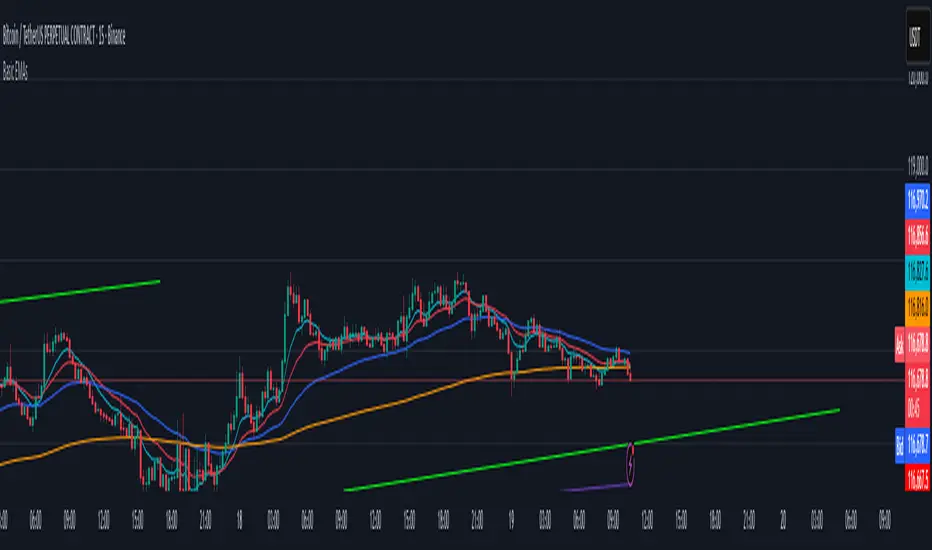
Guppy MMA 3, 5, 8, 10, 12, 15 and 30, 35, 40, 45, 50, 60Guppy Multiple Moving Average
Short Term EMA 3, 5, 8, 10, 12, 15
Long Term EMA 30, 35, 40, 45, 50, 60
Use for SFTS Class
Cari dalam skrip untuk "10元纸币+市场行情"


10-2 Year Treasury Yield Spread by zdmreLong-term bond yield reflects inflation. Short-term bond yields are tools used to predict Fed's interest rate policy. Spread between the two represents four cycles of an economy.
1. Growth
Short-term yield rises as interest rates rise. Spread narrows.
2. Slow growth
Central bank raises interest rates faster and short-term yield exceeds long-term yield. Spread turns negative.
3. Recession
High interest rates lead to more defaults. Inflation caps consumption. Central bank lowers interest rate to stimulate the economy and short-term yield falls. Spread widens.
4. Recovery
Central bank continues easing. Spread remains wide and yield curve remains steep.
0 = Recession Risk
2.6 = Recovery Plan
DYOR


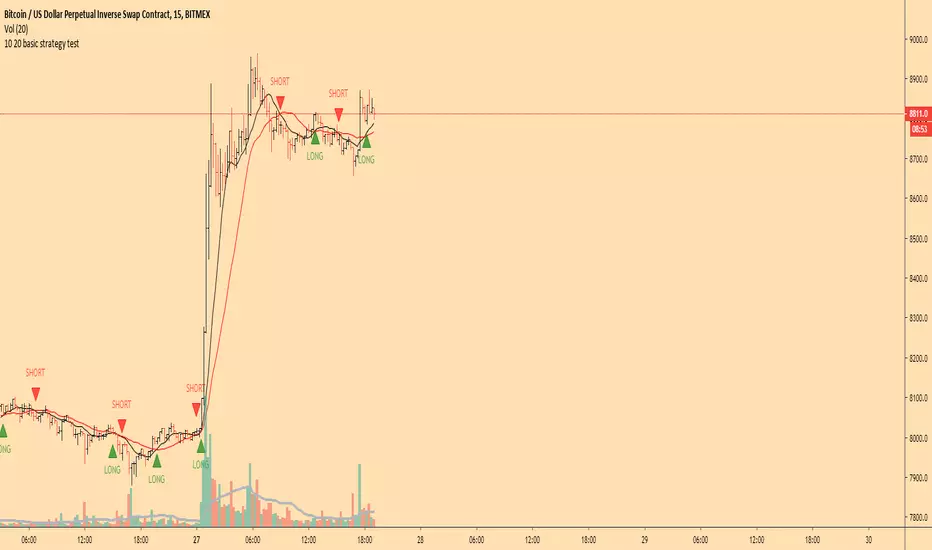
6 Figures Scalping 2x MACD10-11-2019
This script plots a double MACD in a new indicator pane
The default settings:
Pink = STD MACD , settings 12-26-9
Green - Fast MACD, settings 5-15-1
The MACD settings can be changed in the indicators setting window

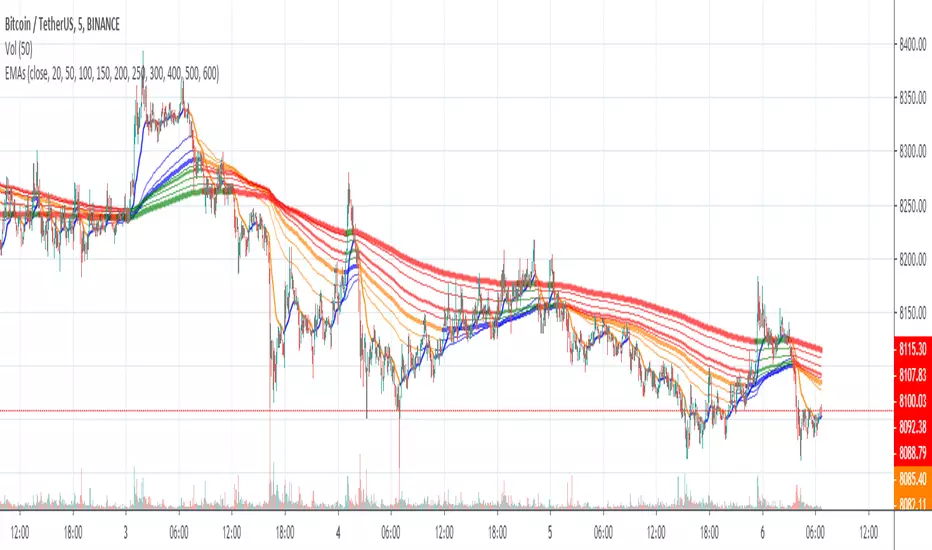
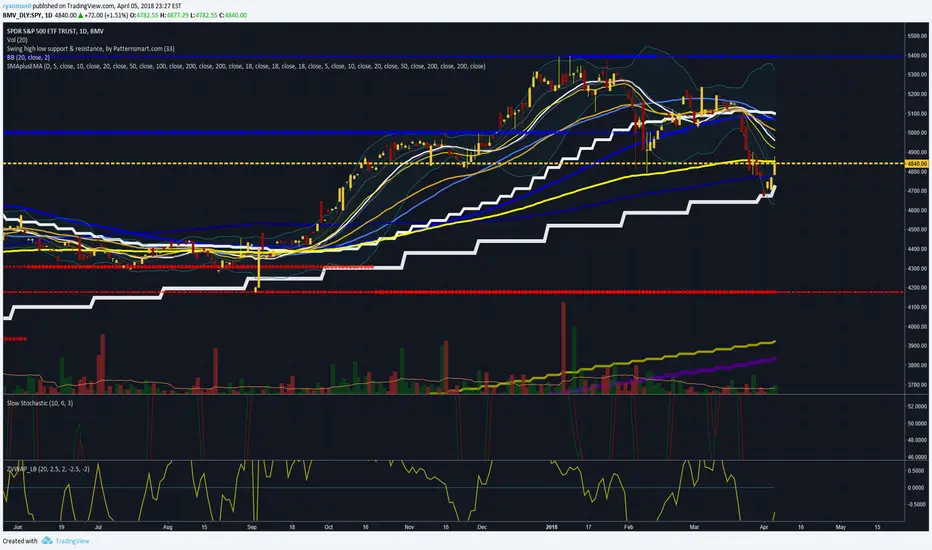
10/20/50/100/200 SMA'sMultiple MA's to get a good feel for momentum and interim supports and resistances


Moving Average x10 (SMA, EMA)10 configurable Simple and Exponential moving averages combined in one indicator

SMA RIBBON10 SMA's arranged in a ribbon. Color coded depending on price close. Free to use, open source. As seen in some charts.


10Y Bond Yield Spread (beta)10-Year Bond Yield Spread using Quandl data
See also:
- seekingalpha.com
- www.babypips.com
- www.forexfactory.com

10 Simple & 6 Exponential Moving Averages (w/ 18 day,week,month)* This is for the trader who wants tons of moving averages on their chart from one indicator
* Using the options, you should be able ot turn off some of them if the screen is too noisy for you
* You should also be able to change colors and thickness of the bars
* The thicker bars are for longer term averages
* This version is similar to my other script except it adds the 18 day, 18 week, and 18 Month SMa
* I added them after watching ira Epstein's YouTube videos
* Let me know if there are any bugs or things that need to be change

Double Top/Bottom Screener - Today Only v3 //@version=6
indicator("Double Top/Bottom Screener - Today Only", overlay=true, max_lines_count=500)
// Inputs
leftBars = input.int(5, "Left Bars")
rightBars = input.int(5, "Right Bars")
tolerance = input.float(0.02, "Max Difference (e.g., 0.02 for 2 cents)", step=0.01)
atrLength = input.int(14, "ATR Length for Normalized Distance", minval=1)
requiredPeaks = input.int(3, "Required Identical Peaks", minval=2, maxval=5)
// Declarations of persistent variables and arrays
var array resistanceLevels = array.new(0)
var array resistanceCounts = array.new(0)
var array supportLevels = array.new(0)
var array supportCounts = array.new(0)
var array resLines = array.new(0)
var array supLines = array.new(0)
var bool hasDoubleTop = false
var bool hasDoubleBottom = false
var float doubleTopLevel = na
var float doubleBottomLevel = na
var int todayStart = na
var float nearestDoubleLevel = na // Explicitly declared as na by default
// Step 1: Identify Swing Highs/Lows
swingHigh = ta.pivothigh(high, leftBars, rightBars)
swingLow = ta.pivotlow(low, leftBars, rightBars)
// Today's premarket start (04:00 AM ET)
todayStart := timestamp(syminfo.timezone, year, month, dayofmonth, 4, 0, 0)
// Clear arrays and delete lines on the first bar or new day
if barstate.isfirst or (dayofmonth != dayofmonth and time >= todayStart)
// Delete all existing lines only if arrays are not empty
if array.size(resLines) > 0
for i = array.size(resLines) - 1 to 0
line.delete(array.get(resLines, i))
if array.size(supLines) > 0
for i = array.size(supLines) - 1 to 0
line.delete(array.get(supLines, i))
// Clear arrays
array.clear(resistanceLevels)
array.clear(supportLevels)
array.clear(resistanceCounts)
array.clear(supportCounts)
array.clear(resLines)
array.clear(supLines)
// Reset flags and levels
hasDoubleTop := false
hasDoubleBottom := false
doubleTopLevel := na
doubleBottomLevel := na
nearestDoubleLevel := na // Ensure reset on new day
// Add new swings only if today and after premarket
if not na(swingHigh) and time >= todayStart and dayofmonth == dayofmonth
bool isEqualHigh = false
int peakIndex = -1
float prevLevel = na
if array.size(resistanceLevels) > 0
for i = 0 to array.size(resistanceLevels) - 1
prevLevel := array.get(resistanceLevels, i)
if math.abs(swingHigh - prevLevel) <= tolerance
isEqualHigh := true
peakIndex := i
break
if isEqualHigh and peakIndex >= 0
array.set(resistanceCounts, peakIndex, array.get(resistanceCounts, peakIndex) + 1)
if array.get(resistanceCounts, peakIndex) == requiredPeaks
hasDoubleTop := true
doubleTopLevel := prevLevel
else
array.push(resistanceLevels, swingHigh)
array.push(resistanceCounts, 1)
line newResLine = line.new(bar_index - rightBars, swingHigh, bar_index, swingHigh, color=color.red, width=2, extend=extend.none)
array.push(resLines, newResLine)
if not na(swingLow) and time >= todayStart and dayofmonth == dayofmonth
bool isEqualLow = false
int peakIndex = -1
float prevLevel = na
if array.size(supportLevels) > 0
for i = 0 to array.size(supportLevels) - 1
prevLevel := array.get(supportLevels, i)
if math.abs(swingLow - prevLevel) <= tolerance
isEqualLow := true
peakIndex := i
break
if isEqualLow and peakIndex >= 0
array.set(supportCounts, peakIndex, array.get(supportCounts, peakIndex) + 1)
if array.get(supportCounts, peakIndex) == requiredPeaks
hasDoubleBottom := true
doubleBottomLevel := prevLevel
else
array.push(supportLevels, swingLow)
array.push(supportCounts, 1)
line newSupLine = line.new(bar_index - rightBars, swingLow, bar_index, swingLow, color=color.green, width=2, extend=extend.none)
array.push(supLines, newSupLine)
// Monitor and remove broken levels/lines; reset pattern if the equal level breaks
if array.size(resistanceLevels) > 0
for i = array.size(resistanceLevels) - 1 to 0
float level = array.get(resistanceLevels, i)
if close > level
line.delete(array.get(resLines, i))
array.remove(resLines, i)
array.remove(resistanceLevels, i)
array.remove(resistanceCounts, i)
if level == doubleTopLevel
hasDoubleTop := false
doubleTopLevel := na
nearestDoubleLevel := na // Reset if level breaks
if array.size(supportLevels) > 0
for i = array.size(supportLevels) - 1 to 0
float level = array.get(supportLevels, i)
if close < level
line.delete(array.get(supLines, i))
array.remove(supLines, i)
array.remove(supportLevels, i)
array.remove(supportCounts, i)
if level == doubleBottomLevel
hasDoubleBottom := false
doubleBottomLevel := na
nearestDoubleLevel := na // Reset if level breaks
// Limit arrays (after removals)
if array.size(resistanceLevels) > 10
line oldLine = array.shift(resLines)
line.delete(oldLine)
array.shift(resistanceLevels)
array.shift(resistanceCounts)
if array.size(supportLevels) > 10
line oldLine = array.shift(supLines)
line.delete(oldLine)
array.shift(supportLevels)
array.shift(supportCounts)
// Pattern Signal: 1 only if the exact required number of peaks is met
patternSignal = (hasDoubleTop or hasDoubleBottom) ? 1 : 0
// New: Nearest Double Level Price - Only update if pattern is active today
if time >= todayStart and dayofmonth == dayofmonth // Restrict to today
if (hasDoubleTop and not na(doubleTopLevel)) or (hasDoubleBottom and not na(doubleBottomLevel))
if hasDoubleTop and not na(doubleTopLevel)
nearestDoubleLevel := doubleTopLevel
if hasDoubleBottom and not na(doubleBottomLevel)
nearestDoubleLevel := na(nearestDoubleLevel) ? doubleBottomLevel : (math.abs(close - doubleBottomLevel) < math.abs(close - nearestDoubleLevel) ? doubleBottomLevel : nearestDoubleLevel)
else
nearestDoubleLevel := na // Reset to na if no pattern today
else
nearestDoubleLevel := na // Reset for historical bars
// New: Distance to Nearest Level (using ATR for normalization)
var float atr = ta.atr(atrLength)
var float distanceNormalizedATR = na
if not na(nearestDoubleLevel) and not na(atr) and atr > 0
distanceNormalizedATR := math.abs(close - nearestDoubleLevel) / atr
// Outputs
plot(patternSignal, title="Pattern Signal", color=patternSignal == 1 ? color.purple : na, style=plot.style_circles)
plot(nearestDoubleLevel, title="Nearest Double Level Price", color=color.orange)
plot(distanceNormalizedATR, title="Normalized Distance (ATR)", color=color.green)
bgcolor(patternSignal == 1 ? color.new(color.purple, 80) : na)
if patternSignal == 1 and barstate.isconfirmed
alert("Double Pattern detected on " + syminfo.ticker + " at " + str.tostring(close), alert.freq_once_per_bar_close)
if barstate.islast
var table infoTable = table.new(position.top_right, 1, 3, bgcolor=color.new(color.black, 50))
table.cell(infoTable, 0, 0, "Pattern: " + str.tostring(patternSignal), bgcolor=patternSignal == 1 ? color.purple : color.gray)
table.cell(infoTable, 0, 1, "Level: " + str.tostring(nearestDoubleLevel, "#.##"), bgcolor=color.orange)
table.cell(infoTable, 0, 2, "ATR Dist: " + str.tostring(distanceNormalizedATR, "#.##"), bgcolor=color.green)

RSI Signals Multi-Layer RSI System with Classical Divergence**DrFX RSI Signals Fixed** is an advanced RSI-based trading system that combines duration-filtered extreme conditions with classical divergence detection and momentum confirmation. This enhanced version addresses common RSI false signals through multi-layer filtering while adding proper divergence analysis for identifying high-probability reversal points.
**Core Innovation & Originality**
This indicator uniquely integrates five analytical layers:
1. **Duration-Validated Extreme Zones** - Confirms RSI has remained overbought/oversold for minimum bars within lookback period
2. **Classical Divergence Detection** - Proper implementation comparing swing highs/lows in both price and RSI
3. **Momentum Confirmation Signals** - RSI crossing 50-line after extreme conditions for trend confirmation
4. **Multi-Signal Classification** - Four distinct signal types (Buy, Sell, Strong Buy, Strong Sell, Momentum)
5. **Visual Zone Highlighting** - Background coloring for instant extreme zone identification
**Technical Implementation & Improvements**
**Enhanced Duration Filter:**
Unlike the previous version, this system uses a refined approach:
```
for i = 0 to lookback_bars - 1
if rsi > overbought
barsInOverbought := barsInOverbought + 1
```
This counts actual bars within the lookback period (default 20 bars) where RSI was extreme, requiring minimum duration (default 4 bars) for signal validation.
**Classical Divergence Detection:**
The system implements proper divergence analysis, a significant improvement over simple delta comparison:
**Bullish Divergence Logic:**
- Price makes lower low: `low < prevPriceLow`
- RSI makes higher low: `rsi > prevRsiLow`
- Indicates weakening downward momentum despite lower prices
**Bearish Divergence Logic:**
- Price makes higher high: `high > prevPriceHigh`
- RSI makes lower high: `rsi < prevRsiHigh`
- Indicates weakening upward momentum despite higher prices
**Signal Generation Framework:**
**Primary Signals:**
- **Buy Signal**: RSI crosses above oversold (30) after meeting duration requirements
- **Sell Signal**: RSI crosses below overbought (70) after meeting duration requirements
**Strong Signals:**
- **Strong Buy**: Buy signal + bullish divergence confirmation
- **Strong Sell**: Sell signal + bearish divergence confirmation
**Momentum Signals:**
- **Momentum Buy (M+)**: RSI crosses above 50 after recent oversold conditions
- **Momentum Sell (M-)**: RSI crosses below 50 after recent overbought conditions
**What Makes This Version Superior**
**Compared to Standard RSI:**
1. **Duration Requirement**: Prevents signals on brief RSI spikes
2. **Lookback Validation**: Ensures extreme conditions actually occurred recently
3. **Proper Divergence**: Uses swing high/low comparison, not just bar-to-bar deltas
4. **Momentum Layer**: Adds trend confirmation via 50-line crosses
**Compared to Previous Version:**
1. **Pine Script v5**: Modern syntax with improved performance
2. **Configurable Parameters**: All values adjustable via inputs
3. **Better Divergence**: Classical divergence logic replaces simplified delta method
4. **Additional Signals**: Momentum confirmations for trend following
5. **Visual Enhancements**: Background coloring and improved signal differentiation
6. **Alert System**: Built-in alert conditions for all signal types
**Parameter Configuration**
**Customizable Inputs:**
- **Overbought Level** (70): Upper threshold, range 50-90
- **Oversold Level** (30): Lower threshold, range 10-50
- **RSI Period** (14): Calculation period, range 2-50
- **Minimum Duration** (4): Required bars in extreme zone, range 1-20
- **Lookback Bars** (20): Period to check for extreme conditions, range 5-100
- **Divergence Lookback** (5): Period for divergence swing comparison, range 2-20
**Optimization Guidelines:**
- **Shorter Duration** (2-3): More frequent signals, higher noise
- **Longer Duration** (5-7): Fewer signals, better quality
- **Smaller Lookback** (10-15): Faster response, may miss context
- **Larger Lookback** (30-50): More context, potentially delayed signals
**Signal Interpretation Guide**
**Visual Signal Hierarchy:**
**Light Green Triangle (Buy):**
- RSI recovered from oversold
- Duration requirements met
- Entry on reversal from oversold territory
**Light Red Triangle (Sell):**
- RSI declined from overbought
- Duration requirements met
- Entry on reversal from overbought territory
**Blue Triangle (Strong Buy):**
- Buy signal with bullish divergence
- Highest probability long setup
- Price made lower low, RSI made higher low
**Magenta Triangle (Strong Sell):**
- Sell signal with bearish divergence
- Highest probability short setup
- Price made higher high, RSI made lower high
**Tiny Green Circle (M+):**
- RSI crossed above 50 after oversold
- Momentum confirmation for uptrend
- Secondary entry or trend confirmation
**Tiny Red Circle (M-):**
- RSI crossed below 50 after overbought
- Momentum confirmation for downtrend
- Secondary entry or trend confirmation
**Background Coloring:**
- **Light Red Background**: RSI > 70 (overbought zone)
- **Light Green Background**: RSI < 30 (oversold zone)
**Trading Strategy Application**
**Conservative Approach (Strong Signals Only):**
1. Wait for blue/magenta triangles (divergence confirmed)
2. Enter on signal bar close or next bar open
3. Stop loss beyond recent swing high/low
4. Target minimum 2:1 risk/reward ratio
**Aggressive Approach (All Signals):**
1. Take light green/red triangles for earlier entries
2. Use momentum circles as confirmation
3. Tighter stops with partial profit taking
4. Scale positions based on signal strength
**Momentum Trading:**
1. Use momentum signals (M+/M-) as trend filters
2. Take primary signals aligned with momentum direction
3. Avoid counter-momentum signals in strong trends
4. Exit when opposing momentum signal appears
**Multi-Timeframe Strategy:**
1. Check higher timeframe for strong signals
2. Execute on lower timeframe primary signals
3. Use momentum signals for position management
4. Align all timeframe signals for best probability
**Optimal Market Conditions**
**Best Performance:**
- Mean-reverting markets with clear RSI extremes
- Range-bound or consolidating conditions
- Markets respecting support/resistance levels
- Timeframes: 15min to 4H for active trading
**Strong Signal Advantages:**
- Divergence signals often mark major turning points
- Work well at market structure levels
- Effective in both trending and ranging markets
- Higher success rate justifies waiting for setup
**Momentum Signal Benefits:**
- Confirms trend direction after extreme readings
- Useful for adding to positions
- Helps avoid counter-trend trades
- Works well in trending markets where reversals fail
**Technical Advantages**
**Divergence Accuracy:**
The improved divergence detection uses proper swing analysis rather than simple bar-to-bar comparison. This identifies genuine momentum shifts where price action diverges from oscillator movement over a meaningful period.
**Duration Logic:**
The for-loop counting method ensures the system checks actual RSI values within the lookback period, not just whether RSI touched levels. This distinguishes between sustained conditions and brief spikes.
**Momentum Filter:**
The 50-line crosses after extreme conditions provide an additional confirmation layer, helping traders distinguish between failed reversals (no momentum follow-through) and sustained moves (momentum confirmation).
**Risk Management Integration**
**Signal Priority:**
1. **Highest**: Strong signals with divergence (blue/magenta triangles)
2. **Medium**: Primary signals without divergence (light green/red triangles)
3. **Confirmation**: Momentum signals (tiny circles)
**Position Sizing:**
- Larger positions on strong signals (divergence present)
- Standard positions on primary signals
- Smaller positions or adds on momentum signals
**Stop Placement:**
- Beyond recent swing structure
- Below/above divergence swing low/high for strong signals
- Trail stops when momentum signals align with position
**Alert System**
Built-in alert conditions for:
- Buy Signal: RSI buy without divergence
- Sell Signal: RSI sell without divergence
- Strong Buy Alert: Buy with bullish divergence
- Strong Sell Alert: Sell with bearish divergence
Configure alerts via TradingView's alert system to receive notifications for chosen signal types.
**Important Considerations**
**Strengths:**
- Multiple confirmation layers reduce false signals
- Classical divergence improves reversal detection
- Momentum signals add trend-following capability
- Highly customizable for different trading styles
- No repainting - all signals fixed at bar close
**Limitations:**
- Duration requirements may cause missed quick reversals
- Divergence lookback period affects sensitivity
- Not suitable as standalone system
- Requires understanding of RSI principles and divergence concepts
**Best Practices:**
- Combine with price action and support/resistance
- Use higher timeframe context for directional bias
- Respect overall market trend and structure
- Implement proper position sizing based on signal type
- Test parameters on your specific instrument and timeframe
**Comparison Summary**
This enhanced version represents a significant upgrade:
- Upgraded to Pine Script v5 modern standards
- Proper classical divergence detection (not simplified)
- Added momentum confirmation signals
- Fully customizable parameters via inputs
- Visual background zone highlighting
- Comprehensive alert system
- Better signal differentiation through color coding
The system transforms basic RSI analysis into a multi-dimensional trading tool suitable for various market conditions and trading styles.
**Disclaimer**: This indicator is designed for educational and analytical purposes. While the multi-layer filtering and classical divergence detection improve upon standard RSI implementations, no indicator guarantees profitable trades. The duration filtering reduces false signals but may delay entries. Divergence signals, while statistically favorable, can fail in strong trending conditions. Always use proper risk management, position sizing, and stop-loss orders. Consider multiple confirmation methods and market context before making trading decisions. Past performance does not guarantee future results.

Double Top/Bottom Screener - Today Only v2 //@version=6
indicator("Double Top/Bottom Screener - Today Only", overlay=true, max_lines_count=500)
// Inputs
leftBars = input.int(5, "Left Bars")
rightBars = input.int(5, "Right Bars")
tolerance = input.float(0.02, "Max Difference (e.g., 0.02 for 2 cents)", step=0.01)
atrLength = input.int(14, "ATR Length for Normalized Distance", minval=1)
requiredPeaks = input.int(3, "Required Identical Peaks", minval=2, maxval=5)
// Declarations of persistent variables and arrays
var array resistanceLevels = array.new(0)
var array resistanceCounts = array.new(0)
var array supportLevels = array.new(0)
var array supportCounts = array.new(0)
var array resLines = array.new(0)
var array supLines = array.new(0)
var bool hasDoubleTop = false
var bool hasDoubleBottom = false
var float doubleTopLevel = na
var float doubleBottomLevel = na
var int todayStart = na
// Step 1: Identify Swing Highs/Lows
swingHigh = ta.pivothigh(high, leftBars, rightBars)
swingLow = ta.pivotlow(low, leftBars, rightBars)
// Today's premarket start (04:00 AM ET)
todayStart := timestamp(syminfo.timezone, year, month, dayofmonth, 4, 0, 0)
// Clear arrays and delete lines on the first bar or new day
if barstate.isfirst or (dayofmonth != dayofmonth and time >= todayStart)
// Delete all existing lines only if arrays are not empty
if array.size(resLines) > 0
for i = array.size(resLines) - 1 to 0
line.delete(array.get(resLines, i))
if array.size(supLines) > 0
for i = array.size(supLines) - 1 to 0
line.delete(array.get(supLines, i))
// Clear arrays
array.clear(resistanceLevels)
array.clear(supportLevels)
array.clear(resistanceCounts)
array.clear(supportCounts)
array.clear(resLines)
array.clear(supLines)
// Reset flags
hasDoubleTop := false
hasDoubleBottom := false
doubleTopLevel := na
doubleBottomLevel := na
// Add new swings only if today and after premarket
if not na(swingHigh) and time >= todayStart and dayofmonth == dayofmonth
bool isEqualHigh = false
int peakIndex = -1
float prevLevel = na
if array.size(resistanceLevels) > 0
for i = 0 to array.size(resistanceLevels) - 1
prevLevel := array.get(resistanceLevels, i)
if math.abs(swingHigh - prevLevel) <= tolerance
isEqualHigh := true
peakIndex := i
break
if isEqualHigh and peakIndex >= 0
array.set(resistanceCounts, peakIndex, array.get(resistanceCounts, peakIndex) + 1)
if array.get(resistanceCounts, peakIndex) == requiredPeaks
hasDoubleTop := true
doubleTopLevel := prevLevel
else
array.push(resistanceLevels, swingHigh)
array.push(resistanceCounts, 1)
line newResLine = line.new(bar_index - rightBars, swingHigh, bar_index, swingHigh, color=color.red, width=2, extend=extend.none)
array.push(resLines, newResLine)
if not na(swingLow) and time >= todayStart and dayofmonth == dayofmonth
bool isEqualLow = false
int peakIndex = -1
float prevLevel = na
if array.size(supportLevels) > 0
for i = 0 to array.size(supportLevels) - 1
prevLevel := array.get(supportLevels, i)
if math.abs(swingLow - prevLevel) <= tolerance
isEqualLow := true
peakIndex := i
break
if isEqualLow and peakIndex >= 0
array.set(supportCounts, peakIndex, array.get(supportCounts, peakIndex) + 1)
if array.get(supportCounts, peakIndex) == requiredPeaks
hasDoubleBottom := true
doubleBottomLevel := prevLevel
else
array.push(supportLevels, swingLow)
array.push(supportCounts, 1)
line newSupLine = line.new(bar_index - rightBars, swingLow, bar_index, swingLow, color=color.green, width=2, extend=extend.none)
array.push(supLines, newSupLine)
// Monitor and remove broken levels/lines; reset pattern if the equal level breaks
if array.size(resistanceLevels) > 0
for i = array.size(resistanceLevels) - 1 to 0
float level = array.get(resistanceLevels, i)
if close > level
line.delete(array.get(resLines, i))
array.remove(resLines, i)
array.remove(resistanceLevels, i)
array.remove(resistanceCounts, i)
if level == doubleTopLevel
hasDoubleTop := false
doubleTopLevel := na
if array.size(supportLevels) > 0
for i = array.size(supportLevels) - 1 to 0
float level = array.get(supportLevels, i)
if close < level
line.delete(array.get(supLines, i))
array.remove(supLines, i)
array.remove(supportLevels, i)
array.remove(supportCounts, i)
if level == doubleBottomLevel
hasDoubleBottom := false
doubleBottomLevel := na
// Limit arrays (after removals)
if array.size(resistanceLevels) > 10
line oldLine = array.shift(resLines)
line.delete(oldLine)
array.shift(resistanceLevels)
array.shift(resistanceCounts)
if array.size(supportLevels) > 10
line oldLine = array.shift(supLines)
line.delete(oldLine)
array.shift(supportLevels)
array.shift(supportCounts)
// Pattern Signal: 1 only if the exact required number of peaks is met
patternSignal = (hasDoubleTop or hasDoubleBottom) ? 1 : 0
// New: Nearest Double Level Price
var float nearestDoubleLevel = na
if hasDoubleTop and not na(doubleTopLevel)
nearestDoubleLevel := doubleTopLevel
if hasDoubleBottom and not na(doubleBottomLevel)
nearestDoubleLevel := na(nearestDoubleLevel) ? doubleBottomLevel : (math.abs(close - doubleBottomLevel) < math.abs(close - nearestDoubleLevel) ? doubleBottomLevel : nearestDoubleLevel)
// New: Distance to Nearest Level (using ATR for normalization)
var float atr = ta.atr(atrLength)
var float distanceNormalizedATR = na
if not na(nearestDoubleLevel) and not na(atr) and atr > 0
distanceNormalizedATR := math.abs(close - nearestDoubleLevel) / atr
// Optional Bounce Signal (for reference)
bounceSignal = 0
if array.size(resistanceLevels) > 0
for i = 0 to array.size(resistanceLevels) - 1
float level = array.get(resistanceLevels, i)
if low <= level and high >= level and close < level
bounceSignal := 1
if array.size(supportLevels) > 0
for i = 0 to array.size(supportLevels) - 1
float level = array.get(supportLevels, i)
if high >= level and low <= level and close > level
bounceSignal := 1
// Outputs
plot(patternSignal, title="Pattern Signal", color=patternSignal == 1 ? color.purple : na, style=plot.style_circles)
plot(bounceSignal, title="Bounce Signal", color=bounceSignal == 1 ? color.yellow : na, style=plot.style_circles)
plot(nearestDoubleLevel, title="Nearest Double Level Price", color=color.orange)
plot(distanceNormalizedATR, title="Normalized Distance (ATR)", color=color.green)
bgcolor(patternSignal == 1 ? color.new(color.purple, 80) : na)
if patternSignal == 1 and barstate.isconfirmed
alert("Double Pattern detected on " + syminfo.ticker + " at " + str.tostring(close), alert.freq_once_per_bar_close)
if barstate.islast
var table infoTable = table.new(position.top_right, 1, 4, bgcolor=color.new(color.black, 50))
table.cell(infoTable, 0, 0, "Pattern: " + str.tostring(patternSignal), bgcolor=patternSignal == 1 ? color.purple : color.gray)
table.cell(infoTable, 0, 1, "Bounce: " + str.tostring(bounceSignal), bgcolor=bounceSignal == 1 ? color.yellow : color.gray)
table.cell(infoTable, 0, 2, "Level: " + str.tostring(nearestDoubleLevel, "#.##"), bgcolor=color.orange)
table.cell(infoTable, 0, 3, "ATR Dist: " + str.tostring(distanceNormalizedATR, "#.##"), bgcolor=color.green)
