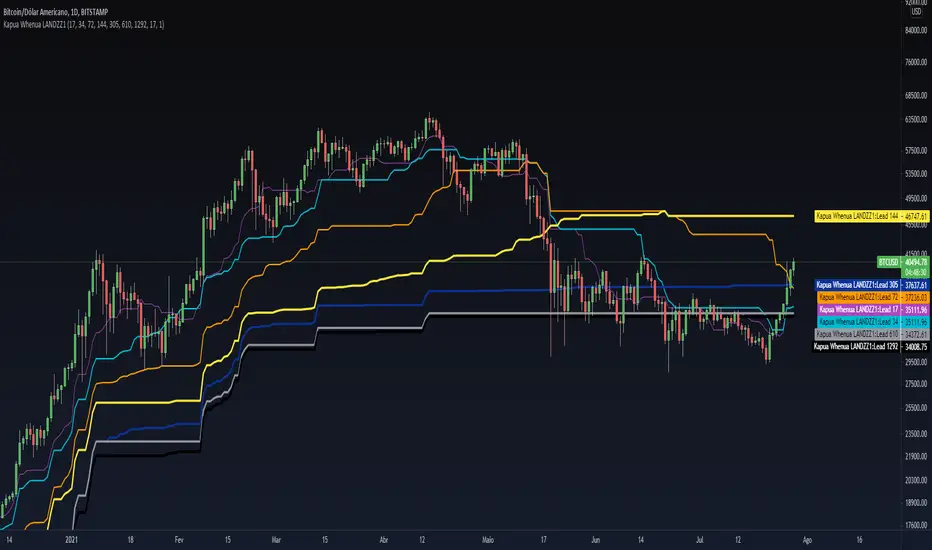
Kapua Whenua LANDZZ1Kapua Whenua means Earth's Clouds in Maori language, this indicator was created to show impulses and trends of the asset's price movement both up and down.
The Indicator was made based on key numbers of the golden ratio:
Conversion Line: Kw 17 (Purple Color)
Kw 34 - Short Period Fractal (Light Blue Color)
Kw 72 - Short/Medium Period Fractal (Orange)
Kw 144 - Medium Period Fractal (Yellow Color)
Kw 305 - Medium/Long Period Fractal (Dark Blue Color)
Kw 610 - Long Period Fractal (Grey)
Kw 1292 - Long Period Fractal+ (Black Color)
The baseline or also called the conversion line is identified by the Color Purple of value 17.
How to read the indicator:
Every time the conversion line (Purple Color 17 periods) crosses a Kw value (Kapua Whenua) it will always look for the next KW line above or below the value as support or resistance.
For example:
If we are in a bull market, and the price crosses below the KW17 conversion line it will go towards KW 34 as support, if the price breaks KW 34 it will go towards the next line below KW 34 as support.
Every time the conversion line or the price crosses a higher value of Kapua Whenua (KW) this trend will be stronger, it means, if the conversion line (KW 17) crosses above KW 305 it will indicate more strength than if it had crossed above the KW 72 or 144 for example. So to get better results trading with the trend, always observe if the conversion line and the price are below or above some Medium/Long Period KW.
Note also that, in an uptrend, it could be that all KW are below each other. In a downtrend, it could be that all KW are on top of each other. This indicates that the farther the price is from the fractals the stronger the trend is, also, when there is a narrowing of the fractals means that the price will start to go sideways. If the price is between 2 or more Fractals, it will indicate consolidation.
A really good trend is considered when the price or the Short/Medium Period Fractals are all above or below at KW 610, which is a long period fractal, meaning a strong uptrend or downtrend.
A larger KW can be at the same point as a smaller KW, however, the stronger color will be shown above the weaker one.
***Larger chart timeframes are better to see longer KW fractals that are above or below the price, if your chart timeframe doesn't show a bigger support or resistance fractal, change the chart time to another longer period**
Tip - Get used to looking at line colors as your indicators, just like moving averages. You can also take or place any fractal at any time in the configuration menu.
Cari dalam skrip untuk "17个交易日涨幅第一的股票(非新股)有哪些"
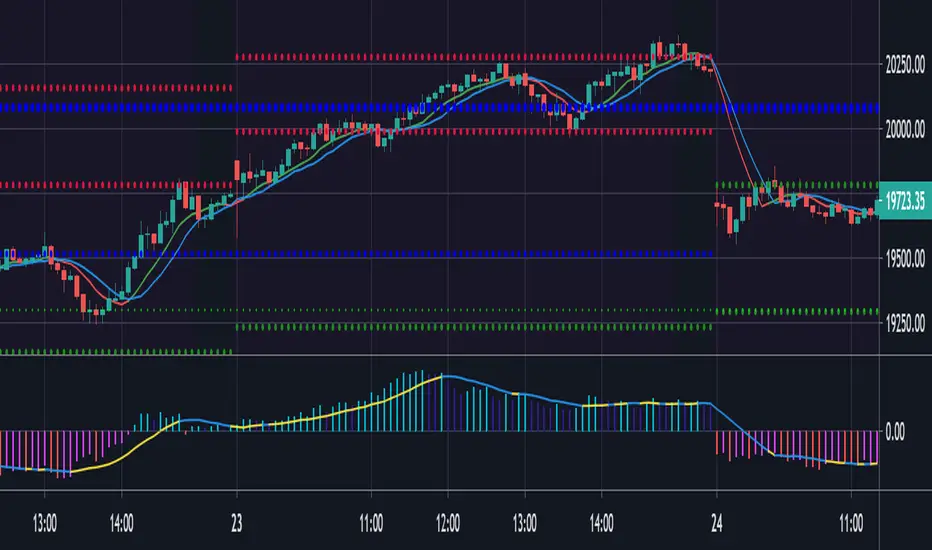
[DS]Entry_Exit_TRADE.V01-StrategyThe proposal of this script is to show the possible trading points of BUY and SELL based on the 15-minute chart of the Nasdaq Future Index. The start point of the strategy was schedule for 2021/01/01 and until the time of this publication (2021/01/31), for 1 index contract the results presented area a Gross Profit of 2.97% with a Net Profit of 1.35%.
█ FEATURES
The indicator shows on the graph the position of the MACD and TSI indicators that are the places of strength among Buyers and Sellers.
It's possible to observe a sharp fall or rise in the price of these positions.
On the current candle, a label is displayed containing the value of the William %R Mod indicator, which will display the OverBought position (dark red) and OverSold position (dark green). The other colors like light red and green are the regions where the price makes the decision of which direction to go.
There are also other indicators:
a) The positions of the BUY (light green) and SELL areas (light red);
b) The label with the position of BUY (dark green) and SELL (dark red) with the line that connects these points;
c) DEMA 72 (orange);
d) EmaOchl4 in the color green for BULL and red for BEAR market;
e) Pivots high and low
f) Maximum (purple light) and minimum areas (blue light)
█ FUNCTIONS AND SETTINGS
The indicator uses the following functions:
(1) DEMA - Double Exponential Moving Average (08,17,34, 72)
(2) ema () - Exponential Moving Averge (72, ohlc4)
(3) plot()
(4) barcolor()
(5) cross()
(6) pivots ()
(7) William R% Md (OverBought = -7, OverSold=-93)
(8) Maximum and Minimum Value
(9) fill()
(10) macd () - Moving Average Convergence Divergence (Fast Lengt=12, Slow Length=26, Source=close, Signal Smoothing=9)
(11) tsi() - Trading Strenght Indicator==> Índice de Força Real ( IFR ) (Long Length=72, Short Length=17, Signal Length=17)
(12) Buy and Sell TRADE Points
█ PERFORMANCE AND ERRORS
The positions of BUY and SELL points are defined through the crossing of the Dema 34 candles with the Ema Ohcl4. As it is an indicator, it can present different positions from de market direction. Thus there is a need to observe the direction of the market in order to verify whether the indicate decision is really acceptable. The decision to BUY or SELL an asset must be well studied to avoid financial losses. The indicator will only help you in this decision, is your responsibility the decision of entering or leaving an asset.
█ THANKS TO
PineCoders for all they do, all the tools and help they provide, and their involvement in making a better community. All the PineCoders, Pine Pros, and Pine Wizards, people who share their work and knowledge for the sake of it and helping others, I'm very happy and grate full indeed.
█ NOTE
If you have any suggestions for improving the script or need help using it, please send a message in the comments

The Lazy Trader - Index (ETF) Trend Following Robot50/150 moving average, index (ETF) trend following robot. Coded for people who cannot psychologically handle dollar-cost-averaging through bear markets and extreme drawdowns (although DCA can produce better results eventually), this robot helps you to avoid bear markets. Be a fair-weathered friend of Mr Market, and only take up his offer when the sun is shining! Designed for the lazy trader who really doesn't care...
Recommended Chart Settings:
Asset Class: ETF
Time Frame: Daily
Necessary ETF Macro Conditions:
a) Country must have healthy demographics, good ratio of young > old
b) Country population must be increasing
c) Country must be experiencing price-inflation
Default Robot Settings:
Slow Moving Average: 50 (integer) //adjust to suit your underlying index
Fast Moving Average: 150 (integer) //adjust to suit your underlying index
Bullish Slope Angle: 5 (degrees) //up angle of moving averages
Bearish Slope Angle: -5 (degrees) //down angle of moving averages
Average True Range: 14 (integer) //input for slope-angle formula
Risk: 100 (%) //100% risk means using all equity per trade
ETF Test Results (Default Settings):
SPY (1993 to 2020, 27 years), 332% profit, 20 trades, 6.4 profit factor, 7% drawdown
EWG (1996 to 2020, 24 years), 310% profit, 18 trades, 3.7 profit factor, 10% drawdown
EWH (1996 to 2020, 24 years), 4% loss, 26 trades, 0.9 profit factor, 36% drawdown
QQQ (1999 to 2020, 21 years), 232% profit, 17 trades, 3.6 profit factor, 2% drawdown
EEM (2003 to 2020, 17 years), 73% profit, 17 trades, 1.1 profit factor, 3% drawdown
GXC (2007 to 2020, 13 years), 18% profit, 14 trades, 1.3 profit factor, 26% drawdown
BKF (2009 to 2020, 11 years), 11% profit, 13 trades, 1.2 profit factor, 33% drawdown
A longer time in the markets is better, with the exception of EWH. 6 out of 7 tested ETFs were profitable, feel free to test on your favourite ETF (default settings) and comment below.
Risk Warning:
Not tested on commodities nor other financial products like currencies (code will not work), feel free to leave comments below.
Moving Average Slope Angle Formula:
Reproduced and modified from source:

Relative Strength Market PickerModified to code from @modhelius and added colors and histogram for easy reading...thanks to him...
What is Relative Strength?
Relative strength is a ratio of a stock price performance to a market average (index) performance. It is used in technical analysis.
It is not to be confused with relative strength index.
To calculate the relative strength of a particular stock, divide the percentage change over some time period by the percentage change of a particular index over the same time period.
How to read this indicator for trading and decesion making?
There are four colors
Aqua: Shows the bullish momentum against the index of your choosing
Navy blue: Show the bearish momentum is weakning at the time period
Fuschsia : Shows the bullish gaining strength and about to cross zero line
Red: Shows the bearish momentum is strong.
Other indicators to be used along with this are
1. Pivot points
2. Moving Average of highs and lows -- 17 period
To take long calls --- There has to be high closing candle above the 17 period moving average of highs and there has to be bullish momentum and ideally with the pivot point as a support
To take short calls -- There has to low closing candle below the 17 period moving average of lows and there has to be bearish momentum and ideally with the pivot point as a resistance.
ICT GMMA VegasHigh-Level Summary
This indicator blends:
ICT concepts (Market Structure Shift, Break of Structure, Order Blocks, Liquidity Pools, Fair Value Gaps, Killzones, etc.).
GMMA (Guppy Multiple Moving Averages) to visualize short, medium, and long trend strength.
Vegas Tunnels (EMA channels 144/169 and 576/676, plus optional 288/388 mid-tunnels).
Vegas Touch entry module with candlestick patterns (Pin Bar 40%, Engulfing 60%).
Extra slope EMAs (EMA60 & EMA200 with color change by slope).
It not only shows the structure (OB, Liquidity, FVGs) but also plots entry arrows and alerts when Vegas Touch + GMMA align.
⚙️ Script Components
1. GMMA Visualization
Short-term EMAs (3–15, green).
Medium-term EMAs (30–60, red).
Long-term EMAs (100–250, blue).
Used to measure crowd sentiment: short EMAs = traders, long EMAs = investors.
The script counts how many EMAs the close is above/below:
If close above ≥17 → possible buy trend.
If close below ≥17 → possible sell trend.
Plots arrows for buy/sell flips.
2. Vegas Tunnels
Short-term tunnel → EMA144 & EMA169.
Long-term tunnel → EMA576 & EMA676.
Mid-tunnels → EMA288 & EMA388.
Plotted as orange/fuchsia/magenta bands.
Conditions:
Breakout checks → if close crosses above/below these EMAs compared to prior bar.
3. ICT Toolkit
Market Structure Shift (MSS) & BOS (Break of Structure): labels & dotted lines when price shifts trend.
Liquidity zones (Buy/Sell): boxes drawn around swing highs/lows with clustering.
Fair Value Gaps (FVG/IFVG): automatic box drawing, showing break status.
Order Blocks (OB): bullish/bearish blocks, breaker OB recognition.
Killzones: highlights NY open, London open/close, Asia session with background shading.
Displacement: plots arrows on large impulse candles.
NWOG/NDOG: Weekly/Monday Open Gaps.
Basically, this section gives a full ICT price action map on the chart.
4. Vegas Touch Entry Module (Pin40/Eng60 + EMA12 switch)
This is the custom entry system you added:
Logic:
If EMA12 > EMA169, use Tunnel (144/169) as reference.
If EMA12 ≤ EMA169, use Base (576/676).
Hard lock: no longs if EMA12 < EMA676; no shorts if EMA12 > EMA676.
Touch condition:
Long → price touches lower band (Tunnel/Base).
Short → price touches upper band (Tunnel/Base).
With ATR/Percent tolerance.
Trend filter:
Must also align with long-term Vegas direction (144/169 vs 576/676 cross).
Close must be on the outer side of the band.
Candlestick filter:
Pin Bar (≥40% wick) or
Engulfing (≥60% bigger body than previous).
Cooldown: avoids multiple signals in short succession.
Plots:
Green triangle below = Long entry.
Red triangle above = Short entry.
Alerts: triggers once per bar close with full message.
5. Slope EMAs (Extra)
EMA60 and EMA200 plotted as thick lines.
Color:
Green if sloping upward (current > value 2 bars ago).
Red if sloping downward.
📡 Outputs & Alerts
Arrows for GMMA trend flips.
Arrows for Vegas Touch entries.
Labels for MSS, BOS, FVGs, OBs.
Liquidity/FVG/OB boxes.
Background shading for killzones.
Alerts:
“📡 Entry Alert (Long/Short)” for GMMA.
“VT LONG/SHORT” for Vegas Touch.
📝 Key Idea
This is not just one system, but a multi-layered confluence tool:
ICT structure & liquidity context.
GMMA trend recognition.
Vegas Tunnel directional bias.
Candlestick-based confirmation (Pin/Engulf).
Alert automation for live trading.
👉 It’s essentially a trader’s dashboard: structural map + moving averages + entry signals all in one.

Justin's Bitcoin Power Law PredictorJustin's MSTR Powerlaw Price Predictor is a Pine Script v6 indicator for TradingView that adapts Giovanni Santostasi’s Bitcoin power law model to forecast MicroStrategy (MSTR) stock prices. Using the formula Price = A * (daysSinceGenesis)^B, it calculates fair, upper, and floor prices with constants A_fair = 1.16e-17, A_floor = 0.42e-17, and B = 5.82, starting from Bitcoin’s genesis (January 3, 2009). The script plots these prices, displays values in a table.
Source: www.ccn.com

Advanced RSI — Mark 4 RSI was introduced by J. Welles Wilder Jr. in 1978 in New Concepts in Technical Trading Systems. It measures the velocity of gains vs. losses on a bounded 0–100 scale and popularized the 14-period lookback with 70/30 guide rails for overbought/oversold. Over time, traders added variations (different lengths, thresholds, smoothing, adaptive levels), but the core idea stayed the same: momentum turns often precede price turns.
and i initially started to make minor adjustments for personal use like changing the default to 17 , and using Tradingviews official RSI which comes with a MA embedded. but it was not enough. especially the visuals.
so, for this public release Mark 4 i enhanced RSI by incorporating :
1. Dual-Length Fusion
Two RSI periods (default 17 + 21) blended then lightly smoothed (TEMA by default) → steadier
line without dulling turns.
2. Adaptive OB/OS (ATR-aware) for fewer whipsaws.
3. OB/OS alt solution:
Brief yellow segments appear only at local extremes (default: >72 tops, <32 bottoms) to
emphasize exhaustion without repainting the whole line.
4. Signals you can actually see
Triangle markers for:
Bullish: RSI crossing up through adaptive OS (and still <40 at the cross).
Bearish: RSI crossing down through adaptive OB (and still >60 at the cross).
“Strong Bull/Bear” background nudges appear when momentum is pushing beyond the
bands.
Optional Divergence Tags
and
Tiny diamonds to flag potential bullish/bearish divergences (look-back based).
Info Table (can be hidden)
my Fav feature i included 5 colorways with modern themes.(pls check under INPUTS)
and i made all that to make the indicator visualization look awesome on high end displays.
Credits & acknowledgment
Inspired by the original RSI by J. Welles Wilder Jr. (1978).
Built to be modern, focused, and comfortable for long sessions—especially on dark/OLED displays.
THIS INDICATOR IS MORE THAN ENOUGH BUT I DO HAVE PRIVATE INDICATORS WITH DIFFERENT LOGIC FUNCTIONS.
I'm open for feedback/collaboration.
drsamc.

Sessions [Plug&Play]This indicator automatically highlights the three major FX trading sessions—Asia, London, and New York—on your chart and, at the close of each session, draws right-extended horizontal rays at that session’s high and low. It’s designed to help you visually identify when price is trading within each session’s range and to quickly see where the highest and lowest prices occurred before the next major session begins.
Key Features:
Session Boxes
Draws a semi-transparent box around each session’s timeframe (Asia, London, New York) based on your local UTC offset.
Each box dynamically expands in real time: as new candles form during the session, the box’s top and bottom edges update to match the highest high and lowest low seen so far in that session.
When the session ends, the box remains on your chart, anchored to the exact candles that formed its boundaries.
High/Low Rays
As soon as a session closes (e.g., London session ends at 17:00 UTC+0 by default), two horizontal rays are drawn at that session’s final high and low.
These rays are “pinned” to the exact candles where the high/low occurred, so they stay in place when you scroll or zoom.
Each ray extends indefinitely to the right, providing a clear reference of the key supply/demand levels created during that session.
Session Labels
Optionally places a small “London,” “New York,” or “Asia” label at the top edge of each completed session’s box.
Labels are horizontally centered within the session’s box and use a contrasting, easy-to-read font color.
Customizable Appearance
Show/Hide Each Session: Toggle display of London, New York, and Asia sessions separately.
Time Ranges: By default, London is 08:00–17:00 (UTC), New York is 13:00–22:00 (UTC), and Asia is 00:00–07:00 (UTC). You can override each session’s start/end times using the “Time Range” picker.
Color & Opacity: Assign custom colors to each session. Choose a global “Dark,” “Medium,” or “Light” opacity preset to adjust box fill transparency and border shading.
Show/Hide Labels & Outlines: Turn the text labels and the box borders on or off independently.
UTC Offset Support
If your local broker feed or price data is not in UTC, simply adjust the “UTC Offset (+/–)” input. The indicator will recalculate session start/end times relative to your chosen offset.
How to Use:
Add the Indicator:
Open TradingView’s Pine Editor, paste in this script, and click “Add to Chart.”
By default, you’ll see three translucent boxes appear once each session begins (Asia, London, New York).
Watch in Real Time:
As soon as a session starts, its box will appear anchored to the first candle. The top and bottom of the box expand if new extremes occur.
When the session closes, the final box remains visible and two horizontal rays mark that session’s high and low.
Analyze Key Levels:
Use the high- and low-level rays to gauge session liquidity zones—areas where stop orders, breakouts, or reversals often occur.
For example, if London’s high is significantly above current price, it may act as resistance in the New York session.
Customize to Your Needs:
Toggle specific sessions on/off (e.g., if you only care about London and New York).
Change each session’s color to match your chart theme.
Adjust the “UTC Offset” so sessions align with your local time.
Disable labels or box borders if you prefer a cleaner look.
Inputs Overview:
Show London/New York/Asia Session (bool): Show or hide each session’s box and its high/low rays.
Time Range (session): Defines the start/end of each session in “HHMM–HHMM” (24h) format.
Colour (color): Custom color for each session’s box fill, border, and high/low rays.
Show Session Labels (bool): Toggle the “London,” “New York,” “Asia” text that appears at the top of each completed box.
Show Range Outline (bool): Toggle the box border (if off, only a translucent fill is drawn).
Opacity Preset (Dark/Medium/Light): Controls transparency of box fill and border.
UTC Offset (+/–) (int): Adjusts session times for different time zones (e.g., +1 for UTC+1).
Why It’s Useful:
Quickly Identify Session Activity: Visually distinguish when each major trading session is active, then compare price action across sessions.
Pinpoint High/Low Liquidity Levels: Drawn rays highlight where the market hit its extremes—critical zones for stop orders or breakout entries.
Multi-Timeframe Context: By seeing historical session boxes and rays, you can locate recurring supply/demand areas, overlap zones, or session re-tests.
Fully Automated Workflow: Once added to your chart, the script does all the work of tracking session boundaries and drawing high/low lines—no manual box or line drawing necessary.
Example Use Cases:
London Breakout Traders: See where London’s high/low formed, then wait for price to revisit those levels during the New York session.
Range Breakout Strategies: If price consolidates inside the London box, use the boxed extremes as immediate targets for breakout entries.
Intraday Liquidity Swings: During quieter hours, watch Asia’s high/low to identify potential support/resistance before London’s opening.
Overlap Zones: Compare London’s range with Asia’s range to find areas of confluence—high-probability reversal or continuation zones.

Collatz Conjecture - DolphinTradeBot1️⃣ Overview
Every positive number follows its own unique path to reach 1 according to the Collatz rule.
Some numbers reach the end quickly and directly.
Others rise significantly before crashing down sharply.
Some get stuck within a certain range for a while before finally reaching 1.
Each number follows a different pattern — the number of steps it takes, how high it climbs, or which values it passes through cannot be predicted in advance.
This is a structure that appears chaotic but ultimately leads to order:
Every number reaches 1, but the way it gets there is entirely uncertain.
2️⃣ How Is It Work?
The rule is simple:
▪️ If the number is even → divide it by two.
▪️ If it’s odd → multiply it by three and add one.
Repeat this process at each step.
Example :
Let’s say the starting number is 7:
7 → 22 → 11 → 34 → 17 → 52 → 26 → 13 → 40 → 20 → 10 → 5 → 16 → 8 → 4 → 2 → 1
It reaches 1 in 17 steps.
And from there, it always enters the same cycle:
4 → 2 → 1 → 4 → 2 → 1...
3️⃣ Why Is It Worth Learning?
🎯 This indicator isn’t just mathematical fun—it’s a thought experiment for those who dare to question market behavior.
▪️ It’s fun.
Watching numbers behave in unpredictable ways from a simple rule set is surprisingly enjoyable.
▪️ It shows how hard it is to teach a computer what randomness really is .
The Collatz process can be used to simulate chaotic behavior and may even inspire creative ways to introduce complexity into your code.
▪️ It makes you think — especially in financial markets.
The patternless, yet rule-based structure of Collatz can help train your mind to recognize that not all unpredictability is random. It’s a great mental model for navigating complex systems like price action.
▪️ Just like price movements in financial markets, this ancient problem remains unsolved.
Despite its simplicity, the Collatz conjecture has resisted proof for decades — a reminder that even the most basic-looking systems can hide deep complexity.
4️⃣ How To Use?
Super easy — in the indicator’s settings, there’s just one input field.
Enter any positive number, and you’ll see the pattern it follows on its way to 1.
You can also observe how many steps it takes and which values it visits in the info box at the top center of the chart.
5️⃣ Some Examples
You Can Observe the Chaos in the Following Examples⤵️
For Input Number → 12
For Input Number → 13
For Input Number → 14
For Input Number → 32768
For Input Number → 47

Moving Average Shift WaveTrend StrategyMoving Average Shift WaveTrend Strategy
🧭 Overview
The Moving Average Shift WaveTrend Strategy is a trend-following and momentum-based trading system designed to be overlayed on TradingView charts. It executes trades based on the confluence of multiple technical conditions—volatility, session timing, trend direction, and oscillator momentum—to deliver logical and systematic trade entries and exits.
🎯 Strategy Objectives
Enter trades aligned with the prevailing long-term trend
Exit trades on confirmed momentum reversals
Avoid false signals using session timing and volatility filters
Apply structured risk management with automatic TP, SL, and trailing stops
⚙️ Key Features
Selectable MA types: SMA, EMA, SMMA (RMA), WMA, VWMA
Dual-filter logic using a custom oscillator and moving averages
Session and volatility filters to eliminate low-quality setups
Trailing stop, configurable Take Profit / Stop Loss logic
“In-wave flag” prevents overtrading within the same trend wave
Visual clarity with color-shifting candles and entry/exit markers
📈 Trading Rules
✅ Long Entry Conditions:
Price is above the selected MA
Oscillator is positive and rising
200-period EMA indicates an uptrend
ATR exceeds its median value (sufficient volatility)
Entry occurs between 09:00–17:00 (exchange time)
Not currently in an active wave
🔻 Short Entry Conditions:
Price is below the selected MA
Oscillator is negative and falling
200-period EMA indicates a downtrend
All other long-entry conditions are inverted
❌ Exit Conditions:
Take Profit or Stop Loss is hit
Opposing signals from oscillator and MA
Trailing stop is triggered
🛡️ Risk Management Parameters
Pair: ETH/USD
Timeframe: 4H
Starting Capital: $3,000
Commission: 0.02%
Slippage: 2 pips
Risk per Trade: 2% of account equity (adjustable)
Total Trades: 224
Backtest Period: May 24, 2016 — April 7, 2025
Note: Risk parameters are fully customizable to suit your trading style and broker conditions.
🔧 Trading Parameters & Filters
Time Filter: Trades allowed only between 09:00–17:00 (exchange time)
Volatility Filter: ATR must be above its median value
Trend Filter: Long-term 200-period EMA
📊 Technical Settings
Moving Average
Type: SMA
Length: 40
Source: hl2
Oscillator
Length: 15
Threshold: 0.5
Risk Management
Take Profit: 1.5%
Stop Loss: 1.0%
Trailing Stop: 1.0%
👁️ Visual Support
MA and oscillator color changes indicate directional bias
Clear chart markers show entry and exit points
Trailing stops and risk controls are transparently managed
🚀 Strategy Improvements & Uniqueness
In-wave flag avoids repeated entries within the same trend phase
Filtering based on time, volatility, and trend ensures higher-quality trades
Dynamic high/low tracking allows precise trailing stop placement
Fully rule-based execution reduces emotional decision-making
💡 Inspirations & Attribution
This strategy is inspired by the excellent concept from:
ChartPrime – “Moving Average Shift”
It expands on the original idea with advanced trade filters and trailing logic.
Source reference:
📌 Summary
The Moving Average Shift WaveTrend Strategy offers a rule-based, reliable approach to trend trading. By combining trend and momentum filters with robust risk controls, it provides a consistent framework suitable for various market conditions and trading styles.
⚠️ Disclaimer
This script is for educational purposes only. Trading involves risk. Always use proper backtesting and risk evaluation before applying in live markets.

Quarterly Cycle Theory with DST time AdjustedThe Quarterly Theory removes ambiguity, as it gives specific time-based reference points to look for when entering trades. Before being able to apply this theory to trading, one must first understand that time is fractal:
Yearly Quarters = 4 quarters of three months each.
Monthly Quarters = 4 quarters of one week each.
Weekly Quarters = 4 quarters of one day each (Monday - Thursday). Friday has its own specific function.
Daily Quarters = 4 quarters of 6 hours each = 4 trading sessions of a trading day.
Sessions Quarters = 4 quarters of 90 minutes each.
90 Minute Quarters = 4 quarters of 22.5 minutes each.
Yearly Cycle: Analogously to financial quarters, the year is divided in four sections of three months each:
Q1 - January, February, March.
Q2 - April, May, June (True Open, April Open).
Q3 - July, August, September.
Q4 - October, November, December.
S&P 500 E-mini Futures (daily candles) — Monthly Cycle.
Monthly Cycle: Considering that we have four weeks in a month, we start the cycle on the first month’s Monday (regardless of the calendar Day):
Q1 - Week 1: first Monday of the month.
Q2 - Week 2: second Monday of the month (True Open, Daily Candle Open Price).
Q3 - Week 3: third Monday of the month.
Q4 - Week 4: fourth Monday of the month.
S&P 500 E-mini Futures (4 hour candles) — Weekly Cycle.
Weekly Cycle: Daye determined that although the trading week is composed by 5 trading days, we should ignore Friday, and the small portion of Sunday’s price action:
Q1 - Monday.
Q2 - Tuesday (True Open, Daily Candle Open Price).
Q3 - Wednesday.
Q4 - Thursday.
S&P 500 E-mini Futures (1 hour candles) — Daily Cycle.
Daily Cycle: The Day can be broken down into 6 hour quarters. These times roughly define the sessions of the trading day, reinforcing the theory’s validity:
Q1 - 18:00 - 00:00 Asia.
Q2 - 00:00 - 06:00 London (True Open).
Q3 - 06:00 - 12:00 NY AM.
Q4 - 12:00 - 18:00 NY PM.
S&P 500 E-mini Futures (15 minute candles) — 6 Hour Cycle.
6 Hour Quarters or 90 Minute Cycle / Sessions divided into four sections of 90 minutes each (EST/EDT):
Asian Session
Q1 - 18:00 - 19:30
Q2 - 19:30 - 21:00 (True Open)
Q3 - 21:00 - 22:30
Q4 - 22:30 - 00:00
London Session
Q1 - 00:00 - 01:30
Q2 - 01:30 - 03:00 (True Open)
Q3 - 03:00 - 04:30
Q4 - 04:30 - 06:00
NY AM Session
Q1 - 06:00 - 07:30
Q2 - 07:30 - 09:00 (True Open)
Q3 - 09:00 - 10:30
Q4 - 10:30 - 12:00
NY PM Session
Q1 - 12:00 - 13:30
Q2 - 13:30 - 15:00 (True Open)
Q3 - 15:00 - 16:30
Q4 - 16:30 - 18:00
S&P 500 E-mini Futures (5 minute candles) — 90 Minute Cycle.
Micro Cycles: Dividing the 90 Minute Cycle yields 22.5 Minute Quarters, also known as Micro Sessions or Micro Quarters:
Asian Session
Q1/1 18:00:00 - 18:22:30
Q2 18:22:30 - 18:45:00
Q3 18:45:00 - 19:07:30
Q4 19:07:30 - 19:30:00
Q2/1 19:30:00 - 19:52:30 (True Session Open)
Q2/2 19:52:30 - 20:15:00
Q2/3 20:15:00 - 20:37:30
Q2/4 20:37:30 - 21:00:00
Q3/1 21:00:00 - 21:23:30
etc. 21:23:30 - 21:45:00
London Session
00:00:00 - 00:22:30 (True Daily Open)
00:22:30 - 00:45:00
00:45:00 - 01:07:30
01:07:30 - 01:30:00
01:30:00 - 01:52:30 (True Session Open)
01:52:30 - 02:15:00
02:15:00 - 02:37:30
02:37:30 - 03:00:00
03:00:00 - 03:22:30
03:22:30 - 03:45:00
03:45:00 - 04:07:30
04:07:30 - 04:30:00
04:30:00 - 04:52:30
04:52:30 - 05:15:00
05:15:00 - 05:37:30
05:37:30 - 06:00:00
New York AM Session
06:00:00 - 06:22:30
06:22:30 - 06:45:00
06:45:00 - 07:07:30
07:07:30 - 07:30:00
07:30:00 - 07:52:30 (True Session Open)
07:52:30 - 08:15:00
08:15:00 - 08:37:30
08:37:30 - 09:00:00
09:00:00 - 09:22:30
09:22:30 - 09:45:00
09:45:00 - 10:07:30
10:07:30 - 10:30:00
10:30:00 - 10:52:30
10:52:30 - 11:15:00
11:15:00 - 11:37:30
11:37:30 - 12:00:00
New York PM Session
12:00:00 - 12:22:30
12:22:30 - 12:45:00
12:45:00 - 13:07:30
13:07:30 - 13:30:00
13:30:00 - 13:52:30 (True Session Open)
13:52:30 - 14:15:00
14:15:00 - 14:37:30
14:37:30 - 15:00:00
15:00:00 - 15:22:30
15:22:30 - 15:45:00
15:45:00 - 15:37:30
15:37:30 - 16:00:00
16:00:00 - 16:22:30
16:22:30 - 16:45:00
16:45:00 - 17:07:30
17:07:30 - 18:00:00
S&P 500 E-mini Futures (30 second candles) — 22.5 Minute Cycle.

Correlation Heatmap█ OVERVIEW
This indicator creates a correlation matrix for a user-specified list of symbols based on their time-aligned weekly or monthly price returns. It calculates the Pearson correlation coefficient for each possible symbol pair, and it displays the results in a symmetric table with heatmap-colored cells. This format provides an intuitive view of the linear relationships between various symbols' price movements over a specific time range.
█ CONCEPTS
Correlation
Correlation typically refers to an observable statistical relationship between two datasets. In a financial time series context, it usually represents the extent to which sampled values from a pair of datasets, such as two series of price returns, vary jointly over time. More specifically, in this context, correlation describes the strength and direction of the relationship between the samples from both series.
If two separate time series tend to rise and fall together proportionally, they might be highly correlated. Likewise, if the series often vary in opposite directions, they might have a strong anticorrelation . If the two series do not exhibit a clear relationship, they might be uncorrelated .
Traders frequently analyze asset correlations to help optimize portfolios, assess market behaviors, identify potential risks, and support trading decisions. For instance, correlation often plays a key role in diversification . When two instruments exhibit a strong correlation in their returns, it might indicate that buying or selling both carries elevated unsystematic risk . Therefore, traders often aim to create balanced portfolios of relatively uncorrelated or anticorrelated assets to help promote investment diversity and potentially offset some of the risks.
When using correlation analysis to support investment decisions, it is crucial to understand the following caveats:
• Correlation does not imply causation . Two assets might vary jointly over an analyzed range, resulting in high correlation or anticorrelation in their returns, but that does not indicate that either instrument directly influences the other. Joint variability between assets might occur because of shared sensitivities to external factors, such as interest rates or global sentiment, or it might be entirely coincidental. In other words, correlation does not provide sufficient information to identify cause-and-effect relationships.
• Correlation does not predict the future relationship between two assets. It only reflects the estimated strength and direction of the relationship between the current analyzed samples. Financial time series are ever-changing. A strong trend between two assets can weaken or reverse in the future.
Correlation coefficient
A correlation coefficient is a numeric measure of correlation. Several coefficients exist, each quantifying different types of relationships between two datasets. The most common and widely known measure is the Pearson product-moment correlation coefficient , also known as the Pearson correlation coefficient or Pearson's r . Usually, when the term "correlation coefficient" is used without context, it refers to this correlation measure.
The Pearson correlation coefficient quantifies the strength and direction of the linear relationship between two variables. In other words, it indicates how consistently variables' values move together or in opposite directions in a proportional, linear manner. Its formula is as follows:
𝑟(𝑥, 𝑦) = cov(𝑥, 𝑦) / (𝜎𝑥 * 𝜎𝑦)
Where:
• 𝑥 is the first variable, and 𝑦 is the second variable.
• cov(𝑥, 𝑦) is the covariance between 𝑥 and 𝑦.
• 𝜎𝑥 is the standard deviation of 𝑥.
• 𝜎𝑦 is the standard deviation of 𝑦.
In essence, the correlation coefficient measures the covariance between two variables, normalized by the product of their standard deviations. The coefficient's value ranges from -1 to 1, allowing a more straightforward interpretation of the relationship between two datasets than what covariance alone provides:
• A value of 1 indicates a perfect positive correlation over the analyzed sample. As one variable's value changes, the other variable's value changes proportionally in the same direction .
• A value of -1 indicates a perfect negative correlation (anticorrelation). As one variable's value increases, the other variable's value decreases proportionally.
• A value of 0 indicates no linear relationship between the variables over the analyzed sample.
Aligning returns across instruments
In a financial time series, each data point (i.e., bar) in a sample represents information collected in periodic intervals. For instance, on a "1D" chart, bars form at specific times as successive days elapse.
However, the times of the data points for a symbol's standard dataset depend on its active sessions , and sessions vary across instrument types. For example, the daily session for NYSE stocks is 09:30 - 16:00 UTC-4/-5 on weekdays, Forex instruments have 24-hour sessions that span from 17:00 UTC-4/-5 on one weekday to 17:00 on the next, and new daily sessions for cryptocurrencies start at 00:00 UTC every day because crypto markets are consistently open.
Therefore, comparing the standard datasets for different asset types to identify correlations presents a challenge. If two symbols' datasets have bars that form at unaligned times, their correlation coefficient does not accurately describe their relationship. When calculating correlations between the returns for two assets, both datasets must maintain consistent time alignment in their values and cover identical ranges for meaningful results.
To address the issue of time alignment across instruments, this indicator requests confirmed weekly or monthly data from spread tickers constructed from the chart's ticker and another specified ticker. The datasets for spreads are derived from lower-timeframe data to ensure the values from all symbols come from aligned points in time, allowing a fair comparison between different instrument types. Additionally, each spread ticker ID includes necessary modifiers, such as extended hours and adjustments.
In this indicator, we use the following process to retrieve time-aligned returns for correlation calculations:
1. Request the current and previous prices from a spread representing the sum of the chart symbol and another symbol ( "chartSymbol + anotherSymbol" ).
2. Request the prices from another spread representing the difference between the two symbols ( "chartSymbol - anotherSymbol" ).
3. Calculate half of the difference between the values from both spreads ( 0.5 * (requestedSum - requestedDifference) ). The results represent the symbol's prices at times aligned with the sample points on the current chart.
4. Calculate the arithmetic return of the retrieved prices: (currentPrice - previousPrice) / previousPrice
5. Repeat steps 1-4 for each symbol requiring analysis.
It's crucial to note that because this process retrieves prices for a symbol at times consistent with periodic points on the current chart, the values can represent prices from before or after the closing time of the symbol's usual session.
Additionally, note that the maximum number of weeks or months in the correlation calculations depends on the chart's range and the largest time range common to all the requested symbols. To maximize the amount of data available for the calculations, we recommend setting the chart to use a daily or higher timeframe and specifying a chart symbol that covers a sufficient time range for your needs.
█ FEATURES
This indicator analyzes the correlations between several pairs of user-specified symbols to provide a structured, intuitive view of the relationships in their returns. Below are the indicator's key features:
Requesting a list of securities
The "Symbol list" text box in the indicator's "Settings/Inputs" tab accepts a comma-separated list of symbols or ticker identifiers with optional spaces (e.g., "XOM, MSFT, BITSTAMP:BTCUSD"). The indicator dynamically requests returns for each symbol in the list, then calculates the correlation between each pair of return series for its heatmap display.
Each item in the list must represent a valid symbol or ticker ID. If the list includes an invalid symbol, the script raises a runtime error.
To specify a broker/exchange for a symbol, include its name as a prefix with a colon in the "EXCHANGE:SYMBOL" format. If a symbol in the list does not specify an exchange prefix, the indicator selects the most commonly used exchange when requesting the data.
Note that the number of symbols allowed in the list depends on the user's plan. Users with non-professional plans can compare up to 20 symbols with this indicator, and users with professional plans can compare up to 32 symbols.
Timeframe and data length selection
The "Returns timeframe" input specifies whether the indicator uses weekly or monthly returns in its calculations. By default, its value is "1M", meaning the indicator analyzes monthly returns. Note that this script requires a chart timeframe lower than or equal to "1M". If the chart uses a higher timeframe, it causes a runtime error.
To customize the length of the data used in the correlation calculations, use the "Max periods" input. When enabled, the indicator limits the calculation window to the number of periods specified in the input field. Otherwise, it uses the chart's time range as the limit. The top-left corner of the table shows the number of confirmed weeks or months used in the calculations.
It's important to note that the number of confirmed periods in the correlation calculations is limited to the largest time range common to all the requested datasets, because a meaningful correlation matrix requires analyzing each symbol's returns under the same market conditions. Therefore, the correlation matrix can show different results for the same symbol pair if another listed symbol restricts the aligned data to a shorter time range.
Heatmap display
This indicator displays the correlations for each symbol pair in a heatmap-styled table representing a symmetric correlation matrix. Each row and column corresponds to a specific symbol, and the cells at their intersections correspond to symbol pairs . For example, the cell at the "AAPL" row and "MSFT" column shows the weekly or monthly correlation between those two symbols' returns. Likewise, the cell at the "MSFT" row and "AAPL" column shows the same value.
Note that the main diagonal cells in the display, where the row and column refer to the same symbol, all show a value of 1 because any series of non-na data is always perfectly correlated with itself.
The background of each correlation cell uses a gradient color based on the correlation value. By default, the gradient uses blue hues for positive correlation, orange hues for negative correlation, and white for no correlation. The intensity of each blue or orange hue corresponds to the strength of the measured correlation or anticorrelation. Users can customize the gradient's base colors using the inputs in the "Color gradient" section of the "Settings/Inputs" tab.
█ FOR Pine Script® CODERS
• This script uses the `getArrayFromString()` function from our ValueAtTime library to process the input list of symbols. The function splits the "string" value by its commas, then constructs an array of non-empty strings without leading or trailing whitespaces. Additionally, it uses the str.upper() function to convert each symbol's characters to uppercase.
• The script's `getAlignedReturns()` function requests time-aligned prices with two request.security() calls that use spread tickers based on the chart's symbol and another symbol. Then, it calculates the arithmetic return using the `changePercent()` function from the ta library. The `collectReturns()` function uses `getAlignedReturns()` within a loop and stores the data from each call within a matrix . The script calls the `arrayCorrelation()` function on pairs of rows from the returned matrix to calculate the correlation values.
• For consistency, the `getAlignedReturns()` function includes extended hours and dividend adjustment modifiers in its data requests. Additionally, it includes other settings inherited from the chart's context, such as "settlement-as-close" preferences.
• A Pine script can execute up to 40 or 64 unique `request.*()` function calls, depending on the user's plan. The maximum number of symbols this script compares is half the plan's limit, because `getAlignedReturns()` uses two request.security() calls.
• This script can use the request.security() function within a loop because all scripts in Pine v6 enable dynamic requests by default. Refer to the Dynamic requests section of the Other timeframes and data page to learn more about this feature, and see our v6 migration guide to learn what's new in Pine v6.
• The script's table uses two distinct color.from_gradient() calls in a switch structure to determine the cell colors for positive and negative correlation values. One call calculates the color for values from -1 to 0 based on the first and second input colors, and the other calculates the colors for values from 0 to 1 based on the second and third input colors.
Look first. Then leap.

VWAP Horizon Suite Optimized - CoffeeKillerVWAP Horizon Suite Optimized - User Guide
Overview
The VWAP Horizon Suite Optimized is a comprehensive technical analysis tool for TradingView designed to enhance your trading strategy with Volume Weighted Average Price (VWAP) analysis, standard deviation bands, and customizable Exponential Moving Averages (EMAs). This indicator provides a robust framework for identifying potential support and resistance levels, price momentum, and market trends.
Key Features
- **Daily VWAP with Session Reset**: Automatically resets at 17:00 (5:00 PM) each day
- **Customizable Standard Deviation/Percentage Bands**: Up to 3 bands above and below VWAP
- **High/Low Point Detection**: Visual markers for significant price levels
- **Multiple Customizable EMAs**: 8 different EMAs that can be individually toggled and styled
- **Visual Customization**: Adjustable colors, fills, and styles for all elements
VWAP Settings
- **Source**: Determines the price data used to calculate VWAP (default: HLC3 - High, Low, Close average)
Bands Settings
- **Bands Calculation Mode**: Choose between "Standard Deviation" or "Percentage" methods
- **Show Band #1, #2, #3**: Toggle visibility for each band
- **Band Multiplier #1, #2, #3**: Adjust the distance from VWAP (in standard deviations or percentage)
- **Show Fills**: Enable colored fills between bands for better visualization
Visualization Settings
- **Show High/Low Markers**: Display diamond markers for local high and low points relative to VWAP, these reset based on the price crossing the VWAP Line.
EMA Settings
The indicator provides 8 customizable EMAs (8, 13, 21, 26, 48, 50, 100, and 200) with individual controls:
- **Show EMA X**: Toggle visibility for each EMA
- **EMA X Period**: Adjust the period length for calculation
- **EMA X Color**: Customize the color of each EMA
- **EMA Line Width**: Set the width for all EMA lines
How to Use
Basic VWAP Analysis
The core VWAP line (blue) represents the average price weighted by volume since the start of the session (17:00 daily reset). This serves as a dynamic support/resistance level and reference point for intraday trading.
1. **Price above VWAP**: Generally bullish short-term sentiment
2. **Price below VWAP**: Generally bearish short-term sentiment
3. **Crosses of VWAP**: Potential shift in short-term momentum
Standard Deviation Bands
The bands surrounding VWAP help identify potential support, resistance, and volatility levels:
- **Band #1 (±1σ)**: Price often reverts to VWAP when reaching these levels
- **Band #2 (±2σ)**: Stronger support/resistance areas, possible reversal zones
- **Band #3 (±3σ)**: Extreme price levels, often indicating overbought/oversold conditions
High/Low Point Detection
Purple and yellow diamond markers identify significant swing highs and lows relative to VWAP, helping you recognize potential reversal points or continuation patterns. (These repaint in a effort to find the max high/low point from the VWAP Line)
EMA Strategy
The customizable EMAs can be used to:
- Find potential support/resistance levels
- Create crossover systems
- Analyze market structure
Common EMA combinations include:
- 8 & 21 for short-term trends
- 50 & 200 for long-term trends and the "Golden Cross/Death Cross"
- 13 & 48 for the "New Golden Cross" - a modern alternative gaining popularity among traders
- 8, 13, 21 for complex short-term momentum analysis
Advanced Usage Tips
For Day Traders
1. **Opening Range Analysis**: Watch how price reacts to VWAP in the first hour of trading
2. **VWAP Reversions**: Look for trades when price touches outer bands and reverses toward VWAP
3. **Band Breakouts**: Strong moves beyond Band #2 may indicate momentum for continuation
For Swing Traders
1. **Use alongside daily/weekly support-resistance levels**
2. **Combine with EMA crossovers for trend confirmation**
3. **Identify potential reversal zones where price reaches Band #3**
Combined Strategies
- **EMA + VWAP Confluence**: Strong signals occur when EMA lines and VWAP/bands align at the same price level
- **High/Low + Band Touch**: When a high/low marker appears near a band, it may indicate a stronger support/resistance level
Conclusion
The VWAP Horizon Suite Optimized provides a comprehensive set of tools for price analysis based on volume-weighted data and exponential averages. By understanding and properly configuring the various components, you can create a powerful visual framework for identifying potential trading opportunities across multiple timeframes.
Remember that no indicator provides perfect signals, and the VWAP Horizon Suite works best when used as part of a complete trading strategy that includes risk management, multiple confirmation tools, and proper analysis of market conditions.
DISCLAIMER
**DISCLAIMER: This indicator and its signals are intended solely for educational and informational purposes. They do not constitute financial advice. Trading involves significant risk of loss. Always conduct your own analysis and consult with financial professionals before making trading decisions.**

Highs & Lows RTH/OVN/IBs/D/W/M/YOverview
Plots the highs and lows of RTH, OVN/ETH, IBs of those sessions, previous Day, Week, Month, and Year.
Features
Allows the user to enable/disable plotting the high/low of each period.
Lines' length, offset, and colors can be customized
Labels' position, size, color, and style can be customized
Support
Questions, feedbacks, and requests are welcomed. Please feel free to use Comments or direct private message via TradingView.
Disclaimer
This stock chart indicator provided is for informational purposes only and should not be considered as financial or investment advice. The data and information presented in this indicator are obtained from sources believed to be reliable, but we do not warrant its completeness or accuracy.
Users should be aware that:
Any investment decisions made based on this indicator are at your own risk.
The creators and providers of this indicator disclaim all liability for any losses, damages, or other consequences resulting from its use. By using this stock chart indicator, you acknowledge and accept the inherent risks associated with trading and investing in financial markets.
Release Date: 2025-01-17
Release Version: v1 r1
Release Notes Date: 2025-01-17

Overnight High/LowThe script identifies the Overnight High (the highest price) and Overnight Low (the lowest price) for a trading instrument during a specified overnight session. It then plots these levels on the chart for reference in subsequent trading sessions.
Key Features:
Time Settings:
The script defines the start (startHour) and end (endHour + endMinute) times for the overnight session.
The session spans across two calendar days, such as 5:00 PM (17:00) to 9:30 AM (09:30).
Tracking High and Low:
During the overnight session, the script dynamically tracks:
Overnight High: The highest price reached during the session.
Overnight Low: The lowest price reached during the session.
Reset Mechanism:
After the overnight session ends (at the specified end time), the script resets the overnightHigh and overnightLow variables, preparing for the next session.
Visual Representation:
The script uses horizontal dotted lines to plot:
A green line for the Overnight High.
A red line for the Overnight Low.
These lines extend to the right of the chart, providing visual reference points for traders.
How It Works:
Session Detection:
The script checks whether the current time falls within the overnight session:
If the hour is greater than or equal to the start hour (e.g., 17:00).
Or if the hour is less than or equal to the end hour (e.g., 09:30), considering the next day.
The end minute (e.g., 30 minutes past the hour) is also considered for precision.
High and Low Calculation:
During the overnight session:
If the overnightHigh is not yet defined, it initializes with the current candle's high.
If already defined, it updates by comparing the current candle's high to the existing overnightHigh using the math.max function.
Similarly, overnightLow is initialized or updated using the math.min function.
Post-Session Reset:
After the session ends, the script clears the overnightHigh and overnightLow variables by setting them to na (not available).
Line Drawing:
The script draws horizontal dotted lines for the Overnight High and Low during and after the session.
The lines extend indefinitely to the right of the chart.
Benefits:
Visual Aid: Helps traders quickly identify overnight support and resistance levels, which are critical for intraday trading.
Automation: Removes the need for manually plotting these levels each day.
Customizable: Time settings can be adjusted to match different markets or trading strategies.
This script is ideal for traders who use the overnight range as part of their analysis for breakouts, reversals, or trend continuation strategies.
ICT Macro Sessions by @zeusbottradingICT Macro Sessions Indicator
The ICT Macro Sessions Indicator is a powerful tool designed for traders who follow the ICT (Inner Circle Trader) methodology and want to optimize their trading during specific high-probability time intervals. This indicator highlights all the key macro sessions throughout the trading day in the GMT+8 (Hong Kong) time zone.
What Does the Indicator Do?
This indicator visually marks ICT Macro Sessions on your trading chart using background colors and optional labels. Each session corresponds to specific time intervals when institutional activity is most likely to drive price action. By focusing on these periods, traders can align their strategies with market volatility and liquidity, increasing their chances of success.
Highlighted Sessions
The indicator covers all major ICT Macro Sessions, each with a unique color for easy identification:
London Macro 1 (15:33–16:00 GMT+8):
- Marks the early London session, often characterized by strong directional moves.
London Macro 2 (17:03–17:30 GMT+8):
- Captures the mid-London session, where price frequently reacts to liquidity levels.
New York AM Macro 1 (22:50–23:10 GMT+8):
- Highlights the start of the New York session, a prime time for price reversals or continuations.
New York AM Macro 2 (23:50–00:10 GMT+8):
- Focuses on late-morning New York activity, often aligning with key news releases.
New York Lunch Macro (00:50–01:10 GMT+8):
- Covers the lunch period in New York, where price may consolidate or set up for afternoon moves.
New York PM Macro 1 (02:10–02:40 GMT+8):
- Tracks post-lunch activity in New York, often featuring renewed volatility.
New York PM Macro 2 (04:15–04:45 GMT+8):
- Captures late-session moves as institutional traders finalize their positions.
Features of the Indicator
Fixed Time: The indicator is pre-configured for GMT+8 but it will adapt automatically to your timezone. No need to change anything in the code.
Background Highlighting: Each session is visually marked with a unique background color for quick recognition.
Optional Labels: Traders can enable or disable labels for each session, providing flexibility in how information is displayed.
Session Toggles: You can choose which sessions to display based on your trading preferences and strategy.
Intraday Timeframes: The indicator is optimized for intraday charts with timeframes of 45 minutes or less. You can change it to anything you like.
Why Use This Indicator?
The ICT Macro Sessions Indicator helps traders focus on the most critical times of the trading day when institutional activity is at its peak. These periods often coincide with significant price movements, making them ideal for scalping, day trading, or even swing trading setups. By visually highlighting these sessions, the indicator eliminates guesswork and allows traders to plan their trades with precision.

5-Minute YEN Pivot Bars 1.0The 5-Minute YEN Pivot Bars indicator is designed to identify and highlight low-range pivot bars on 5-minute charts, specifically tailored for Yen-based pairs (e.g., GBPJPY, USDJPY). By focusing on precise pip thresholds, this tool helps traders detect potential pivot points within specific trading sessions, while avoiding inside bars and other noise often seen in low-volatility conditions. This can be particularly useful for trend traders and those looking to refine their entry points based on intraday reversals.
Key Features:
- Customized Pip Thresholds for Yen Pairs:
The indicator is pre-configured for Yen pairs, where 1 pip is typically represented by 0.01. It applies these thresholds:
- Limited Range: 4 pips or less between open and close prices.
- High/Low Directionality: At least 3 pips from the close/open to the bar's high or low.
- Open/Close Proximity: 4 pips or less between open and close.
- Inside Bar Tolerance: A tolerance of 3 pips for inside bars, helping reduce false signals from bars contained within the previous bar's range.
- Session-Specific Alerts:
- The indicator allows you to enable alerts for the European Session (6:00-12:00), American Session (12:00-17:00), and London Close (17:00-20:00). You can adjust these times based on your own trading hours or timezone preferences via a time-shift setting.
- Receive real-time alerts when a valid bullish or bearish pivot bar is identified within the chosen sessions, allowing you to respond to potential trade opportunities immediately.
- Time Shift Customization:
- Adjust the "Time Shift" parameter to account for different time zones, ensuring accurate session alignment regardless of your local time.
How It Works:
1. Pivot Bar Identification:
The indicator scans for bars where the difference between the open and close is within the "Limited Range" threshold, and both open and close prices are close to either the high or the low of the bar.
2. Directional Filtering:
It requires the bar to show strong directional bias by enforcing an additional distance between the open/close levels and the opposite end of the bar (high/low). Only bars with this directional structure are considered for highlighting.
3. Exclusion of Inside Bars:
Bars that are completely contained within the range of the previous bar are excluded (inside bars), as are consecutive inside bars. This filtering is essential to avoid marking bars that typically indicate consolidation rather than potential pivot points.
4. Session Alerts:
When a valid pivot bar appears within the selected sessions, an alert is triggered, notifying the trader of a potential trading signal. Bullish and bearish signals are differentiated based on whether the close is near the high or low.
How to Use:
- Trend Reversals: Use this indicator to spot potential trend reversals or pullbacks on a 5-minute chart, especially within key trading sessions.
- Entry and Exit Points: Highlighted bars can serve as potential entry points for traders looking to capitalize on short-term directional changes or continuation patterns.
- Combine with Other Indicators: Consider pairing this tool with momentum indicators or trendlines to confirm the signals, providing a comprehensive analysis framework.
Default Parameters:
- Limited Range: 4 Pips
- High/Low Directionality: 3 Pips
- Open/Close Proximity: 4 Pips
- Inside Bar Tolerance: 3 Pips
- Session Alerts: Enabled for European, American, and London Close sessions
- Time Shift: Default 6 (adjustable to align with different time zones)
This indicator is specifically optimized for Yen pairs on 5-minute charts due to its pip calculation.

Macros ICT KillZones [TradingFinder] Times & Price Trading Setup🔵 Introduction
ICT Macros, developed by Michael Huddleston, also known as ICT (Inner Circle Trader), is a powerful trading tool designed to help traders identify the best trading opportunities during key time intervals like the London and New York trading sessions.
For traders aiming to capitalize on market volatility, liquidity shifts, and Fair Value Gaps (FVG), understanding and using these critical time zones can significantly improve trading outcomes.
In today’s highly competitive financial markets, identifying the moments when the market is seeking buy-side or sell-side liquidity, or filling price imbalances, is essential for maximizing profitability.
The ICT Macros indicator is built on the renowned ICT time and price theory, which enables traders to track and leverage key market dynamics such as breaks of highs and lows, imbalances, and liquidity hunts.
This indicator automatically detects crucial market times and optimizes strategies for traders by highlighting the specific moments when price movements are most likely to occur. A standout feature of ICT Macros is its automatic adjustment for Daylight Saving Time (DST), ensuring that traders remain synced with the correct session times.
This means you can rely on accurate market timing without the need for manual updates, allowing you to focus on capturing profitable trades during critical timeframes.
🔵 How to Use
The ICT Macros indicator helps you capitalize on trading opportunities during key market moments, particularly when the market is breaking highs or lows, filling Fair Value Gaps (FVG), or addressing imbalances. This indicator is particularly beneficial for traders who seek to identify liquidity, market volatility, and price imbalances.
🟣 Sessions
London Sessions
London Macro 1 :
UTC Time : 06:33 to 07:00
New York Time : 02:33 to 03:00
London Macro 2 :
UTC Time : 08:03 to 08:30
New York Time : 04:03 to 04:30
New York Sessions
New York Macro AM 1 :
UTC Time : 12:50 to 13:10
New York Time : 08:50 to 09:10
New York Macro AM 2 :
UTC Time : 13:50 to 14:10
New York Time : 09:50 to 10:10
New York Macro AM 3 :
UTC Time : 14:50 to 15:10
New York Time : 10:50 to 11:10
New York Lunch Macro :
UTC Time : 15:50 to 16:10
New York Time : 11:50 to 12:10
New York PM Macro :
UTC Time : 17:10 to 17:40
New York Time : 13:10 to 13:40
New York Last Hour Macro :
UTC Time : 19:15 to 19:45
New York Time : 15:15 to 15:45
These time intervals adjust automatically based on Daylight Saving Time (DST), helping traders to enter or exit trades during key market moments when price volatility is high.
Below are the main applications of this tool and how to incorporate it into your trading strategies :
🟣 Combining ICT Macros with Trading Strategies
The ICT Macros indicator can easily be used in conjunction with various trading strategies. Two well-known strategies that can be combined with this indicator include:
ICT 2022 Trading Model : This model is designed based on identifying market liquidity, structural price changes, and Fair Value Gaps (FVG). By using ICT Macros, you can identify the key time intervals when the market is seeking liquidity, filling imbalances, or breaking through important highs and lows, allowing you to enter or exit trades at the right moment.
Silver Bullet Strategy : This strategy, which is built around liquidity hunting and rapid price movements, can work more accurately with the help of ICT Macros. The indicator pinpoints precise liquidity times, helping traders take advantage of market shifts caused by filling Fair Value Gaps or correcting imbalances.
🟣 Capitalizing on Price Volatility During Key Times
Large market algorithms often seek liquidity or fill Fair Value Gaps (FVG) during the intervals marked by ICT Macros. These periods are when price volatility increases, and traders can use these moments to enter or exit trades.
For example, if sell-side liquidity is drained and the market fills an imbalance, the price might move toward buy-side liquidity. By identifying these moments, which may also involve breaking a previous high or low, you can leverage rapid market fluctuations to your advantage.
🟣 Identifying Liquidity and Price Imbalances
One of the important uses of ICT Macros is identifying points where the market is seeking liquidity and correcting imbalances. You can determine high or low liquidity levels in the market before each ICT Macro, as well as Fair Value Gaps (FVG) and price imbalances that need to be filled, using them to adjust your trading strategy. This capability allows you to manage trades based on liquidity shifts or imbalance corrections without needing a bias toward a specific direction.
🔵 Settings
The ICT Macros indicator offers various customization options, allowing users to tailor it to their specific needs. Below are the main settings:
Time Zone Mode : You can select one of the following options to define how time is displayed:
UTC : For traders who need to work with Universal Time.
Session Local Time : The local time corresponding to the London or New York markets.
Your Time Zone : You can specify your own time zone (e.g., "UTC-4:00").
Your Time Zone : If you choose "Your Time Zone," you can set your specific time zone. By default, this is set to UTC-4:00.
Show Range Time : This option allows you to display the time range of each session on the chart. If enabled, the exact start and end times of each interval are shown.
Show or Hide Time Ranges : Toggle on/off for visual clarity depending on user preference.
Custom Colors : Set distinct colors for each session, allowing users to personalize their chart based on their trading style.These settings allow you to adjust the key time intervals of each trading session to your preference and customize the time format according to your own needs.
🔵 Conclusion
The ICT Macros indicator is a powerful tool for traders, helping them to identify key time intervals where the market seeks liquidity or fills Fair Value Gaps (FVG), corrects imbalances, and breaks highs or lows. This tool is especially valuable for traders using liquidity-based strategies such as ICT 2022 or Silver Bullet.
One of the key features of this indicator is its support for Daylight Saving Time (DST), ensuring you are always in sync with the correct trading session timings without manual adjustments. This is particularly beneficial for traders operating across different time zones.
With ICT Macros, you can capitalize on crucial market opportunities during sensitive times, take advantage of imbalances, and enhance your trading strategies based on market volatility, liquidity shifts, and Fair Value Gaps.

Sessions Full Markets [TradingFinder] Forex Stocks Index 7 Time🔵 Introduction
In global financial markets, particularly in FOREX and stocks, precise timing of trading sessions plays a crucial role in the success of traders. Each trading session—Asian, European, and American—has its own unique characteristics in terms of volatility and trading volume.
The Asian session (Tokyo), Sydney session, Shanghai session, European session (London and Frankfurt), and American session (New York AM and New York PM) are examples of these trading sessions, each of which opens and closes at specific times.
This session indicator also includes a Time Convertor, enabling users to view FOREX market hours based on GMT, UTC, EST, and local time. Another valuable feature of this indicator is the automatic detection of Daylight Saving Time (DST), which automatically applies time changes for the New York, London, and Sydney sessions.
🔵 How to Use
The indicator also displays session times based on the exact opening and closing times for each geographic region. Users can utilize this indicator to view trading hours either locally or in UTC time, and if needed, set their own custom trading times.
Additionally, the session information table includes the start and end times of each session and whether they are open or closed. This functionality helps traders make better trading decisions by using accurate and precise time data.
Key Features of the Session Indicator
The session indicator is a versatile and advanced tool that provides several unique features for traders.
Some of these features are :
• Automatic Daylight Saving Time (DST) Detection : This indicator dynamically detects Daylight Saving Time (DST) changes for various trading sessions, including New York, London, and Sydney, without requiring manual adjustments. This feature allows traders to manage their trades without worrying about time changes.
Below are the start and end dates for DST in the New York, London, and Sydney trading sessions :
1. New York :
Start of DST: Second Sunday of March, at 2:00 AM.
End of DST: First Sunday of November, at 2:00 AM
2. London :
Start of DST: Last Sunday of March, at 1:00 AM.
End of DST: Last Sunday of October, at 2:00 AM.
3. Sydney :
Start of DST: First Sunday of October, at 2:00 AM.
End of DST: First Sunday of April, at 3:00 AM.
• Session Display Based on Different Time Zones : The session indicator allows users to view trading times based on different time zones, such as UTC, the local time of each market, or the user’s local time. This feature is especially useful for traders operating in diverse geographic regions.
• Custom Trading Time Setup : Another notable feature of this indicator is the ability to set custom trading times. Traders can adjust their own trading times according to their personal strategies and benefit from this flexibility.
• Session Information Table : The session indicator provides a complete information table that includes the exact start and end times of each trading session and whether they are open or closed. This table helps users simultaneously and accurately monitor the status of all trading sessions and make better trading decisions.
🟣 Session Trading Hours Based on Market Mode and Time Zones
The session indicator provides precise information on the start and end times of trading sessions.
These times are adjusted based on different market modes (FOREX, stocks, and TFlab suggestions) and time zones (UTC and local time) :
🟣 (FOREX Session Time) Forex Market Mode
• Sessions in UTC (DST inactive) :
Sydney: 22:00 - 06:00
Tokyo: 23:00 - 07:00
Shanghai: 01:00 - 09:00
Asia: 22:00 - 07:00
Europe: 07:00 - 16:00
London: 08:00 - 16:00
New York: 13:00 - 21:00
• Sessions in UTC (DST active) :
Sydney: 21:00 - 05:00
Tokyo: 23:00 - 07:00
Shanghai: 01:00 - 09:00
Asia: 21:00 - 07:00
Europe: 06:00 - 15:00
London: 07:00 - 15:00
New York: 12:00 - 20:00
• Sessions in Local Time :
Sydney: 08:00 - 16:00
Tokyo: 08:00 - 16:00
Shanghai: 09:00 - 17:00
Asia: 22:00 - 07:00
Europe: 07:00 - 16:00
London: 08:00 - 16:00
New York: 08:00 - 16:00
🟣 Stock Market Trading Hours (Stock Market Mode)
• Sessions in UTC (DST inactive) :
Sydney: 00:00 - 06:00
Asia: 00:00 - 06:00
Europe: 07:00 - 16:30
London: 08:00 - 16:30
New York: 14:30 - 21:00
Tokyo: 00:00 - 06:00
Shanghai: 01:30 - 07:00
• Sessions in UTC (DST active) :
Sydney: 23:00 - 05:00
Asia: 23:00 - 06:00
Europe: 06:00 - 15:30
London: 07:00 - 15:30
New York: 13:30 - 20:00
Tokyo: 00:00 - 06:00
Shanghai: 01:30 - 07:00
• Sessions in Local Time:
Sydney: 10:00 - 16:00
Tokyo: 09:00 - 15:00
Shanghai: 09:30 - 15:00
Asia: 00:00 - 06:00
Europe: 07:00 - 16:30
London: 08:00 - 16:30
New York: 09:30 - 16:00
🟣 TFlab Suggestion Mode
• Sessions in UTC (DST inactive) :
Sydney: 23:00 - 05:00
Tokyo: 00:00 - 06:00
Shanghai: 01:00 - 09:00
Asia: 23:00 - 06:00
Europe: 07:00 - 16:00
London: 08:00 - 16:00
New York: 13:00 - 21:00
• Sessions in UTC (DST active) :
Sydney: 22:00 - 04:00
Tokyo: 00:00 - 06:00
Shanghai: 01:00 - 09:00
Asia: 22:00 - 06:00
Europe: 06:00 - 15:00
London: 07:00 - 15:00
New York: 12:00 - 20:00
• Sessions in Local Time :
Sydney: 09:00 - 16:00
Tokyo: 09:00 - 15:00
Shanghai: 09:00 - 17:00
Asia: 23:00 - 06:00
Europe: 07:00 - 16:00
London: 08:00 - 16:00
New York: 08:00 - 16:00
🔵 Setting
Using the session indicator is straightforward and practical. Users can add this indicator to their trading chart and take advantage of its features.
The usage steps are as follows :
Selecting Market Mode : The user can choose one of the three main modes.
Forex Market Mode: Displays the forex market trading hours.
oStock Market Mode: Displays the trading hours of stock exchanges.
Custom Mode: Allows the user to set trading hours based on their needs.
TFlab Suggestion Mode: Displays the higher volume hours of the forex market in Asia.
Setting the Time Zone : The indicator allows displaying sessions based on various time zones. The user can select one of the following options:
UTC (Coordinated Universal Time)
Local Time of the Session
User’s Local Time
Displaying Comprehensive Session Information : The session information table includes the opening and closing times of each session and whether they are open or closed. This table helps users monitor all sessions at a glance and precisely set the best time for entering and exiting trades.
🔵Conclusion
The session indicator is a highly efficient and essential tool for active traders in the FOREX and stock markets. With its unique features, such as automatic DST detection and the ability to display sessions based on different time zones, the session indicator helps traders to precisely and efficiently adjust their trading activities.
This indicator not only shows users the exact opening and closing times of sessions, but by providing a session status table, it helps traders identify the best times to enter and exit trades. Moreover, the ability to set custom trading times allows traders to easily personalize their trading schedules according to their strategies.
In conclusion, using the session indicator ensures that traders are continuously and accurately informed of time changes and the opening and closing hours of markets, eliminating the need for manual updates to align with DST changes. These features enable traders to optimize their trading strategies with greater confidence and up-to-date information, allowing them to capitalize on opportunities in the market.

Digital Clock with Market Status and AlertsDigital Clock with Market Status and Alerts - 日本語解説は下記
Overview:
The Digital Clock with Market Status and Alerts indicator is designed to display the current time in various global time zones while also providing the status of major financial markets such as Tokyo, London, and New York. This indicator helps traders monitor the open and close times of different markets and alerts them when a market opens. Customizable options are provided for table positioning, background, text colors, and font size.
Key Features:
Real-Time Digital Clock: The indicator shows the current time in your selected time zone (Asia/Tokyo, America/New_York, Europe/London, Australia/Sydney). The time updates in real-time and includes hours, minutes, and seconds, providing a convenient and accurate way to monitor time across different trading sessions.
Global Market Status: Displays the open or closed status of major financial markets.
・Tokyo Market: Open from 9:00 AM to 3:00 PM (JST).
・London Market: Open from 16:00 to 24:00 during summer time and from 17:00 to 1:00 during winter time (JST).
・New York Market: Open from 21:00 to 5:00 during summer time and from 22:00 to 6:00 during winter time (JST).
Customizable Display:
・Background Color: The indicator allows you to set the background color for the clock display, while the leftmost empty cell can be independently customized with its own background color for table alignment.
・Clock and Market Status Colors: Separate color options are available for the clock text, market status during open, and market status during closed periods.
・Text Size: You can adjust the size of the text (small, normal, large) to fit your preferences.
・Table Position: You can position the digital clock and market status table in different locations on the chart: top left, top center, top right, bottom left, bottom center, and bottom right.
Alerts for Market Opening: The indicator will trigger alerts when a market (Tokyo, London, or New York) opens, notifying traders in real-time. This can help ensure that you don't miss any important market openings.
How to Use:
Setup:
Apply the Indicator: Add the Digital Clock with Market Status and Alerts indicator to your chart. Customize the time zone, text size, background colors, and table position based on your preferences.
Monitor Market Status: Watch the market status displayed for Tokyo, London, and New York to keep track of market openings and closings in real-time.
Receive Alerts: The indicator provides built-in alerts for market openings, helping you stay informed when a key market opens for trading.
Time Monitoring:
・Real-Time Clock: The current time is displayed with hours, minutes, and seconds for accurate tracking. The clock updates every second and reflects the selected time zone.
・Global Time Zones: Choose your desired time zone (Tokyo, New York, London, Sydney) to monitor the time most relevant to your trading strategy.
Market Status:
・Tokyo Market: The status will display "Tokyo OPEN" when the Tokyo market is active, and "Tokyo CLOSED" when it is outside of trading hours.
・London Market: Similarly, the indicator will show "London OPEN" or "London CLOSED" depending on whether the London market is currently active.
・New York Market: The New York market status follows the same structure, showing "NY OPEN" or "NY CLOSED."
Customization:
・Table Positioning: Easily move the table to the desired location on the chart to avoid overlap with other chart elements. The leftmost empty cell helps with alignment.
・Text and Background Color: Adjust the text and background colors to suit your personal preferences. You can also set independent colors for open and closed market statuses to easily distinguish between them.
Cautions and Disclaimer:
・Indicator Modifications: This indicator may be updated without prior notice, which could change or remove certain features.
・Trade Responsibility: This indicator is a tool to assist your trading, but responsibility for all trades remains with you. No guarantee of profit or success is implied, and losses can occur. Use it alongside your own analysis and strategy.
Digital Clock with Market Status and Alerts - 解説と使い方
概要:
Digital Clock with Market Status and Alerts インジケーターは、さまざまな世界のタイムゾーンで現在の時刻を表示し、東京、ロンドン、ニューヨークなどの主要な金融市場のステータスを提供します。このインジケーターにより、複数の市場のオープンおよびクローズ時間をリアルタイムで監視でき、市場がオープンする際にアラートを受け取ることができます。テーブルの位置、背景色、テキストカラー、フォントサイズなどのカスタマイズが可能です。
主な機能:
リアルタイムデジタル時計: 選択したタイムゾーン(東京、ニューヨーク、ロンドン、シドニー)の現在時刻を表示します。リアルタイムで更新され、時間、分、秒を正確に表示します。
世界の市場ステータス: 主要な金融市場のオープン/クローズ状況を表示します。
・東京市場: 午前9時~午後3時(日本時間)。
・ロンドン市場: 夏時間では16時~24時、冬時間では17時~1時(日本時間)。
・ニューヨーク市場: 夏時間では21時~5時、冬時間では22時~6時(日本時間)。
カスタマイズ可能な表示設定:
・背景色: 時計表示の背景色を設定できます。また、テーブルの左側に空白のセルを配置し、独立した背景色を設定することでテーブルの配置調整が可能です。
・時計と市場ステータスの色: 時計テキスト、オープン市場、クローズ市場の色を個別に設定できます。
・テキストサイズ: 小、標準、大から選択し、テキストサイズをカスタマイズ可能です。
・テーブル位置: デジタル時計と市場ステータスのテーブルをチャートのさまざまな場所(左上、中央上、右上、左下、中央下、右下)に配置できます。
市場オープン時のアラート: 市場(東京、ロンドン、ニューヨーク)がオープンするときにアラートを発し、リアルタイムで通知されます。これにより、重要な市場のオープン時間を逃さないようサポートします。
使い方:
セットアップ:
インジケーターを適用: チャートに「Digital Clock with Market Status and Alerts」インジケーターを追加し、タイムゾーン、テキストサイズ、背景色、テーブル位置を好みに応じてカスタマイズします。
市場ステータスを確認: 東京、ロンドン、ニューヨークの市場ステータスをリアルタイムで表示し、オープン/クローズ時間を把握できます。
アラートを受け取る: 市場オープン時のアラート機能により、重要な市場のオープンを見逃さないように通知が届きます。
時間管理:
・リアルタイム時計: 現在の時刻が秒単位で表示され、選択したタイムゾーンに基づいて正確に追跡できます。
・グローバルタイムゾーン: 東京、ニューヨーク、ロンドン、シドニーなど、トレードに関連するタイムゾーンを選択して監視できます。
市場ステータス:
・東京市場: 東京市場が開いていると「Tokyo OPEN」と表示され、閉じている場合は「Tokyo CLOSED」と表示されます。
・ロンドン市場: 同様に、「London OPEN」または「London CLOSED」が表示され、ロンドン市場のステータスを確認できます。
・ニューヨーク市場: ニューヨーク市場も「NY OPEN」または「NY CLOSED」で現在の状況が表示されます。
カスタマイズ:
・テーブル位置の調整: テーブルの位置を簡単に調整し、チャート上の他の要素と重ならないように配置できます。左側の空白セルで位置調整が可能です。
・テキストと背景色のカスタマイズ: テキストと背景の色を自分の好みに合わせて調整できます。また、オープン時とクローズ時の市場ステータスを区別するため、独立した色設定が可能です。
注意事項と免責事項:
・インジケーターの変更: このインジケーターは、予告なく変更や機能の削除が行われる場合があります。
・トレード責任: このインジケーターはトレードをサポートするツールであり、トレードに関する全責任はご自身にあります。利益を保証するものではなく、損失が発生する可能性があります。自分の分析や戦略と組み合わせて使用してください。

COMBINED EMA & SMA + DOUBLE DEMA, $TOTAL 1W / 5D -- Ruslan CRYPTOCAP:TOTAL
This Pine Script indicator, **"EMAS"**, provides an enhanced visualization of multiple types of moving averages, including both **Exponential Moving Averages (EMA)**, **Simple Moving Averages (SMA)**, and **Double Exponential Moving Averages (DEMA)**. It allows the user to observe the relationship between these different types of moving averages and apply regime-based coloring to price bars based on the comparison between the EMAs and DEMAs.
#### Key Features:
1. **EMA & SMA:**
- **EMA (Exponential Moving Average):** Calculated using a customizable lookback period (default 17), the EMA places greater weight on more recent prices, making it react faster to price changes.
- **SMA (Simple Moving Average):** Uses an equal-weighted average over a customizable lookback period (default 14), providing a slower-moving average compared to the EMA.
2. **DEMA (Double Exponential Moving Average):**
- Two separate DEMA lines are plotted using different lookback periods (default 2 and 14). The DEMA is a smoother and faster-responding version of the EMA, intended to reduce lag while retaining trend-following characteristics.
3. **Combined Signals:**
- The script calculates ratios between EMA/SMA (`comb`) and DEMA1/DEMA2 (`combd`) to generate a **regime-based bar coloring system**:
- If `combd > comb`: The bars are colored **green**, indicating that DEMAs are outperforming the EMAs, potentially signaling a stronger trend or momentum.
- If `comb > combd`: The bars are colored **red**, suggesting that the EMAs are dominant, which may indicate a different phase of the market.
4. **Signal SMA:**
- A 21-period **SMA** is plotted as a general trend-following signal. It provides a broader perspective on the current price trend, helping to smooth out short-term fluctuations.
5. **Customizable Options:**
- **"Show MAs?"**: The user has the option to toggle the display of the EMA, SMA, and DEMA lines on or off.
- **Custom Period Inputs**: Each type of moving average can have its period length customized via the input settings for better adaptability to different market conditions.
#### How to Use the Indicator:
- **Trend Following**:
The **EMA, SMA, and DEMA** values can help you determine the direction of the trend. When the EMA is above the SMA, it could indicate a stronger, more recent upward momentum. Similarly, DEMA comparisons provide smoother and faster trend signals.
- **Bar Coloring Regime**:
The **bar color** gives a quick visual cue of the regime:
- **Green bars** suggest that DEMAs are indicating stronger bullish or bearish signals compared to the EMAs.
- **Red bars** imply the opposite, where EMAs may be showing stronger signals, but possibly with more noise or lag.
- **Signal SMA**:
The **21-period SMA** line can be used as a simple trend indicator. When the price is above this line, it could signify an uptrend, while price movement below the line might indicate a downtrend.
#### Custom Inputs:
- **EMA Length**: Default is 17, but can be adjusted to fit your trading style.
- **SMA Length**: Default is 14.
- **DEMA Lengths**: Two customizable inputs for DEMA (default 2 and 14).
- **Source Selection**: You can choose which price source (close, open, high, low, etc.) to use for each calculation (default is the closing price).
#### Conclusion:
This indicator is useful for traders who wish to blend **trend-following strategies** (using EMA, SMA, and DEMA) with **visual regime indicators** (bar coloring). It is highly customizable, allowing traders to adjust settings based on their market approach. The combination of EMAs and DEMAs provides a nuanced view of price dynamics, potentially leading to better-informed trading decisions.
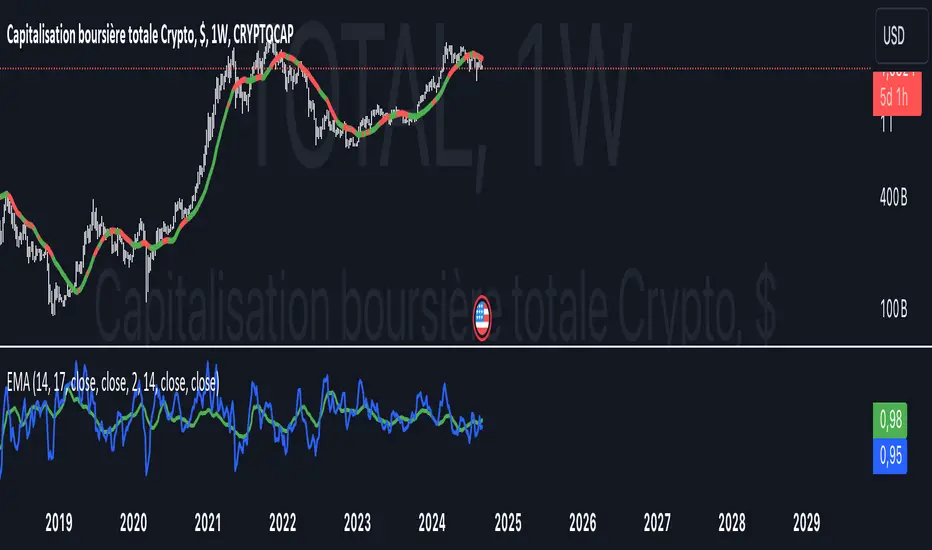
Drawing toolThis indicator is a simple drawing tool without changing the code!
You need:
1. activate the display of coordinates (Show coordinate input)
You will see a 17 by 17 table with indexes of intersection points, in the format: (x,y)
2. activate the Enable custom drawing input
3. enter the sequence of points that you want to connect into the Coordinate for drawing input in the format: (x,y);(x,y)....
4. select line color and fill color
5. if necessary, activate Curved and Closed
In addition, you can look at some examples
GG - LevelsThe GG Levels indicator is a tool designed for day trading U.S. equity futures. It highlights key levels intraday, overnight, intermediate-swing levels that are relevant for intraday futures trading.
Terminology
RTH (Regular Trading Hours): Represents the New York session from 09:30 to 17:00 EST.
ON Session (Overnight Session): Represents the trading activity from 17:00 to 09:29 EST.
IB (Initial Balance): The first hour of the New York session, from 09:30 to 10:30 EST.
Open: The opening price of the RTH session.
YH (Yesterday's High): The highest price during the RTH session of the previous day.
YL (Yesterday's Low): The lowest price during the RTH session of the previous day.
YC (Yesterday's Close): The daily bar close which for futures gets updated to settlement.
IBH (Initial Balance High): The highest price during the IB session.
IBL (Initial Balance Low): The lowest price during the IB session.
ONH (Overnight High): The highest price during the ON session.
ONL (Overnight Low): The lowest price during the ON session.
VWAP (Volume-Weighted Average Price): The volume-weighted average price that resets each day.
Why is RTH Important?
Tracking the RTH session is important because often times the overnight session can be filled with "lies". It is thought that because the overnight session is lower volume price can be pushed or "manipulated" to extremes that would not happen during higher volume times.
Why is the ON Session Important Then?
Just because the ON session can be thought as a "lie" doesn't mean it is relevant to know. For example, if price is stuck inside the ON range then you can think of the market as rotational or range-bound. If price is above the ON range then it can be thought of as bullish. If price is below the ON range then it can be thought as bearish.
What is IB?
IB or initial balance is the first hour of the New York Session. Typically the market sets the tone for the day in the first hour. This tone is similarly a map like the ON session. If we are above the IBH then it is bullish and likely a trend day to the upside. If we are below the IBL then it is bearish and likely a trend day to the downside. If we are in IB then we want to avoid conducting business in the middle of IBH and IBL to avoid getting chopped up in a range bound market.
These levels are not a holy grail
You should use this indicator as guide or map for context about the instrument you are trading. You need to combine your own technical analysis with this indicator. You want as much context confirming your trade thesis in order to enter a trade. Simply buying or selling because we are above or below a level is not recommended in any circumstance. If it were that easy I would not publish this indicator.
Adjustments
In the indicator settings you can adjust the RTH, ON, and IB session-time settings. All of the times entered must be in EST (Eastern Standard Time). You may want to do this to apply the levels to a foreign market.
Examples
