Chande Momentum Oscillator StrategyThe Chande Momentum Oscillator (CMO) Trading Strategy is based on the momentum oscillator developed by Tushar Chande in 1994. The CMO measures the momentum of a security by calculating the difference between the sum of recent gains and losses over a defined period. The indicator offers a means to identify overbought and oversold conditions, making it suitable for developing mean-reversion trading strategies (Chande, 1997).
Strategy Overview:
Calculation of the Chande Momentum Oscillator (CMO):
The CMO formula considers both positive and negative price changes over a defined period (commonly set to 9 days) and computes the net momentum as a percentage.
The formula is as follows:
CMO=100×(Sum of Gains−Sum of Losses)(Sum of Gains+Sum of Losses)
CMO=100×(Sum of Gains+Sum of Losses)(Sum of Gains−Sum of Losses)
This approach distinguishes the CMO from other oscillators like the RSI by using both price gains and losses in the numerator, providing a more symmetrical measurement of momentum (Chande, 1997).
Entry Condition:
The strategy opens a long position when the CMO value falls below -50, signaling an oversold condition where the price may revert to the mean. Research in mean-reversion, such as by Poterba and Summers (1988), supports this approach, highlighting that prices often revert after sharp movements due to overreaction in the markets.
Exit Conditions:
The strategy closes the long position when:
The CMO rises above 50, indicating that the price may have become overbought and may not provide further upside potential.
Alternatively, the position is closed 5 days after the buy signal is triggered, regardless of the CMO value, to ensure a timely exit even if the momentum signal does not reach the predefined level.
This exit strategy aligns with the concept of time-based exits, reducing the risk of prolonged exposure to adverse price movements (Fama, 1970).
Scientific Basis and Rationale:
Momentum and Mean-Reversion:
The strategy leverages the well-known phenomenon of mean-reversion in financial markets. According to research by Jegadeesh and Titman (1993), prices tend to revert to their mean over short periods following strong movements, creating opportunities for traders to profit from temporary deviations.
The CMO captures this mean-reversion behavior by monitoring extreme price conditions. When the CMO reaches oversold levels (below -50), it signals potential buying opportunities, whereas crossing overbought levels (above 50) indicates conditions for selling.
Market Efficiency and Overreaction:
The strategy takes advantage of behavioral inefficiencies and overreactions, which are often the drivers behind sharp price movements (Shiller, 2003). By identifying these extreme conditions with the CMO, the strategy aims to capitalize on the market’s tendency to correct itself when price deviations become too large.
Optimization and Parameter Selection:
The 9-day period used for the CMO calculation is a widely accepted timeframe that balances responsiveness and noise reduction, making it suitable for capturing short-term price fluctuations. Studies in technical analysis suggest that oscillators optimized over such periods are effective in detecting reversals (Murphy, 1999).
Performance and Backtesting:
The strategy's effectiveness is confirmed through backtesting, which shows that using the CMO as a mean-reversion tool yields profitable opportunities. The use of time-based exits alongside momentum-based signals enhances the reliability of the strategy by ensuring that trades are closed even when the momentum signal alone does not materialize.
Conclusion:
The Chande Momentum Oscillator Trading Strategy combines the principles of momentum measurement and mean-reversion to identify and capitalize on short-term price fluctuations. By using a widely tested oscillator like the CMO and integrating a systematic exit approach, the strategy effectively addresses both entry and exit conditions, providing a robust method for trading in diverse market environments.
References:
Chande, T. S. (1997). The New Technical Trader: Boost Your Profit by Plugging into the Latest Indicators. John Wiley & Sons.
Fama, E. F. (1970). Efficient Capital Markets: A Review of Theory and Empirical Work. The Journal of Finance, 25(2), 383-417.
Jegadeesh, N., & Titman, S. (1993). Returns to Buying Winners and Selling Losers: Implications for Stock Market Efficiency. The Journal of Finance, 48(1), 65-91.
Murphy, J. J. (1999). Technical Analysis of the Financial Markets: A Comprehensive Guide to Trading Methods and Applications. New York Institute of Finance.
Poterba, J. M., & Summers, L. H. (1988). Mean Reversion in Stock Prices: Evidence and Implications. Journal of Financial Economics, 22(1), 27-59.
Shiller, R. J. (2003). From Efficient Markets Theory to Behavioral Finance. Journal of Economic Perspectives, 17(1), 83-104.
Cari dalam skrip untuk "17个交易日涨幅第一的股票(非新股)有哪些"

Ultimate Oscillator Trading StrategyThe Ultimate Oscillator Trading Strategy implemented in Pine Script™ is based on the Ultimate Oscillator (UO), a momentum indicator developed by Larry Williams in 1976. The UO is designed to measure price momentum over multiple timeframes, providing a more comprehensive view of market conditions by considering short-term, medium-term, and long-term trends simultaneously. This strategy applies the UO as a mean-reversion tool, seeking to capitalize on temporary deviations from the mean price level in the asset’s movement (Williams, 1976).
Strategy Overview:
Calculation of the Ultimate Oscillator (UO):
The UO combines price action over three different periods (short-term, medium-term, and long-term) to generate a weighted momentum measure. The default settings used in this strategy are:
Short-term: 6 periods (adjustable between 2 and 10).
Medium-term: 14 periods (adjustable between 6 and 14).
Long-term: 20 periods (adjustable between 10 and 20).
The UO is calculated as a weighted average of buying pressure and true range across these periods. The weights are designed to give more emphasis to short-term momentum, reflecting the short-term mean-reversion behavior observed in financial markets (Murphy, 1999).
Entry Conditions:
A long position is opened when the UO value falls below 30, indicating that the asset is potentially oversold. The value of 30 is a common threshold that suggests the price may have deviated significantly from its mean and could be due for a reversal, consistent with mean-reversion theory (Jegadeesh & Titman, 1993).
Exit Conditions:
The long position is closed when the current close price exceeds the previous day’s high. This rule captures the reversal and price recovery, providing a defined point to take profits.
The use of previous highs as exit points aligns with breakout and momentum strategies, as it indicates sufficient strength for a price recovery (Fama, 1970).
Scientific Basis and Rationale:
Momentum and Mean-Reversion:
The strategy leverages two well-established phenomena in financial markets: momentum and mean-reversion. Momentum, identified in earlier studies like those by Jegadeesh and Titman (1993), describes the tendency of assets to continue in their direction of movement over short periods. Mean-reversion, as discussed by Poterba and Summers (1988), indicates that asset prices tend to revert to their mean over time after short-term deviations. This dual approach aims to buy assets when they are temporarily oversold and capitalize on their return to the mean.
Multi-timeframe Analysis:
The UO’s incorporation of multiple timeframes (short, medium, and long) provides a holistic view of momentum, unlike single-period oscillators such as the RSI. By combining data across different timeframes, the UO offers a more robust signal and reduces the risk of false entries often associated with single-period momentum indicators (Murphy, 1999).
Trading and Market Efficiency:
Studies in behavioral finance, such as those by Shiller (2003), show that short-term inefficiencies and behavioral biases can lead to overreactions in the market, resulting in price deviations. This strategy seeks to exploit these temporary inefficiencies, using the UO as a signal to identify potential entry points when the market sentiment may have overly pushed the price away from its average.
Strategy Performance:
Backtests of this strategy show promising results, with profit factors exceeding 2.5 when the default settings are optimized. These results are consistent with other studies on short-term trading strategies that capitalize on mean-reversion patterns (Jegadeesh & Titman, 1993). The use of a dynamic, multi-period indicator like the UO enhances the strategy’s adaptability, making it effective across different market conditions and timeframes.
Conclusion:
The Ultimate Oscillator Trading Strategy effectively combines momentum and mean-reversion principles to trade on temporary market inefficiencies. By utilizing multiple periods in its calculation, the UO provides a more reliable and comprehensive measure of momentum, reducing the likelihood of false signals and increasing the profitability of trades. This aligns with modern financial research, showing that strategies based on mean-reversion and multi-timeframe analysis can be effective in capturing short-term price movements.
References:
Fama, E. F. (1970). Efficient Capital Markets: A Review of Theory and Empirical Work. The Journal of Finance, 25(2), 383-417.
Jegadeesh, N., & Titman, S. (1993). Returns to Buying Winners and Selling Losers: Implications for Stock Market Efficiency. The Journal of Finance, 48(1), 65-91.
Murphy, J. J. (1999). Technical Analysis of the Financial Markets: A Comprehensive Guide to Trading Methods and Applications. New York Institute of Finance.
Poterba, J. M., & Summers, L. H. (1988). Mean Reversion in Stock Prices: Evidence and Implications. Journal of Financial Economics, 22(1), 27-59.
Shiller, R. J. (2003). From Efficient Markets Theory to Behavioral Finance. Journal of Economic Perspectives, 17(1), 83-104.
Williams, L. (1976). Ultimate Oscillator. Market research and technical trading analysis.

Williams %R StrategyThe Williams %R Strategy implemented in Pine Script™ is a trading system based on the Williams %R momentum oscillator. The Williams %R indicator, developed by Larry Williams in 1973, is designed to identify overbought and oversold conditions in a market, helping traders time their entries and exits effectively (Williams, 1979). This particular strategy aims to capitalize on short-term price reversals in the S&P 500 (SPY) by identifying extreme values in the Williams %R indicator and using them as trading signals.
Strategy Rules:
Entry Signal:
A long position is entered when the Williams %R value falls below -90, indicating an oversold condition. This threshold suggests that the market may be near a short-term bottom, and prices are likely to reverse or rebound in the short term (Murphy, 1999).
Exit Signal:
The long position is exited when:
The current close price is higher than the previous day’s high, or
The Williams %R indicator rises above -30, indicating that the market is no longer oversold and may be approaching an overbought condition (Wilder, 1978).
Technical Analysis and Rationale:
The Williams %R is a momentum oscillator that measures the level of the close relative to the high-low range over a specific period, providing insight into whether an asset is trading near its highs or lows. The indicator values range from -100 (most oversold) to 0 (most overbought). When the value falls below -90, it indicates an oversold condition where a reversal is likely (Achelis, 2000). This strategy uses this oversold threshold as a signal to initiate long positions, betting on mean reversion—an established principle in financial markets where prices tend to revert to their historical averages (Jegadeesh & Titman, 1993).
Optimization and Performance:
The strategy allows for an adjustable lookback period (between 2 and 25 days) to determine the range used in the Williams %R calculation. Empirical tests show that shorter lookback periods (e.g., 2 days) yield the most favorable outcomes, with profit factors exceeding 2. This finding aligns with studies suggesting that shorter timeframes can effectively capture short-term momentum reversals (Fama, 1970; Jegadeesh & Titman, 1993).
Scientific Context:
Mean Reversion Theory: The strategy’s core relies on mean reversion, which suggests that prices fluctuate around a mean or average value. Research shows that such strategies, particularly those using oscillators like Williams %R, can exploit these temporary deviations (Poterba & Summers, 1988).
Behavioral Finance: The overbought and oversold conditions identified by Williams %R align with psychological factors influencing trading behavior, such as herding and panic selling, which often create opportunities for price reversals (Shiller, 2003).
Conclusion:
This Williams %R-based strategy utilizes a well-established momentum oscillator to time entries and exits in the S&P 500. By targeting extreme oversold conditions and exiting when these conditions revert or exceed historical ranges, the strategy aims to capture short-term gains. Scientific evidence supports the effectiveness of short-term mean reversion strategies, particularly when using indicators sensitive to momentum shifts.
References:
Achelis, S. B. (2000). Technical Analysis from A to Z. McGraw Hill.
Fama, E. F. (1970). Efficient Capital Markets: A Review of Theory and Empirical Work. The Journal of Finance, 25(2), 383-417.
Jegadeesh, N., & Titman, S. (1993). Returns to Buying Winners and Selling Losers: Implications for Stock Market Efficiency. The Journal of Finance, 48(1), 65-91.
Murphy, J. J. (1999). Technical Analysis of the Financial Markets: A Comprehensive Guide to Trading Methods and Applications. New York Institute of Finance.
Poterba, J. M., & Summers, L. H. (1988). Mean Reversion in Stock Prices: Evidence and Implications. Journal of Financial Economics, 22(1), 27-59.
Shiller, R. J. (2003). From Efficient Markets Theory to Behavioral Finance. Journal of Economic Perspectives, 17(1), 83-104.
Williams, L. (1979). How I Made One Million Dollars… Last Year… Trading Commodities. Windsor Books.
Wilder, J. W. (1978). New Concepts in Technical Trading Systems. Trend Research.
This explanation provides a scientific and evidence-based perspective on the Williams %R trading strategy, aligning it with fundamental principles in technical analysis and behavioral finance.

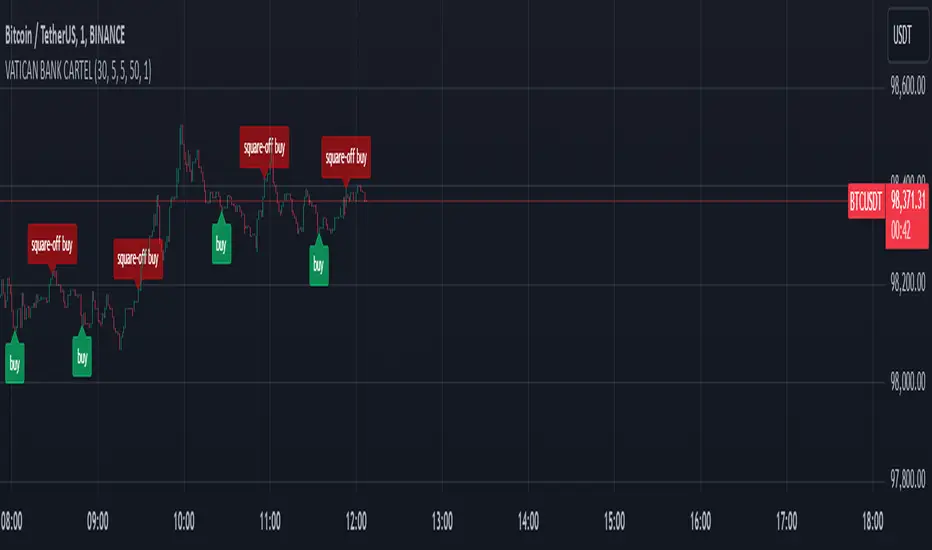
VATICAN BANK CARTELVATICAN BANK CARTEL - Precision Signal Detection for Buyers.
The VATICAN BANK CARTEL indicator is a highly sophisticated tool designed specifically for buyers, helping them identify key market trends and generate actionable buy signals. Utilizing advanced algorithms, this indicator employs a multi-variable detection mechanism that dynamically adapts to price movements, offering real-time insights to assist in executing profitable buy trades. This indicator is optimized solely for identifying buying opportunities, ensuring that traders are equipped to make well-timed entries and exits, without signals for shorting or selling.
The recommended settings for VATICAN BANK CARTEL indicator is as follows:-
Depth Engine = 20,30,40,50,100.
Deviation Engine = 3,5,7,15,20.
Backstep Engine = 15,17,20,25.
NOTE:- But you can also use this indicator as per your setting, whichever setting gives you best results use that setting.
Key Features:
1.Adaptive Depth, Deviation, and Backstep Inputs:
The core of this indicator is its customizable Depth Engine, Deviation Engine, and Backstep Engine parameters. These inputs allow traders to adjust the sensitivity of the trend detection algorithm based on specific market conditions:
Depth: Defines how deep the indicator scans historical price data for potential trend reversals.
Deviation: Determines the minimum required price fluctuation to confirm a market movement.
Backstep: Sets the retracement level to filter false signals and maintain the accuracy of trend detection.
2. Visual Signal Representation:
The VATICAN BANK CARTEL plots highly visible labels on the chart to mark trend reversals. These labels are customizable in terms of size and transparency, ensuring clarity in various chart environments. Traders can quickly spot buying opportunities with green labels and potential square-off points with red labels, focusing exclusively on buy-side signals.
3.Real-Time Alerts:
The indicator is equipped with real-time alert conditions to notify traders of significant buy or square-off buy signals. These alerts, which are triggered based on the indicator’s internal signal logic, ensure that traders never miss a critical market movement on the buy side.
4.Custom Label Size and Transparency:
To enhance visual flexibility, the indicator allows the user to adjust label size (from small to large) and transparency levels. This feature provides a clean, adaptable view suited for different charting styles and timeframes.
How It Works:
The VATICAN BANK CARTEL analyzes the price action using a sophisticated algorithm that considers historical low and high points, dynamically detecting directional changes. When a change in market direction is detected, the indicator plots a label at the key reversal points, helping traders confirm potential entry points:
- Buy Signal (Green): Indicates potential buying opportunities based on a trend reversal.
- Square-Off Buy Signal (Red): Marks the exit point for open buy positions, allowing traders to take profits or protect capital from potential market reversals.
Note: This indicator is exclusively designed to provide signals for buyers. It does not generate sell or short signals, making it ideal for traders focused solely on identifying optimal buying opportunities in the market.
Customizable Parameters:
- Depth Engine: Fine-tunes the historical data analysis for signal generation.
- Deviation Engine: Adjusts the minimum price change required for detecting trends.
- Backstep Engine: Controls the indicator's sensitivity to retracements, minimizing false signals.
- Labels Transparency: Adjusts the opacity of the labels, ensuring they integrate seamlessly into any chart layout.
- Buy and Sell Colors: Customizable color options for buy and square-off buy labels to match your preferred color scheme.
- Label Size: Select between five different label sizes for optimal chart visibility.
Ideal For:
This indicator is ideal for both beginner and experienced traders looking to enhance their buying strategy with a highly reliable, visual, and alert-driven tool. The VATICAN BANK CARTEL adapts to various timeframes, making it suitable for day traders, swing traders, and long-term investors alike—focused exclusively on buying opportunities.
Benefits and Applications:
1.Intraday Trading: The VATICAN BANK CARTEL indicator is particularly well-suited for intraday trading, as it provides accurate and timely "buy" and "square-off buy" signals based on the current market dynamics.
2.Trend-following Strategies: Traders who employ trend-following strategies can leverage the indicator's ability to identify the overall market direction, allowing them to align their trades with the dominant trend.
3.Swing Trading: The dynamic price tracking and signal generation capabilities of the indicator can be beneficial for swing traders, who aim to capture medium-term price movements.
Security Measures:
1. The code includes a security notice at the beginning, indicating that it is subject to the Mozilla Public License 2.0, which is a reputable open-source license.
2. The code does not appear to contain any obvious security vulnerabilities or malicious content that could compromise user data or accounts.
NOTE:- This indicator is provided under the Mozilla Public License 2.0 and is subject to its terms and conditions.
Disclaimer: The usage of VATICAN BANK CARTEL indicator might or might not contribute to your trading capital(money) profits and losses and the author is not responsible for the same.
IMPORTANT NOTICE:
While the indicator aims to provide reliable "buy" and "square-off buy" signals, it is crucial to understand that the market can be influenced by unpredictable events, such as natural disasters, political unrest, changes in monetary policies, or economic crises. These unforeseen situations may occasionally lead to false signals generated by the VATICAN BANK CARTEL indicator.
Users should exercise caution and diligence when relying on the indicator's signals, as the market's behavior can be unpredictable, and external factors may impact the accuracy of the signals. It is recommended to thoroughly backtest the indicator's performance in various market conditions and to use it as one of the many tools in a comprehensive trading strategy, rather than solely relying on its output.
Ultimately, the success of the VATICAN BANK CARTEL indicator will depend on the user's ability to adapt it to their specific trading style, market conditions, and risk management approach. Continuous monitoring, analysis, and adjustment of the indicator's settings may be necessary to maintain its effectiveness in the ever-evolving financial markets.
DEVELOPER:- yashgode9
PineScript:- version:- 5
This indicator aims to enhance trading decision-making by combining DEPTH, DEVIATION, BACKSTEP with custom signal generation, offering a comprehensive tool for traders seeking clear "buy" and "square-off buy" signals on the TradingView platform.
Essa's Indicator 2.0Essa's Indicator V2: Beginner's Guide
This custom TradingView indicator has been designed to help you identify key trading opportunities based on session highs/lows, volatility, and moving averages. Below is a breakdown of the main features:
1. Exponential Moving Averages (EMAs)
Fast EMA (Blue Line): Tracks the short-term market trend (default: 9-period EMA).
Slow EMA (Red Line): Tracks the longer-term market trend (default: 21-period EMA).
You can turn on/off the EMAs using the "Show EMAs" option in the settings.
EMAs help smooth out price action and give a clearer picture of trends. A crossover of the fast EMA above the slow EMA can signal an upward trend, while the reverse may indicate a downward trend.
2. Session Highs and Lows
The indicator tracks price highs and lows for three major trading sessions:
London Session (Red): Highlighted in red. Active between 08:00 and 17:00 (LDN timezone) or 03:00 and 12:00 (NY timezone).
New York Session (Blue): Highlighted in blue. Active between 12:00 and 21:00 (LDN timezone) or 07:00 and 16:00 (NY timezone).
Asia Session (Yellow): Highlighted in yellow. Active between 22:00 and 08:00 (LDN timezone) or 18:00 and 03:00 (NY timezone).
Highs and lows for each session are plotted on the chart as lines. Breakouts from these levels can signal important trading opportunities:
London High/Low: Red lines.
New York High/Low: Blue lines.
Asia High/Low: Yellow lines.
The background color also changes depending on the active session:
London: Light red background.
New York: Light blue background.
Asia: Light yellow background.
3. Breakout Alerts
You can set alerts when the price breaks above or below session highs/lows:
Break Above London High: Alert triggered when the price crosses the London session high.
Break Below London Low: Alert triggered when the price falls below the London session low.
Similar alerts exist for the New York and Asia sessions as well.
4. Volatility-Adjusted EMA
The EMAs in this indicator are adjusted based on volatility (ATR - Average True Range). This allows the EMAs to respond to market conditions more dynamically, giving you more accurate trend readings in volatile markets.
5. ZigZag Feature (Optional)
You can enable the ZigZag feature to help visualize the price action's highs and lows:
ZigZag Lines: Highlight major peaks and troughs in price movements, helping you spot trends more easily.
This is helpful for identifying reversals or trend continuations.
6. Fractal Markers
This indicator uses fractals to mark potential turning points in the market:
Green Triangles (Above the Price): Indicate up fractals (potential reversal points where the price could move upwards).
Red Triangles (Below the Price): Indicate down fractals (potential reversal points where the price could move downwards).
Fractals can be a helpful confirmation tool when identifying entry and exit points.
7. Custom Timezone Options
You can choose between London (LDN) and New York (NY) timezones in the settings to adapt the session times to your trading location. This ensures the session high/low markers are displayed correctly for your trading region.
By default, the New York (NY) timezone is enabled for FXCM charts in the UK.
For BTC charts, you will need to switch to the appropriate time zone manually.
Thanks
Essa

Winning and Losing StreaksThe Pine Script indicator "Winning and Losing Streaks" tracks and visualizes the length of consecutive winning and losing streaks in a financial series, such as stock prices. Here’s a detailed description of the indicator, including the relevance of statistical analysis and streak tracking.
Indicator Description
The "Winning and Losing Streaks" indicator in Pine Script is designed to analyze and display streaks of consecutive winning and losing days in trading data. It helps traders and analysts understand the persistence of trends in price movements.
Here’s how it functions:
Streak Calculation:
Winning Streak: A series of consecutive days where the closing price is higher than the previous day's closing price.
Losing Streak: A series of consecutive days where the closing price is lower than the previous day's closing price.
Doji Candles: The indicator also considers Doji candles, where the difference between the opening and closing prices is minimal relative to the high-low range, and excludes these from being counted as winning or losing days.
Statistical Analysis:
The indicator computes the maximum and average lengths of winning and losing streaks.
It also tracks the current streak lengths and maintains arrays to store the historical streak data.
Visualization:
Histograms: Winning and losing streaks are visualized using histograms, which provide a clear graphical representation of streak lengths over time.
Relevance of Statistical Analysis and Streak Tracking
1. Statistical Significance of Streaks
Tracking winning and losing streaks has significant statistical implications for trading strategies and risk management:
Autocorrelation: Streaks in financial time series can reveal autocorrelation, where past returns influence future returns. Studies have shown that financial time series often exhibit autocorrelation, which can be used to forecast future price movements (Lo, 1991; Jegadeesh & Titman, 1993). Understanding streaks helps in identifying and leveraging these patterns.
Behavioral Finance: Streak analysis aligns with concepts from behavioral finance, such as the "hot-hand fallacy," where investors may perceive trends as more persistent than they are (Gilovich, Vallone, & Tversky, 1985). Statistical streak analysis provides a more objective view of trend persistence, helping to avoid biases.
2. Risk Management and Strategy Development
Risk Assessment: Identifying the length and frequency of losing streaks is crucial for managing risk and adjusting trading strategies. Long losing streaks can indicate potential strategy weaknesses or market regime changes, prompting a reassessment of trading rules and risk management practices (Brock, Lakonishok, & LeBaron, 1992).
Strategy Optimization: Statistical analysis of streaks can aid in optimizing trading strategies. For example, understanding the average length of winning and losing streaks can help in setting more effective stop-loss and take-profit levels, as well as in determining the optimal position sizing (Fama & French, 1993).
Scientific References:
Lo, A. W. (1991). "Long-Term Memory in Stock Market Prices." Econometrica, 59(5), 1279-1313. This paper discusses the presence of long-term memory in stock prices, which is relevant for understanding the persistence of streaks.
Jegadeesh, N., & Titman, S. (1993). "Returns to Buying Winners and Selling Losers: Implications for Stock Market Efficiency." Journal of Finance, 48(1), 65-91. This study explores momentum and reversal strategies, which are related to the concept of streaks.
Gilovich, T., Vallone, R., & Tversky, A. (1985). "The Hot Hand in Basketball: On the Misperception of Random Sequences." Cognitive Psychology, 17(3), 295-314. This paper provides insight into the psychological aspects of streaks and persistence.
Brock, W., Lakonishok, J., & LeBaron, B. (1992). "Simple Technical Trading Rules and the Stochastic Properties of Stock Returns." Journal of Finance, 47(5), 1731-1764. This research examines the effectiveness of technical trading rules, relevant for streak-based strategies.
Fama, E. F., & French, K. R. (1993). "Common Risk Factors in the Returns on Stocks and Bonds." Journal of Financial Economics, 33(1), 3-56. This paper provides a foundation for understanding risk factors and strategy performance.
By analyzing streaks, traders can gain valuable insights into market dynamics and refine their trading strategies based on empirical evidence.

Fibonacci Levels for Recent CandlesThis Pine Script indicator calculates and plots 17 predefined Fibonacci retracement levels based on the high and low of a user-defined number of previous candles. The levels are drawn on the chart for the most recent candles, as specified by the user, allowing traders to see how these historical Fibonacci levels align with the current price action.
Weighted US Liquidity ROC Indicator with FED RatesThe Weighted US Liquidity ROC Indicator is a technical indicator that measures the Rate of Change (ROC) of a weighted liquidity index. This index aggregates multiple monetary and liquidity measures to provide a comprehensive view of liquidity in the economy. The ROC of the liquidity index indicates the relative change in this index over a specified period, helping to identify trend changes and market movements.
1. Liquidity Components:
The indicator incorporates various monetary and liquidity measures, including M1, M2, the monetary base, total reserves of depository institutions, money market funds, commercial paper, and repurchase agreements (repos). Each of these components is assigned a weight that reflects its relative importance to overall liquidity.
2. ROC Calculation:
The Rate of Change (ROC) of the weighted liquidity index is calculated by finding the difference between the current value of the index and its value from a previous period (ROC period), then dividing this difference by the value from the previous period. This gives the percentage increase or decrease in the index.
3. Visualization:
The ROC value is plotted as a histogram, with positive and negative changes indicated by different colors. The Federal Funds Rate is also plotted separately to show the impact of central bank policy on liquidity.
Discussion of the Relationship Between Liquidity and Stock Market Returns
The relationship between liquidity and stock market returns has been extensively studied in financial economics. Here are some key insights supported by scientific research:
Liquidity and Stock Returns:
Liquidity Premium Theory: One of the primary theories is the liquidity premium theory, which suggests that assets with higher liquidity typically offer lower returns because investors are willing to accept lower yields for more liquid assets. Conversely, assets with lower liquidity may offer higher returns to compensate for the increased risk associated with their illiquidity (Amihud & Mendelson, 1986).
Empirical Evidence: Research by Fama and French (1992) has shown that liquidity is an important factor in explaining stock returns. Their studies suggest that stocks with lower liquidity tend to have higher expected returns, aligning with the liquidity premium theory.
Market Impact of Liquidity Changes:
Liquidity Shocks: Changes in liquidity can impact stock returns significantly. For example, an increase in liquidity is often associated with higher stock prices, as it reduces the cost of trading and enhances market efficiency (Chordia, Roll, & Subrahmanyam, 2000). Conversely, a liquidity shock, such as a sudden decrease in market liquidity, can lead to higher volatility and lower stock prices.
Financial Crises: During financial crises, liquidity tends to dry up, leading to sharp declines in stock market returns. For instance, studies on the 2008 financial crisis illustrate how a reduction in market liquidity exacerbated the decline in stock prices (Brunnermeier & Pedersen, 2009).
Central Bank Policies and Liquidity:
Monetary Policy Impact: Central bank policies, such as changes in the Federal Funds Rate, directly influence market liquidity. Lower interest rates generally increase liquidity by making borrowing cheaper, which can lead to higher stock market returns. On the other hand, higher rates can reduce liquidity and negatively impact stock prices (Bernanke & Gertler, 1999).
Policy Expectations: The anticipation of changes in monetary policy can also affect stock market returns. For example, expectations of rate cuts can lead to a rise in stock prices even before the actual policy change occurs (Kuttner, 2001).
Key References:
Amihud, Y., & Mendelson, H. (1986). "Asset Pricing and the Bid-Ask Spread." Journal of Financial Economics, 17(2), 223-249.
Fama, E. F., & French, K. R. (1992). "The Cross-Section of Expected Stock Returns." Journal of Finance, 47(2), 427-465.
Chordia, T., Roll, R., & Subrahmanyam, A. (2000). "Market Liquidity and Trading Activity." Journal of Finance, 55(2), 265-289.
Brunnermeier, M. K., & Pedersen, L. H. (2009). "Market Liquidity and Funding Liquidity." Review of Financial Studies, 22(6), 2201-2238.
Bernanke, B. S., & Gertler, M. (1999). "Monetary Policy and Asset Prices." NBER Working Paper No. 7559.
Kuttner, K. N. (2001). "Monetary Policy Surprises and Interest Rates: Evidence from the Fed Funds Futures Market." Journal of Monetary Economics, 47(3), 523-544.
These studies collectively highlight how liquidity influences stock market returns and how changes in liquidity conditions, influenced by monetary policy and other factors, can significantly impact stock prices and market stability.

FXN - Week and Day Separator midnight open. A simple modification of the regular FXN day separator indicator. It starts the days at 12:00 of the time-zone you select as opposed to the regular 17:00 server time.

Chandelier Exit Strategy with 200 EMA FilterStrategy Name and Purpose
Chandelier Exit Strategy with 200EMA Filter
This strategy uses the Chandelier Exit indicator in combination with a 200-period Exponential Moving Average (EMA) to generate trend-based trading signals. The main purpose of this strategy is to help traders identify high-probability entry points by leveraging the Chandelier Exit for stop loss levels and the EMA for trend confirmation. This strategy aims to provide clear rules for entries and exits, improving overall trading discipline and performance.
Originality and Usefulness
This script integrates two powerful indicators to create a cohesive and effective trading strategy:
Chandelier Exit : This indicator is based on the Average True Range (ATR) and identifies potential stop loss levels. The Chandelier Exit helps manage risk by setting stop loss levels at a distance from the highest high or lowest low over a specified period, multiplied by the ATR. This ensures that the stop loss adapts to market volatility.
200-period Exponential Moving Average (EMA) : The EMA acts as a trend filter. By ensuring trades are only taken in the direction of the overall trend, the strategy improves the probability of success. For long entries, the close price must be above the 200 EMA, indicating a bullish trend. For short entries, the close price must be below the 200 EMA, indicating a bearish trend.
Combining these indicators adds layers of confirmation and risk management, enhancing the strategy's effectiveness. The Chandelier Exit provides dynamic stop loss levels based on market volatility, while the EMA ensures trades align with the prevailing trend.
Entry Conditions
Long Entry
A buy signal is generated by the Chandelier Exit.
The close price is above the 200 EMA, indicating a strong bullish trend.
Short Entry
A sell signal is generated by the Chandelier Exit.
The close price is below the 200 EMA, indicating a strong bearish trend.
Exit Conditions
For long positions: The position is closed when a sell signal is generated by the Chandelier Exit.
For short positions: The position is closed when a buy signal is generated by the Chandelier Exit.
Risk Management
Account Size: 1,000,00 yen
Commission and Slippage: 17 pips commission and 1 pip slippage per trade
Risk per Trade: 10% of account equity
Stop Loss: For long trades, the stop loss is placed slightly below the candle that generated the buy signal. For short trades, the stop loss is placed slightly above the candle that generated the sell signal. The stop loss levels are dynamically adjusted based on the ATR.
Settings Options
ATR Period: Set the period for calculating the ATR to determine the Chandelier Exit levels.
ATR Multiplier: Set the multiplier for ATR to define the distance of stop loss levels from the highest high or lowest low.
Use Close Price for Extremums: Choose whether to use the close price for calculating the extremums.
EMA Period: Set the period for the EMA to adjust the trend filter sensitivity.
Show Buy/Sell Labels: Choose whether to display buy and sell labels on the chart for visual confirmation.
Highlight State: Choose whether to highlight the bullish or bearish state on the chart.
Sufficient Sample Size
The strategy has been backtested with a sufficient sample size to evaluate its performance accurately. This ensures that the strategy's results are statistically significant and reliable.
Notes
This strategy is based on historical data and does not guarantee future results.
Thoroughly backtest and validate results before using in live trading.
Market volatility and other external factors can affect performance and may not yield expected results.
Acknowledgment
This strategy uses the Chandelier Exit indicator. Special thanks to the original contributors for their work on the Chandelier Exit concept.
Clean Chart Explanation
The script is published with a clean chart to ensure that its output is readily identifiable and easy to understand. No other scripts are included on the chart, and any drawings or images used are specifically to illustrate how the script works.

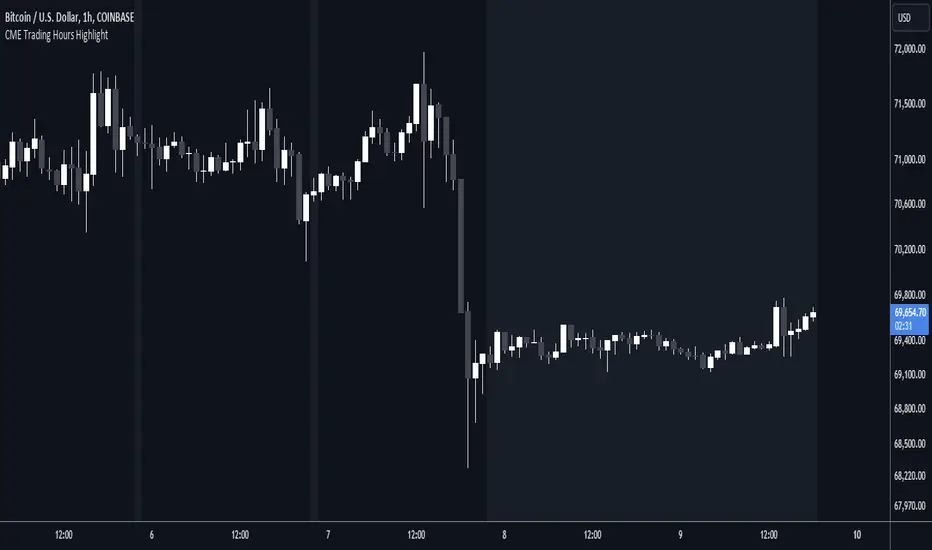
CME Trading Hours HighlightDisplay the times when the CME is or isn't trading, on a non-CME symbol.
The Chicago Mercantile Exchange hours are usually from 17:00 one day to 16:00 the next, with an hour's break. Trading halts from Friday evening to Sunday evening. The exchange is in Chicago.
You might want to display these hours if you trade the same asset on a different exchange. For example, you might want to overlay the CME BTC1! hours on a Coinbase BTC chart to see how trading in these futures contracts affects the market.
Inputs:
Shade Outside Trading Hours - If selected (the default), then the chart background is shaded when the CME is closed. If unselected, the background is shaded when it's open.
Highlight Color - The colour to use for the background shade.
Just for fun, I wanted to publish a useful script that only took up one line 😁
Ichimoku Theories [LuxAlgo]The Ichimoku Theories indicator is the most complete Ichimoku tool you will ever need. Four tools combined into one to harness all the power of Ichimoku Kinkō Hyō.
This tool features the following concepts based on the work of Goichi Hosoda:
Ichimoku Kinkō Hyō: Original Ichimoku indicator with its five main lines and kumo.
Time Theory: automatic time cycle identification and forecasting to understand market timing.
Wave Theory: automatic wave identification to understand market structure.
Price Theory: automatic identification of developing N waves and possible price targets to understand future price behavior.
🔶 ICHIMOKU KINKŌ HYŌ
Ichimoku with lines only, Kumo only and both together
Let us start with the basics: the Ichimoku original indicator is a tool to understand the market, not to predict it, it is a trend-following tool, so it is best used in trending markets.
Ichimoku tells us what is happening in the market and what may happen next, the aim of the tool is to provide market understanding, not trading signals.
The tool is based on calculating the mid-point between the high and low of three pre-defined ranges as the equilibrium price for short (9 periods), medium (26 periods), and long (52 periods) time horizons:
Tenkan sen: middle point of the range of the last 9 candles
Kinjun sen: middle point of the range of the last 26 candles
Senkou span A: middle point between Tankan Sen and Kijun Sen, plotted 26 candles into the future
Senkou span B: midpoint of the range of the last 52 candles, plotted 26 candles into the future
Chikou span: closing price plotted 26 candles into the past
Kumo: area between Senkou pans A and B (kumo means cloud in Japanese)
The most basic use of the tool is to use the Kumo as an area of possible support or resistance.
🔶 TIME THEORY
Current cycles and forecast
Time theory is a critical concept used to identify historical and current market cycles, and use these to forecast the next ones. This concept is based on the Kihon Suchi (translating to "Basic Numbers" in Japanese), these are 9 and 26, and from their combinations we obtain the following sequence:
9, 17, 26, 33, 42, 51, 65, 76, 129, 172, 200, 257
The main idea is that the market moves in cycles with periods set by the Kihon Suchi sequence.
When the cycle has the same exact periods, we obtain the Taito Suchi (translating to "Same Number" in Japanese).
This tool allows traders to identify historical and current market cycles and forecast the next one.
🔹 Time Cycle Identification
Presentation of 4 different modes: SWINGS, HIGHS, KINJUN, and WAVES .
The tool draws a horizontal line at the bottom of the chart showing the cycles detected and their size.
The following settings are used:
Time Cycle Mode: up to 7 different modes
Wave Cycle: Which wave to use when WAVE mode is selected, only active waves in the Wave Theory settings will be used.
Show Time Cycles: keep a cleaner chart by disabling cycles visualisation
Show last X time cycles: how many cycles to display
🔹 Time Cycle Forecast
Showcasing the two forecasting patterns: Kihon Suchi and Taito Suchi
The tool plots horizontal lines, a solid anchor line, and several dotted forecast lines.
The following settings are used:
Show time cycle forecast: to keep things clean
Forecast Pattern: comes in two flavors
Kihon Suchi plots a line from the anchor at each number in the Kihon Suchi sequence.
Taito Suchi plot lines from the anchor with the same size detected in the anchored cycle
Anchor forecast on last X time cycle: traders can place the anchor in any detected cycle
🔶 WAVE THEORY
All waves activated with overlapping
The main idea behind this theory is that markets move like waves in the sea, back and forth (making swing lows and highs). Understanding the current market structure is key to having realistic expectations of what the market may do next. The waves are divided into Simple and Complex.
The following settings are used:
Basic Waves: allows traders to activate waves I, V and N
Complex Waves: allows traders to activate waves P, Y and W
Overlapping waves: to avoid missing out on any of the waves activated
Show last X waves: how many waves will be displayed
🔹 Basic Waves
The three basic waves
The basic waves from which all waves are made are I, V, and N
I wave: one leg moves
V wave: two legs move, one against the other
N wave: Three legs move, push, pull back, and another push
🔹 Complex Waves
Three complex waves
There are other waves like
P wave: contracting market
Y wave: expanding market
W wave: double top or double bottom
🔶 PRICE THEORY
All targets for the current N wave with their calculations
This theory is based on identifying developing N waves and predicting potential price targets based on that developing wave.
The tool displays 4 basic targets (V, E, N, and NT) and 3 extended targets (2E and 3E) according to the calculations shown in the chart above. Traders can enable or disable each target in the settings panel.
🔶 USING EVERYTHING TOGETHER
Please DON'T do this. This is not how you use it
Now the real example:
Daily chart of Nasdaq 100 futures (NQ1!) with our Ichimoku analysis
Time, waves, and price theories go together as one:
First, we identify the current time cycles and wave structure.
Then we forecast the next cycle and possible key price levels.
We identify a Taito Suchi with both legs of exactly 41 candles on each I wave, both together forming a V wave, the last two I waves are part of a developing N wave, and the time cycle of the first one is 191 candles. We forecast this cycle into the future and get 22nd April as a key date, so in 6 trading days (as of this writing) the market would have completed another Taito Suchi pattern if a new wave and time cycle starts. As we have a developing N wave we can see the potential price targets, the price is actually between the NT and V targets. We have a bullish Kumo and the price is touching it, if this Kumo provides enough support for the price to go further, the market could reach N or E targets.
So we have identified the cycle and wave, our expectations are that the current cycle is another Taito Suchi and the current wave is an N wave, the first I wave went for 191 candles, and we expect the second and third I waves together to amount to 191 candles, so in theory the N wave would complete in the next 6 trading days making a swing high. If this is indeed the case, the price could reach the V target (it is almost there) or even the N target if the bulls have the necessary strength.
We do not predict the future, we can only aim to understand the current market conditions and have future expectations of when (time), how (wave), and where (price) the market will make the next turning point where one side of the market overcomes the other (bulls vs bears).
To generate this chart, we change the following settings from the default ones:
Swing length: 64
Show lines: disabled
Forecast pattern: TAITO SUCHI
Anchor forecast: 2
Show last time cycles: 5
I WAVE: enabled
N WAVE: disabled
Show last waves: 5
🔶 SETTINGS
Show Swing Highs & Lows: Enable/Disable points on swing highs and swing lows.
Swing Length: Number of candles to confirm a swing high or swing low. A higher number detects larger swings.
🔹 Ichimoku Kinkō Hyō
Show Lines: Enable/Disable the 5 Ichimoku lines: Kijun sen, Tenkan sen, Senkou span A & B and Chikou Span.
Show Kumo: Enable/Disable the Kumo (cloud). The Kumo is formed by 2 lines: Senkou Span A and Senkou Span B.
Tenkan Sen Length: Number of candles for Tenkan Sen calculation.
Kinjun Sen Length: Number of candles for the Kijun Sen calculation.
Senkou Span B Length: Number of candles for Senkou Span B calculation.
Chikou & Senkou Offset: Number of candles for Chikou and Senkou Span calculation. Chikou Span is plotted in the past, and Senkou Span A & B in the future.
🔹 Time Theory
Show Time Cycle Forecast: Enable/Disable time cycle forecast vertical lines. Disable for better performance.
Forecast Pattern: Choose between two patterns: Kihon Suchi (basic numbers) or Taito Suchi (equal numbers).
Anchor forecast on last X time cycle: Number of time cycles in the past to anchor the time cycle forecast. The larger the number, the deeper in the past the anchor will be.
Time Cycle Mode: Choose from 7 time cycle detection modes: Tenkan Sen cross, Kijun Sen cross, Kumo change between bullish & bearish, swing highs only, swing lows only, both swing highs & lows and wave detection.
Wave Cycle: Choose which type of wave to detect from 6 different wave types when the time cycle mode is set to WAVES.
Show Time Cycles: Enable/Disable time cycle horizontal lines. Disable for better performance.
how last X time cycles: Maximum number of time cycles to display.
🔹 Wave Theory
Basic Waves: Enable/Disable the display of basic waves, all at once or one at a time. Disable for better performance.
Complex Waves: Enable/Disable complex wave display, all at once or one by one. Disable for better performance.
Overlapping Waves: Enable/Disable the display of waves ending on the same swing point.
Show last X waves: 'Maximum number of waves to display.
🔹 Price Theory
Basic Targets: Enable/Disable horizontal price target lines. Disable for better performance.
Extended Targets: Enable/Disable extended price target horizontal lines. Disable for better performance.

Aroon and ASH strategy - ETHERIUM [IkkeOmar]Intro:
This post introduces a Pine Script strategy, as an example if anyone needs a push to get started. This example is a strategy on ETH, obviously it isn't a good strategy, and I wouldn't share my own good strategies because of alpha decay. This strategy combines two technical indicators: Aroon and Absolute Strength Histogram (ASH).
Overview:
The strategy employs the Aroon indicator alongside the Absolute Strength Histogram (ASH) to determine market trends and potential trade setups. Aroon helps identify the strength and direction of a trend, while ASH provides insights into the strength of momentum. By combining these indicators, the strategy aims to capture profitable trading opportunities in Ethereum markets. Normally when developing strats using indicators, you want to find some good indicators, but you NEED to understand their strengths and weaknesses, other indicators can be incorporated to minimize the downs of another indicator. Try to look for synergy in your indicators!
Indicator settings:
Aroon Indicator:
- Two sets of parameters are used for the Aroon indicator:
- For Long Positions: Aroon periods are set to 56 (upper) and 20 (lower).
- For Short Positions: Aroon periods are set to 17 (upper) and 55 (lower).
Absolute Strength Histogram (ASH):
ASH is calculated with a length of 9 bars using the closing price as the data source.
Trading Conditions:
The strategy incorporates specific conditions to initiate and exit trades:
Start Date:
Traders can specify the start date for backtesting purposes.
Trade Direction:
Traders can select the desired trade direction: Long, Short, or Both.
Entry and Exit Conditions:
1. Long Position Entry: A long position is initiated when the Aroon indicator crosses over (crossover) the lower Aroon threshold, indicating a potential uptrend.
2. Long Position Exit: A long position is closed when the Aroon indicator crosses under (crossunder) the lower Aroon threshold.
3. Short Position Entry: A short position is initiated when the Aroon indicator crosses under (crossunder) the upper Aroon threshold, signaling a potential downtrend.
4. Short Position Exit: A short position is closed when the Aroon indicator crosses over (crossover) the upper Aroon threshold.
Disclaimer:
THIS ISN'T AN OPTIMAL STRATEGY AT ALL! It was just an old project from when I started learning pine script!
The backtest doesn't promise the same results in the future, always do both in-sample and out-of-sample testing when backtesting a strategy. And make sure you forward test it as well before implementing it!

3 Important Value CompositesCalculated on February 17, 2024. USDT 378 items, BTC 282 items, BINANCE
This is a watchlist, along with the most accurate computed values that I could achieve. It may be beneficial for those who want to change values from the "120x ticker screener (composite tickers)" indicator, which is one of the excellent indicators to bypass the limitation of the request. security() function that limits to only 40 requests. I've thought about this before but couldn't succeed, but someone finally did it. :)
--> 120x ticker screener (composite tickers)
Thank you once again for this idea.
You must look for this and change it.
t1 = 'symbol', n1 = Multiply , r1 = Pricescale(decimal)
Example of grouping: Group 1
BINANCE:ETHUSDT , BINANCE:FDUSDUSDT , BINANCE:BTCUSDT
2, 4, 2
13, 10
█ Note
• Tickers: For your watchlist, arrange them from left to right, pairing them in groups of 3.
• Pricescale: This represents the decimal length, arrange them from left to right, pairing them in groups of 3.
• Multiply: This involves multiplying the first 2 items in each pair of watchlists. Arrange them from left to right, pairing them in groups of 2.
* If you group items incorrectly, it may lead to inaccurate results.
* Please be advised that if one of the values in the "Pricescale"(decimal) trio changes, there may be a need to adjust those values accordingly to ensure correct digit separation. Otherwise, within the group, the numbers might appear peculiar.

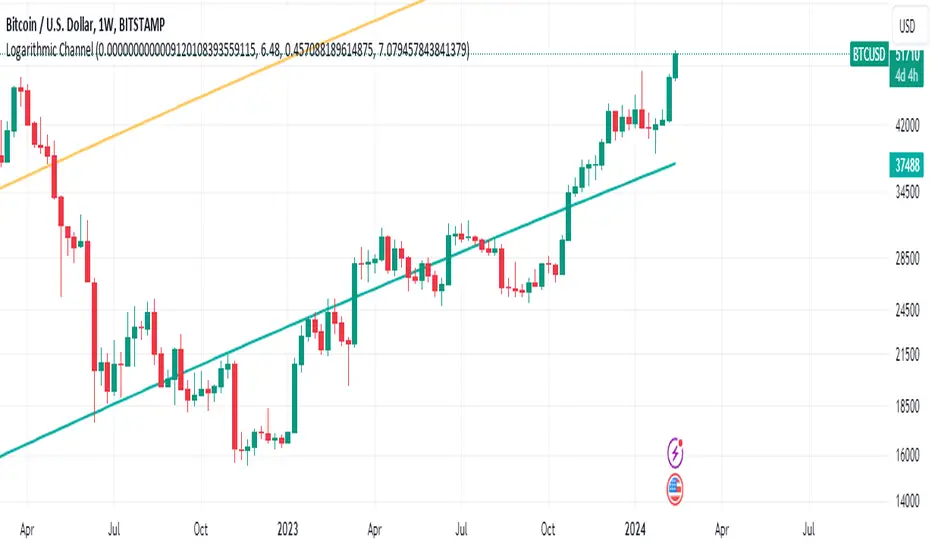
Bitcoin's Logarithmic ChannelLogarithmic growth is a reasonable way to describe the long term growth of bitcoin's market value: for a network that is experiencing growing adoption and is powered by an asset with a finite and disinflationary supply, it’s natural to expect a more explosive growth of its market capitalization early on, followed by diminishing returns as the network and the asset mature.
I used publicly available data to model the market capitalization of bitcoin, deriving thereform a set of three curves forming a logarithmic growth channel for the market capitalization of bitcoin. Using the time series for the circulating supply, we derive a logarithmic growth channel for the bitcoin price.
Model uses publicly available data from July 17, 2010 to December 31, 2022. Everything since the beginning of 2023 is a prediction.
Past performance is not a guarantee of future results.
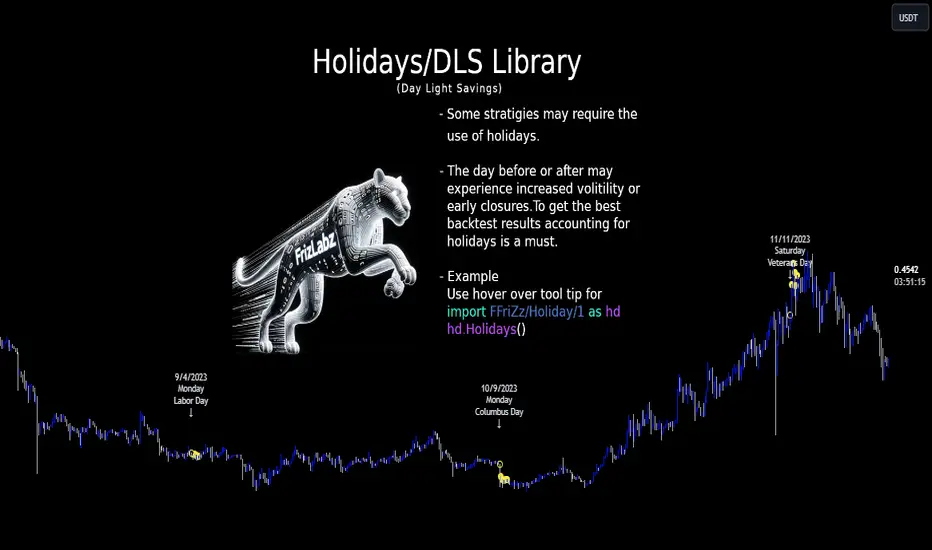
HolidayLibrary "Holiday"
- Full Control over Holidays and Daylight Savings Time (DLS)
The Holiday Library is an essential tool for traders and analysts who engage in backtesting and live trading . This comprehensive library enables the incorporation of crucial calendar elements - specifically Daylight Savings Time (DLS) adjustments and public holidays - into trading strategies and backtesting environments.
Key Features:
- DLS Adjustments: The library takes into account the shifts in time due to Daylight Savings. This feature is particularly vital for backtesting strategies, as DLS can impact trading hours, which in turn affects the volatility and liquidity in the market. Accurate DLS adjustments ensure that backtesting scenarios are as close to real-life conditions as possible.
- Comprehensive Holiday Metadata: The library includes a rich set of holiday metadata, allowing for the detailed scheduling of trading activities around public holidays. This feature is crucial for avoiding skewed results in backtesting, where holiday trading sessions might differ significantly in terms of volume and price movement.
- Customizable Holiday Schedules: Users can add or remove specific holidays, tailoring the library to fit various regional market schedules or specific trading requirements.
- Visualization Aids: The library supports on-chart labels, making it visually intuitive to identify holidays and DLS shifts directly on trading charts.
Use Cases:
1. Strategy Development: When developing trading strategies, it’s important to account for non-trading days and altered trading hours due to holidays and DLS. This library enables a realistic and accurate representation of these factors.
2. Risk Management: Trading around holidays can be riskier due to thinner liquidity and greater volatility. By integrating holiday data, traders can better manage their risk exposure.
3. Backtesting Accuracy: For backtesting to be effective, it must simulate the actual market conditions as closely as possible. Incorporating holidays and DLS adjustments contributes to more reliable and realistic backtesting results.
4. Global Trading: For traders active in multiple global markets, this library provides an easy way to handle different holiday schedules and DLS shifts across regions.
The Holiday Library is a versatile tool that enhances the precision and realism of trading simulations and strategy development . Its integration into the trading workflow is straightforward and beneficial for both novice and experienced traders.
EasterAlgo(_year)
Calculates the date of Easter Sunday for a given year using the Anonymous Gregorian algorithm.
`Gauss Algorithm for Easter Sunday` was developed by the mathematician Carl Friedrich Gauss
This algorithm is based on the cycles of the moon and the fact that Easter always falls on the first Sunday after the first ecclesiastical full moon that occurs on or after March 21.
While it's not considered to be 100% accurate due to rare exceptions, it does give the correct date in most cases.
It's important to note that Gauss's formula has been found to be inaccurate for some 21st-century years in the Gregorian calendar. Specifically, the next suggested failure years are 2038, 2051.
This function can be used for Good Friday (Friday before Easter), Easter Sunday, and Easter Monday (following Monday).
en.wikipedia.org
Parameters:
_year (int) : `int` - The year for which to calculate the date of Easter Sunday. This should be a four-digit year (YYYY).
Returns: tuple - The month (1-12) and day (1-31) of Easter Sunday for the given year.
easterInit()
Inits the date of Easter Sunday and Good Friday for a given year.
Returns: tuple - The month (1-12) and day (1-31) of Easter Sunday and Good Friday for the given year.
isLeapYear(_year)
Determine if a year is a leap year.
Parameters:
_year (int) : `int` - 4 digit year to check => YYYY
Returns: `bool` - true if input year is a leap year
method timezoneHelper(utc)
Helper function to convert UTC time.
Namespace types: series int, simple int, input int, const int
Parameters:
utc (int) : `int` - UTC time shift in hours.
Returns: `string`- UTC time string with shift applied.
weekofmonth()
Function to find the week of the month of a given Unix Time.
Returns: number - The week of the month of the specified UTC time.
dayLightSavingsAdjustedUTC(utc, adjustForDLS)
dayLightSavingsAdjustedUTC
Parameters:
utc (int) : `int` - The normal UTC timestamp to be used for reference.
adjustForDLS (bool) : `bool` - Flag indicating whether to adjust for daylight savings time (DLS).
Returns: `int` - The adjusted UTC timestamp for the given normal UTC timestamp.
getDayOfYear(monthOfYear, dayOfMonth, weekOfMonth, dayOfWeek, lastOccurrenceInMonth, holiday)
Function gets the day of the year of a given holiday (1-366)
Parameters:
monthOfYear (int)
dayOfMonth (int)
weekOfMonth (int)
dayOfWeek (int)
lastOccurrenceInMonth (bool)
holiday (string)
Returns: `int` - The day of the year of the holiday 1-366.
method buildMap(holidayMap, holiday, monthOfYear, weekOfMonth, dayOfWeek, dayOfMonth, lastOccurrenceInMonth, closingTime)
Function to build the `holidaysMap`.
Namespace types: map
Parameters:
holidayMap (map) : `map` - The map of holidays.
holiday (string) : `string` - The name of the holiday.
monthOfYear (int) : `int` - The month of the year of the holiday.
weekOfMonth (int) : `int` - The week of the month of the holiday.
dayOfWeek (int) : `int` - The day of the week of the holiday.
dayOfMonth (int) : `int` - The day of the month of the holiday.
lastOccurrenceInMonth (bool) : `bool` - Flag indicating whether the holiday is the last occurrence of the day in the month.
closingTime (int) : `int` - The closing time of the holiday.
Returns: `map` - The updated map of holidays
holidayInit(addHolidaysArray, removeHolidaysArray, defaultHolidays)
Initializes a HolidayStorage object with predefined US holidays.
Parameters:
addHolidaysArray (array) : `array` - The array of additional holidays to be added.
removeHolidaysArray (array) : `array` - The array of holidays to be removed.
defaultHolidays (bool) : `bool` - Flag indicating whether to include the default holidays.
Returns: `map` - The map of holidays.
Holidays(utc, addHolidaysArray, removeHolidaysArray, adjustForDLS, displayLabel, defaultHolidays)
Main function to build the holidays object, this is the only function from this library that should be needed. \
all functionality should be available through this function. \
With the exception of initializing a `HolidayMetaData` object to add a holiday or early close. \
\
**Default Holidays:** \
`DLS begin`, `DLS end`, `New Year's Day`, `MLK Jr. Day`, \
`Washington Day`, `Memorial Day`, `Independence Day`, `Labor Day`, \
`Columbus Day`, `Veterans Day`, `Thanksgiving Day`, `Christmas Day` \
\
**Example**
```
HolidayMetaData valentinesDay = HolidayMetaData.new(holiday="Valentine's Day", monthOfYear=2, dayOfMonth=14)
HolidayMetaData stPatricksDay = HolidayMetaData.new(holiday="St. Patrick's Day", monthOfYear=3, dayOfMonth=17)
HolidayMetaData addHolidaysArray = array.from(valentinesDay, stPatricksDay)
string removeHolidaysArray = array.from("DLS begin", "DLS end")
܂Holidays = Holidays(
܂ utc=-6,
܂ addHolidaysArray=addHolidaysArray,
܂ removeHolidaysArray=removeHolidaysArray,
܂ adjustForDLS=true,
܂ displayLabel=true,
܂ defaultHolidays=true,
܂ )
plot(Holidays.newHoliday ? open : na, title="newHoliday", color=color.red, linewidth=4, style=plot.style_circles)
```
Parameters:
utc (int) : `int` - The UTC time shift in hours
addHolidaysArray (array) : `array` - The array of additional holidays to be added
removeHolidaysArray (array) : `array` - The array of holidays to be removed
adjustForDLS (bool) : `bool` - Flag indicating whether to adjust for daylight savings time (DLS)
displayLabel (bool) : `bool` - Flag indicating whether to display a label on the chart
defaultHolidays (bool) : `bool` - Flag indicating whether to include the default holidays
Returns: `HolidayObject` - The holidays object | Holidays = (holidaysMap: map, newHoliday: bool, holiday: string, dayString: string)
HolidayMetaData
HolidayMetaData
Fields:
holiday (series string) : `string` - The name of the holiday.
dayOfYear (series int) : `int` - The day of the year of the holiday.
monthOfYear (series int) : `int` - The month of the year of the holiday.
dayOfMonth (series int) : `int` - The day of the month of the holiday.
weekOfMonth (series int) : `int` - The week of the month of the holiday.
dayOfWeek (series int) : `int` - The day of the week of the holiday.
lastOccurrenceInMonth (series bool)
closingTime (series int) : `int` - The closing time of the holiday.
utc (series int) : `int` - The UTC time shift in hours.
HolidayObject
HolidayObject
Fields:
holidaysMap (map) : `map` - The map of holidays.
newHoliday (series bool) : `bool` - Flag indicating whether today is a new holiday.
activeHoliday (series bool) : `bool` - Flag indicating whether today is an active holiday.
holiday (series string) : `string` - The name of the holiday.
dayString (series string) : `string` - The day of the week of the holiday.
forex_factory_utilityLibrary "forex_factory_utility"
Supporting Utility Library for the Live Economic Calendar by toodegrees Indicator; responsible for data handling, and plotting news event data.
isLeapYear()
Finds if it's currently a leap year or not.
Returns: Returns True if the current year is a leap year.
daysMonth(M)
Provides the days in a given month of the year, adjusted during leap years.
Parameters:
M (int) : Month in numerical integer format (i.e. Jan=1).
Returns: Days in the provided month.
size(S, N)
Converts a size string into the corresponding Pine Script v5 format, or N times smaller/bigger.
Parameters:
S (string) : Size string: "Tiny", "Small", "Normal", "Large", or "Huge".
N (int) : Size variation, can be positive (larger than S), or negative (smaller than S).
Returns: Size string in Pine Script v5 format.
lineStyle(S)
Converts a line style string into the corresponding Pine Script v5 format.
Parameters:
S (string) : Line style string: "Dashed", "Dotted" or "Solid".
Returns: Line style string in Pine Script v5 format.
lineTrnsp(S)
Converts a transparency style string into the corresponding integer value.
Parameters:
S (string) : Line style string: "Light", "Medium" or "Heavy".
Returns: Transparency integer.
boxLoc(X, Y)
Converts position strings of X and Y into a table position in Pine Script v5 format.
Parameters:
X (string) : X-axis string: "Left", "Center", or "Right".
Y (string) : Y-axis string: "Top", "Middle", or "Bottom".
Returns: Table location string in Pine Script v5 format.
method bubbleSort_NewsTOD(N)
Performs bubble sort on a Forex Factory News array of all news from the same date, ordering them in ascending order based on the time of the day.
Namespace types: News
Parameters:
N (News ) : Forex Factory News array.
Returns: void
bubbleSort_News(N)
Performs bubble sort on a Forex Factory News array, ordering them in ascending order based on the time of the day, and date.
Parameters:
N (News ) : Forex Factory News array.
Returns: Sorted Forex Factory News array.
weekNews(N, C, I)
Creates a Forex Factory News array containing the current week's Forex Factory News.
Parameters:
N (News ) : Forex Factory News array containing this week's unfiltered Forex Factory News.
C (string ) : Currency filter array (string array).
I (color ) : Impact filter array (color array).
Returns: Forex Factory News array containing the current week's Forex Factory News.
todayNews(W, D, M)
Creates a Forex Factory News array containing the current day's Forex Factory News.
Parameters:
W (News ) : Forex Factory News array containing this week's Forex Factory News.
D (News ) : Forex Factory News array for the current day's Forex Factory News.
M (bool) : Boolean that marks whether the current chart has a Day candle-switch at Midnight New York Time.
Returns: Forex Factory News array containing the current day's Forex Factory News.
impFilter(X, L, M, H)
Creates a filter array from the User's desired Forex Facory News to be shown based on Impact.
Parameters:
X (bool) : Boolean - if True Holidays listed on Forex Factory will be shown.
L (bool) : Boolean - if True Low Impact listed on Forex Factory News will be shown.
M (bool) : Boolean - if True Medium Impact listed on Forex Factory News will be shown.
H (bool) : Boolean - if True High Impact listed on Forex Factory News will be shown.
Returns: Color array with the colors corresponding to the Forex Factory News to be shown.
curFilter(A, C1, C2, C3, C4, C5, C6, C7, C8, C9)
Creates a filter array from the User's desired Forex Facory News to be shown based on Currency.
Parameters:
A (bool) : Boolean - if True News related to the current Chart's symbol listed on Forex Factory will be shown.
C1 (bool) : Boolean - if True News related to the Australian Dollar listed on Forex Factory will be shown.
C2 (bool) : Boolean - if True News related to the Canadian Dollar listed on Forex Factory will be shown.
C3 (bool) : Boolean - if True News related to the Swiss Franc listed on Forex Factory will be shown.
C4 (bool) : Boolean - if True News related to the Chinese Yuan listed on Forex Factory will be shown.
C5 (bool) : Boolean - if True News related to the Euro listed on Forex Factory will be shown.
C6 (bool) : Boolean - if True News related to the British Pound listed on Forex Factory will be shown.
C7 (bool) : Boolean - if True News related to the Japanese Yen listed on Forex Factory will be shown.
C8 (bool) : Boolean - if True News related to the New Zealand Dollar listed on Forex Factory will be shown.
C9 (bool) : Boolean - if True News related to the US Dollar listed on Forex Factory will be shown.
Returns: String array with the currencies corresponding to the Forex Factory News to be shown.
FF_OnChartLine(N, T, S)
Plots vertical lines where a Forex Factory News event will occur, or has already occurred.
Parameters:
N (News ) : News-type array containing all the Forex Factory News.
T (int) : Transparency integer value (0-100) for the lines.
S (string) : Line style in Pine Script v5 format.
Returns: void
method updateStringMatrix(M, P, V)
Namespace types: matrix
Parameters:
M (matrix)
P (int)
V (string)
FF_OnChartLabel(N, Y, S)
Plots labels where a Forex Factory News has already occurred based on its/their impact.
Parameters:
N (News ) : News-type array containing all the Forex Factory News.
Y (string) : String that gives direction on where to plot the label (options= "Above", "Below", "Auto").
S (string) : Label size in Pine Script v5 format.
Returns: void
historical(T, D, W, X)
Deletes Forex Factory News drawings which are ourside a specific Time window.
Parameters:
T (int) : Number of days input used for Forex Factory News drawings' history.
D (bool) : Boolean that when true will only display Forex Factory News drawings of the current day.
W (bool) : Boolean that when true will only display Forex Factory News drawings of the current week.
X (string) : String that gives direction on what lines to plot based on Time (options= "Past", "Future", "Both").
Returns: void
newTable(P)
Creates a new Table object with parameters tailored to the Forex Factory News Table.
Parameters:
P (string) : Position string for the Table, in Pine Script v5 format.
Returns: Empty Forex Factory News Table.
resetTable(P, S, headTextC, headBgC)
Resets a Table object with parameters and headers tailored to the Forex Factory News Table.
Parameters:
P (string) : Position string for the Table, in Pine Script v5 format.
S (string) : Size string for the Table's text, in Pine Script v5 format.
headTextC (color)
headBgC (color)
Returns: Empty Forex Factory News Table.
logNews(N, TBL, R, S, rowTextC, rowBgC)
Adds an event to the Forex Factory News Table.
Parameters:
N (News) : News-type object.
TBL (table) : Forex Factory News Table object to add the News to.
R (int) : Row to add the event to in the Forex Factory News Table.
S (string) : Size string for the event's text, in Pine Script v5 format.
rowTextC (color)
rowBgC (color)
Returns: void
FF_Table(N, P, S, headTextC, headBgC, rowTextC, rowBgC)
Creates the Forex Factory News Table.
Parameters:
N (News ) : News-type array containing all the Forex Factory News.
P (string) : Position string for the Table, in Pine Script v5 format.
S (string) : Size string for the Table's text, in Pine Script v5 format.
headTextC (color)
headBgC (color)
rowTextC (color)
rowBgC (color)
Returns: Forex Factory News Table.
timeline(N, T, F, D)
Shades Forex Factory News events in the Forex Factory News Table after they occur.
Parameters:
N (News ) : News-type array containing all the Forex Factory News.
T (table) : Forex Facory News table object.
F (color) : Color used as shading once the Forex Factory News has occurred.
D (bool) : Daily Forex Factory News flag.
Returns: Forex Factory News Table.
News
Custom News type which contains informatino about a Forex Factory News Event.
Fields:
dow (series string) : Day of the week, in DDD format (i.e. 'Mon').
dat (series string) : Date, in MMM D format (i.e. 'Jan 1').
_t (series int)
tod (series string) : Time of the day, in hh:mm 24-Hour format (i.e 17:10).
cur (series string) : Currency, in CCC format (i.e. "USD").
imp (series color) : Impact, the respective impact color for Forex Factory News Events.
ttl (series string) : Title, encoded in a custom number mapping (see the toodegrees/toodegrees_forex_factory library to learn more).
tmst (series int)
ln (series line)
Catching Trend Reversals by shorting tops and buying bottomsHOLP (High of the low period) and LOHP (Low of the high period)
Catching Trend Reversals by shorting tops and buying bottoms
using this Swing High/Low Indicator
Trading Strategy comes from Mastering the Trade, by John Carter pg 300.
Trading Rules for Sells, Buys are reversed
1. Identifying a trending market, where today's price is making a 20-day high (17-18 day highs are also fine)
Note this is configurable by setting the trending period variable (defaults to 20)
For example if price is making a 20 period high or 20 period low, it will show a triangle up/down above the candle.
2. Identify the high bar in the uptrend
3. Go short once the price action closes below the low of this high bar
4. The initial stop is the high of the high bar.
5. If you are in the trade on the third day or period, use a 2 bar trailing stop.
You can check 2-bar trailing stop to draw the line, defaults to off.
Stop is indicated by the white dot.
Code Converted from TradeStation EasyLanguage
I can't find the original source anymore for the swing high/low plots, but if someone knows,
let me know and I'll credit here.

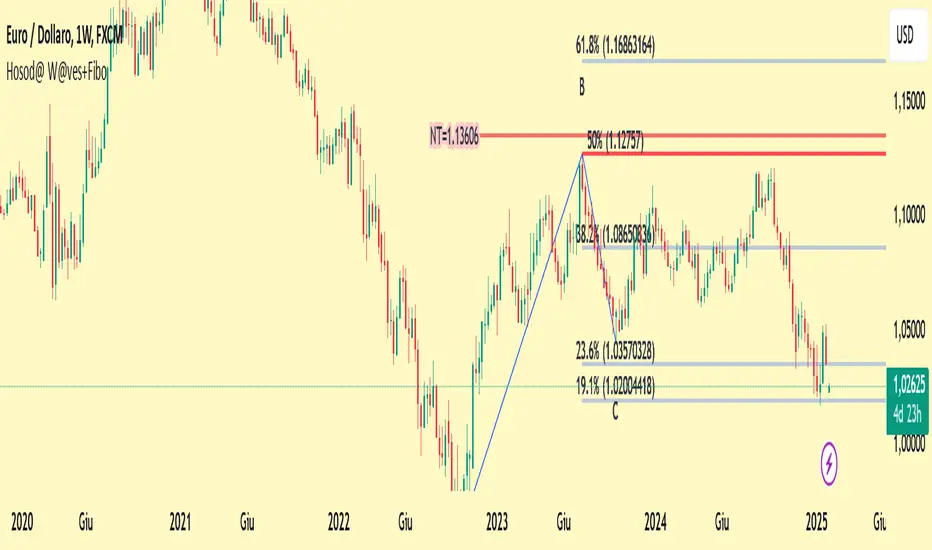
Hosoda Waves ABCThe Hosoda Waves indicator was devised by Goichi Hosoda, the creator of the Ichimoku system, with the idea that previous highs and lows could determine future price ranges to which the market would react. Hosoda's projections include the NT, N, V, and E waves, derived from calculations based on both upward and downward ABC swings. The calculations for Hosoda's waves are as follows:
NT Wave = C + (C - A)
N Wave = B + (B - A)
V Wave = B + (B - C)
E Wave = C + (B - A)
This indicator visually represents the calculations by Hosoda. Additionally, Hosoda indicated time cycles: 9, 17, 26, 33, 42, 51, 65, 76, etc., which are not integrated into this indicator as they are not considered effective in contemporary times.
Once applied to the chart, the interactive Pine Script tool version 5 will prompt you to identify 3 points of "low-high-low" or "high-low-high," both for upward and downward movements. Once clicked, these price points can be moved. If you change the time frame or market instrument, the indicator must be removed because it remains tied to the prices where it was initially drawn.
Multi Kernel Regression [ChartPrime]The "Multi Kernel Regression" is a versatile trading indicator that provides graphical interpretations of market trends by using different kernel regression methods. It's beneficial because it smoothes out price data, creating a clearer picture of price movements, and can be tailored according to the user's preference with various options.
What makes this indicator uniquely versatile is the 'Kernel Select' feature, which allows you to choose from a variety of regression kernel types, such as Gaussian, Logistic, Cosine, and many more. In fact, you have 17 options in total, making this an adaptable tool for diverse market contexts.
The bandwidth input parameter directly affects the smoothness of the regression line. While a lower value will make the line more sensitive to price changes by sticking closely to the actual prices, a higher value will smooth out the line even further by placing more emphasis on distant prices.
It's worth noting that the indicator's 'Repaint' function, which re-estimates work according to the most recent data, is not a deficiency or a flaw. Instead, it’s a crucial part of its functionality, updating the regression line with the most recent data, ensuring the indicator measurements remain as accurate as possible. We have however included a non-repaint feature that provides fixed calculations, creating a steady line that does not change once it has been plotted, for a different perspective on market trends.
This indicator also allows you to customize the line color, style, and width, allowing you to seamlessly integrate it into your existing chart setup. With labels indicating potential market turn points, you can stay on top of significant price movements.
Repaint : Enabling this allows the estimator to repaint to maintain accuracy as new data comes in.
Kernel Select : This option allows you to select from an array of kernel types such as Triangular, Gaussian, Logistic, etc. Each kernel has a unique weight function which influences how the regression line is calculated.
Bandwidth : This input, a scalar value, controls the regression line's sensitivity towards the price changes. A lower value makes the regression line more sensitive (closer to price) and higher value makes it smoother.
Source : Here you denote which price the indicator should consider for calculation. Traditionally, this is set as the close price.
Deviation : Adjust this to change the distance of the channel from the regression line. Higher values widen the channel, lower values make it smaller.
Line Style : This provides options to adjust the visual style of the regression lines. Options include Solid, Dotted, and Dashed.
Labels : Enabling this introduces markers at points where the market direction switches. Adjust the label size to suit your preference.
Colors : Customize color schemes for bullish and bearish trends along with the text color to match your chart setup.
Kernel regression, the technique behind the Multi Kernel Regression Indicator, has a rich history rooted in the world of statistical analysis and machine learning.
The origins of kernel regression are linked to the work of Emanuel Parzen in the 1960s. He was a pioneer in the development of nonparametric statistics, a domain where kernel regression plays a critical role. Although originally developed for the field of probability, these methods quickly found application in various other scientific disciplines, notably in econometrics and finance.
Kernel regression became really popular in the 1980s and 1990s along with the rise of other nonparametric techniques, like local regression and spline smoothing. It was during this time that kernel regression methods were extensively studied and widely applied in the fields of machine learning and data science.
What makes the kernel regression ideal for various statistical tasks, including financial market analysis, is its flexibility. Unlike linear regression, which assumes a specific functional form for the relationship between the independent and dependent variables, kernel regression makes no such assumptions. It creates a smooth curve fit to the data, which makes it extremely useful in capturing complex relationships in data.
In the context of stock market analysis, kernel regression techniques came into use in the late 20th century as computational power improved and these techniques could be more easily applied. Since then, they have played a fundamental role in financial market modeling, market prediction, and the development of trading indicators, like the Multi Kernel Regression Indicator.
Today, the use of kernel regression has solidified its place in the world of trading and market analysis, being widely recognized as one of the most effective methods for capturing and visualizing market trends.
The Multi Kernel Regression Indicator is built upon kernel regression, a versatile statistical method pioneered by Emanuel Parzen in the 1960s and subsequently refined for financial market analysis. It provides a robust and flexible approach to capturing complex market data relationships.
This indicator is more than just a charting tool; it reflects the power of computational trading methods, combining statistical robustness with visual versatility. It's an invaluable asset for traders, capturing and interpreting complex market trends while integrating seamlessly into diverse trading scenarios.
In summary, the Multi Kernel Regression Indicator stands as a testament to kernel regression's historic legacy, modern computational power, and contemporary trading insight.
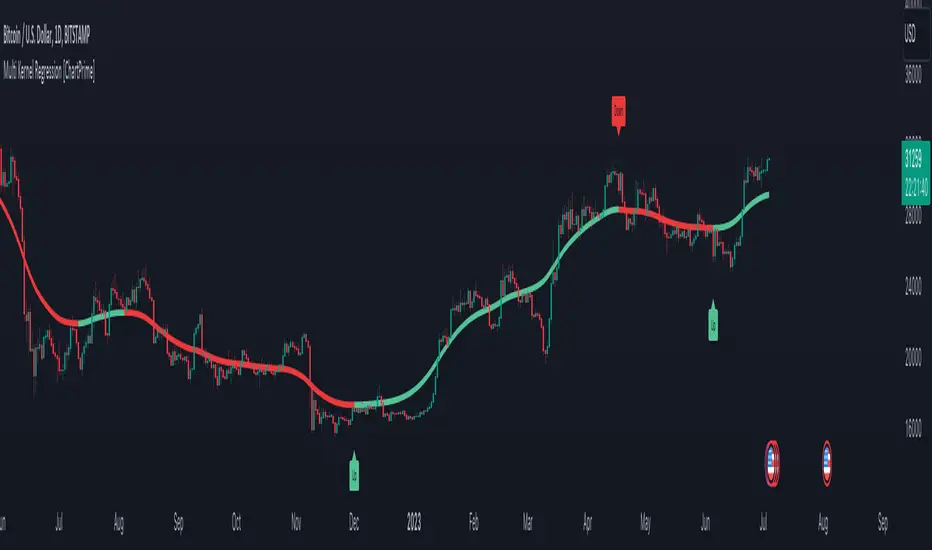
ATR GOD Strategy by TradeSmart (PineConnector-compatible)This is a highly-customizable trading strategy made by TradeSmart, focusing mainly on ATR-based indicators and filters. The strategy is mainly intended for trading forex , and has been optimized using the Deep Backtest feature on the 2018.01.01 - 2023.06.01 interval on the EUR/USD (FXCM) 15M chart, with a Slippage value of 3, and a Commission set to 0.00004 USD per contract. The strategy is also made compatible with PineConnector , to provide an easy option to automate the strategy using a connection to MetaTrader. See tooltips for details on how to set up the bot, and check out our website for a detailed guide with images on how to automate the strategy.
The strategy was implemented using the following logic:
Entry strategy:
A total of 4 Supertrend values can be used to determine the entry logic. There is option to set up all 4 Supertrend parameters individually, as well as their potential to be used as an entry signal/or a trend filter. Long/Short entry signals will be determined based on the selected potential Supertrend entry signals, and filtered based on them being in an uptrend/downtrend (also available for setup). Please use the provided tooltips for each setup to see every detail.
Exit strategy:
4 different types of Stop Losses are available: ATR-based/Candle Low/High Based/Percentage Based/Pip Based. Additionally, Force exiting can also be applied, where there is option to set up 4 custom sessions, and exits will happen after the session has closed.
Parameters of every indicator used in the strategy can be tuned in the strategy settings as follows:
Plot settings:
Plot Signals: true by default, Show all Long and Short signals on the signal candle
Plot SL/TP lines: false by default, Checking this option will result in the TP and SL lines to be plotted on the chart.
Supertrend 1-4:
All the parameters of the Supertrends can be set up here, as well as their individual role in the entry logic.
Exit Strategy:
ATR Based Stop Loss: true by default
ATR Length (of the SL): 100 by default
ATR Smoothing (of the SL): RMA/SMMA by default
Candle Low/High Based Stop Loss: false by default, recent lowest or highest point (depending on long/short position) will be used to calculate stop loss value. Set 'Base Risk Multiplier' to 1 if you would like to use the calculated value as is. Setting it to a different value will count as an additional multiplier.
Candle Lookback (of the SL): 50 by default
Percentage Based Stop Loss: false by default, Set the stop loss to current price - % of current price (long) or price + % of current price (short).
Percentage (of the SL): 0.3 by default
Pip Based Stop Loss: Set the stop loss to current price - x pips (long) or price + x pips (short). Set 'Base Risk Multiplier' to 1 if you would like to use the calculated value as is. Setting it to a different value will count as an additional multiplier.
Pip (of the SL): 10 by default
Base Risk Multiplier: 4.5 by default, the stop loss will be placed at this risk level (meaning in case of ATR SL that the ATR value will be multiplied by this factor and the SL will be placed that value away from the entry level)
Risk to Reward Ratio: 1.5 by default, the take profit level will be placed such as this Risk/Reward ratio is met
Force Exiting:
4 total Force exit on custom session close options: none applied by default. If enabled, trades will close automatically after the set session is closed (on next candle's open).
Base Setups:
Allow Long Entries: true by default
Allow Short Entries: true by default
Order Size: 10 by default
Order Type: Capital Percentage by default, allows adjustment on how the position size is calculated: Cash: only the set cash amount will be used for each trade Contract(s): the adjusted number of contracts will be used for each trade Capital Percentage: a % of the current available capital will be used for each trade
ATR Limiter:
Use ATR Limiter: true by default, Only enter into any position (long/short) if ATR value is higher than the Low Boundary and lower than the High Boundary.
ATR Limiter Length: 50 by default
ATR Limiter Smoothing: RMA/SMMA by default
High Boundary: 1000 by default
Low Boundary: 0.0003 by default
MA based calculation: ATR value under MA by default, If not Unspecified, an MA is calculated with the ATR value as source. Only enter into position (long/short) if ATR value is higher/lower than the MA.
MA Type: RMA/SMMA by default
MA Length: 400 by default
Waddah Attar Filter:
Explosion/Deadzone relation: Not specified by default, Explosion over Deadzone: trades will only happen if the explosion line is over the deadzone line; Explosion under Deadzone: trades will only happen if the explosion line is under the deadzone line; Not specified: the opening of trades will not be based on the relation between the explosion and deadzone lines.
Limit trades based on trends: Not specified by default, Strong Trends: only enter long if the WA bar is colored green (there is an uptrend and the current bar is higher then the previous); only enter short if the WA bar is colored red (there is a downtrend and the current bar is higher then the previous); Soft Trends: only enter long if the WA bar is colored lime (there is an uptrend and the current bar is lower then the previous); only enter short if the WA bar is colored orange (there is a downtrend and the current bar is lower then the previous); All Trends: only enter long if the WA bar is colored green or lime (there is an uptrend); only enter short if the WA bar is colored red or orange (there is a downtrend); Not specified: the color of the WA bar (trend) is not relevant when considering entries.
WA bar value: Not specified by default, Over Explosion and Deadzone: only enter trades when the WA bar value is over the Explosion and Deadzone lines; Not specified: the relation between the explosion/deadzone lines to the value of the WA bar will not be used to filter opening trades.
Sensitivity: 150 by default
Fast MA Type: SMA by default
Fast MA Length: 10 by default
Slow MA Type: SMA
Slow MA Length: 20 by default
Channel MA Type: EMA by default
BB Channel Length: 20 by default
BB Stdev Multiplier: 2 by default
Trend Filter:
Use long trend filter 1: false by default, Only enter long if price is above Long MA.
Show long trend filter 1: false by default, Plot the selected MA on the chart.
TF1 - MA Type: EMA by default
TF1 - MA Length: 120 by default
TF1 - MA Source: close by default
Use short trend filter 1: false by default, Only enter long if price is above Long MA.
Show short trend filter 1: false by default, Plot the selected MA on the chart.
TF2 - MA Type: EMA by default
TF2 - MA Length: 120 by default
TF2 - MA Source: close by default
Volume Filter:
Only enter trades where volume is higher then the volume-based MA: true by default, a set type of MA will be calculated with the volume as source, and set length
MA Type: RMA/SMMA by default
MA Length: 200 by default
Date Range Limiter:
Limit Between Dates: false by default
Start Date: Jan 01 2023 00:00:00 by default
End Date: Jun 24 2023 00:00:00 by default
Session Limiter:
Show session plots: false by default, show market sessions on chart: Sidney (red), Tokyo (orange), London (yellow), New York (green)
Use session limiter: false by default, if enabled, trades will only happen in the ticked sessions below.
Sidney session: false by default, session between: 15:00 - 00:00 (EST)
Tokyo session: false by default, session between: 19:00 - 04:00 (EST)
London session: false by default, session between: 03:00 - 11:00 (EST)
New York session: false by default, session between: 08:00 - 17:00 (EST)
Trading Time:
Limit Trading Time: true by default, tick this together with the options below to enable limiting based on day and time
Valid Trading Days Global: 123567 by default, if the Limit Trading Time is on, trades will only happen on days that are present in this field. If any of the not global Valid Trading Days is used, this field will be neglected. Values represent days: Sunday (1), Monday (2), ..., Friday (6), Saturday(7) To trade on all days use: 123457
(1) Valid Trading Days: false, 123456 by default, values represent days: Sunday (1), Monday (2), ..., Friday (6), Saturday(7) The script will trade on days that are present in this field. Please make sure that this field and also (1) Valid Trading Hours Between is checked
(1) Valid Trading Hours Between: false, 1800-2000 by default, hours between which the trades can happen. The time is always in the exchange's timezone
All other options are also disabled by default
PineConnector Automation:
Use PineConnector Automation: false by default, In order for the connection to MetaTrader to work, you will need do perform prerequisite steps, you can follow our full guide at our website, or refer to the official PineConnector Documentation. To set up PineConnector Automation on the TradingView side, you will need to do the following:
1. Fill out the License ID field with your PineConnector License ID;
2. Fill out the Risk (trading volume) with the desired volume to be traded in each trade (the meaning of this value depends on the EA settings in Metatrader. Follow the detailed guide for additional information);
3. After filling out the fields, you need to enable the 'Use PineConnector Automation' option (check the box in the strategy settings);
4. Check if the chart has updated and you can see the appropriate order comments on your chart;
5. Create an alert with the strategy selected as Condition, and the Message as {{strategy.order.comment}} (should be there by default);
6. Enable the Webhook URL in the Notifications section, set it as the official PineConnector webhook address and enjoy your connection with MetaTrader.
License ID: 60123456789 by default
Risk (trading volume): 1 by default
NOTE! Fine-tuning/re-optimization is highly recommended when using other asset/timeframe combinations.

RSI Dot Party - All Lengths From 1 To 120The RSI Dot Party indicator displays all RSI lengths from 1 to 120 as different colored dots on the chart.
🔶 Purpose
Show the reversal point of price action to time entries and exits.
🔶 USAGE
When a dot displays it is a indication of the reversal of the price/trend. The larger the dot the more likely it is to reverse.
The Default settings generates dots for extreme cases where the RSI is over = 90 or under = 10 for every RSI length in the range of 1-120.
Example if the RSI of length 1 or 2 or 3 or 4 or ... or 15 or 16 or 17 or ... or 80 or 81 or 82 or ... if any of does RSI crosses a boundary a dot is shown.
A boundary is the over/under the RSI oscillates in.
Customize the settings until the dots match up with the high and lows of past price action.
🔶 SETTINGS
🔹 Source
Source 1: Is the First Source RSI is calculated from
Source 2: Is the Second Source RSI is calculated from
🔹 Meta Settings
Hours back to draw: To speed up the script calculate it only draws a set number of hours back, default is 300 hours back in time to draw then it cuts off.
Show Dots: Show or disable dots
Show Bar Color: Color the bars for each RSI incident
Filter Cross: Filters and only shows dots when the RSI crosses above or bellow a boundary. If not all candles above or bellow the boundaries will display a dot.
Dots Location Absolute: Instead of showing the dots above or bellow the candle, the dots will show up on the top and bottom of the window.
🔹 7 RSI Groups
There are a total of 7 RSI colors.
Range Very Tiny: Default Color Green
Range Tiny: Default Color Purple
Range Small: Default Color Yellow
Range Normal: Default Color Red
Range Large: Default Color Blue
Range Huge: Default Color Dark Purple
Range Very Huge: Default Color White
🔹 RSI Group Settings
Hi/Low Color: Change the Color of that group.
Start/End: The Start and End range of this RSI color. Example if start = 5 and end = 10 the RSI of 5,6,7,8,9,10 will be displayed on the chart for that color, if any of does RSI goes above or bellow the boundary a dot is displayed on that candle.
Delay: The RSI needs to be above or bellow a boundary for x number of candles before displaying a dot. For example if delay = 2 and the RSI is over = 70 for 2 candles then it will display a dot.
Under/Over: Boundaries that indicate when to draw a dot, if over = 70 and RSI crosses above 70 a dot is displayed.
🔹 Show
Section that allows you to disable RSI grounds you dont want to see, this also removes them from the alert signal generated.
Show Low: Show or disable Low RSI dots
Show High: Show or disable High RSI dots
🔶 ALERTS
Alert for all New RSIs Dots Created in real time
The alert generated depends on what groups are showing or not, if the green group is disabled for example the alert will not be generated.
🔶 Warning
When a dot shows up it can continue moving. For example if a purple dot shows itself above a 15 minute candle, if that candle/price continue to extend up the dot will move up with it.
Dots can also disappear occasionally if the RSI moves in and out of a boundary within that candles life span.
🔶 Community
I hope you guys find this useful, if you have any questions or feature requests leave me a comment! Take care :D
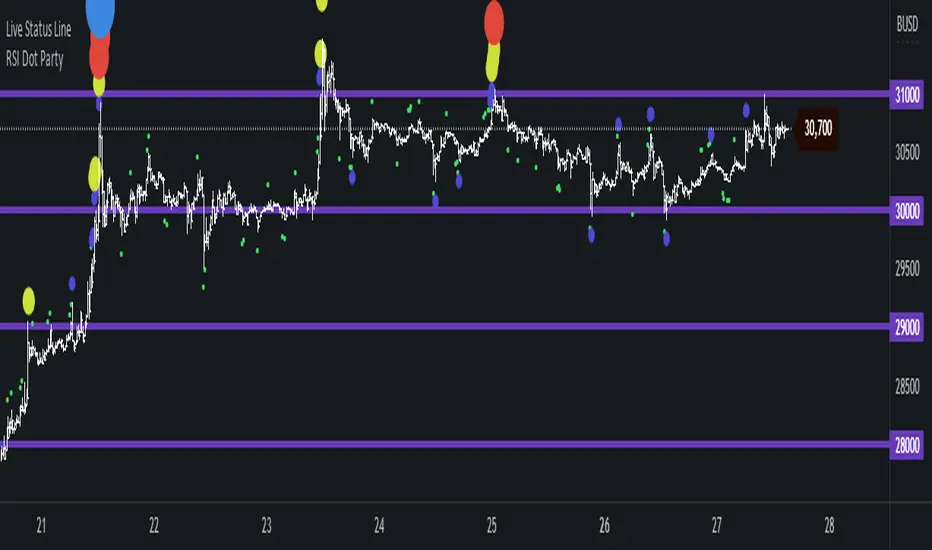
Statistics TableThis script display some useful Statistics data that can be useful in making trading decision.
Here the list of information this script is display in table format.
You can change each and every single ema and rs length as per your need from setting.
1) close difference from first ema
2) close difference from second ema
3) close difference from third ema
4) close difference from fourth ema
5) difference between first and second ema
6) difference between second and third ema
7) difference between first and third ema
8) volume up down ratio
9) ATR/ADR %
10) volume pocket pivot count
11) daily closing range
12) weekly closing range
13) close difference from 52week high
14) close difference from 52week low
15) close difference from All time high
16) close difference from All time low
17) rs line above or below first rs ema
18) rs line above or below second rs ema
19) rs line above or below third rs ema
20) rs line above or below fourth rs ema
21) first rs value
22) second rs value
23) third rs value
24) fourth rs value
25) difference between previous first rs length days change % and current first rs length days change %
26) difference between previous second rs length days change % and current second rs length days change %
27) difference between previous third rs length days change % and current third rs length days change %