All in One Strategy no RSI Label - For higher dollar cryptoThis is the All in One Strategy without the RSI suggestion label that will work well for any of the crypto currencies trading above $500 so the overlay shows up better. I am using ETH as an example on this.
Based on some comments on my previously published script that has been replaced I have added Alert Conditions to this version that can be used in other bots. You can also copy and paste these alert conditions into the other All in One script I published for the lower priced cryptocurrencies.
To use the alert conditions I have in here, you will need to convert this strategy into a study to do so. Delete the entry and exit logic at the end (lines 299 through 351), delete line 18 and paste the following in place of line 18:
study(shorttitle='Ain1 No Label',title='All in One Strategy no RSI Label', overlay=true, scale=scale.left)
Here are the settings to mimic what you see here in the back test strategy I am publishing. Remember that previous results do not guarantee future results.
Chart Time = 30 Minutes (if you didn't read my original All in One post, read it. Shorter isn't better. You lose your money faster in a shorter amount of time and I learned that the hard way)
Start Time = 1 April 2021 00:00
End Time = 31 December 2021 00:00
Trade Type = Long/Short
Stop Loss % = 20.1
Take Profit % = 14.57
RSI Length = 20
Overbought = 44
Oversold = 45
EMA Fast Length = 5
EMA Slow Length = 15
Overbought Lookback Minimum Value = 62
Overbought Lookback Bars = 3
Oversold Minimum Value = 43
Oversold Lookback Bars = 5
Source = Close
Max Lookback Period = 5
Use EMA Only = True (check the box)
K = 9
D = 17
K Mode = SMA
High Source = ohlc4
Low Source = ohlc4
Properties - Starting Amount is $3500, everything else is the same.
Any questions, feel free to ask. I will answer as soon as I can.
Cari dalam skrip untuk "17个交易日涨幅第一的股票(非新股)有哪些"

Bear & Bull Zone Signal StrategySince I love to mix and match, here is something fresh and that actually works on the breakout of Ethereum without losing your ass on lagging indicators.
It blends some of the nice parts of my previous scripts while moving to big boy pants with a twist on the Fibonacci retracement using SMA and EMA at multiple levels to do a sanity check.
Is it too good to be true? Nope, just what happens when a Solution Architect starts messing around with crypto and applies engineering and mathematics to the mix. You get a strategy that really doesn't have high profit losses when you tweak it just the right way.
What's the right tweak you ask?
1. Start with a 30 minute timeframe and set your window start date to the date the market began the bear or bull run
2. Make sure you can see your strategy performance window (not the graph one)
3. Set Stop Loss and Target Profit to 50%
4. Use your mouse wheel or up and down arrows and mess around with the RSI, go down one at a time but no lower than 7. Whichever value displayed the highest long or short gain is the one to pick.
5. Now select long or short only based on whichever one shows the highest gain.
6. Now go to K and D, leave K as 3 and check what happens when D is 4 or 5. Leave D at the value that gives you the highest gain.
7. Now go to EMA Fast and Slow Lengths. Leave Fast at 5 and check what happens when the Slow is moved up to 11 or 12, do the gains go up. If not, check what happens when Slow is moved down to 9, 8, or 7. Whichever gives you the highest gain, leave it there. Now go mess with the fast length, keep in mind that fast must always be less than slow. So check values down to 3 and up to 6. Same concept, mo money...leave it be.
8. Now go mess with the Target Profit, I start at 5, hit enter, then go to 7, hit enter, then 9...up by 2 until I get to 21 to make sure I don't hastily pick a low one and always keep in mind between which values the gain switched from high to low. For example, in this example I published at 11 it was $5k and at 13 it was $3700 for the gains. So after I got up to 21 I went back to 11 and started going up by 0.01 steps until the value dropped, which was at 11.19 so I set it at 11.18.
9. Now stop loss is trickier, you've maximized the gains, which means if you set the stop loss at a low value you will sacrifice gains. Typically by this point your loss is less than 10% with this script. So, my approach is to find the value where the stop loss doesn't change what I've tweaked already. In this example, I did the same start at 5 and go up by 2 and saw that when I went to 17 it stopped changing. So I started going back down by 0.5 and saw at 15.5 the gains went lower again. Now I started going back up in steps of 0.01 and at 15.98 it went back to the high gain I already tweaked for. I kept stop loss there and unleashed the strategy on ETH.
So far so good, no bad trades and it's been behaving pretty well.

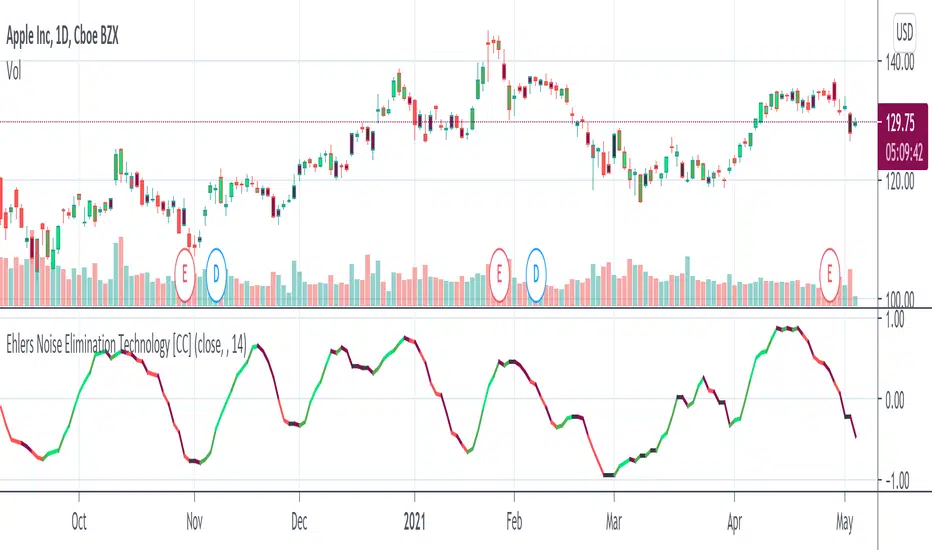
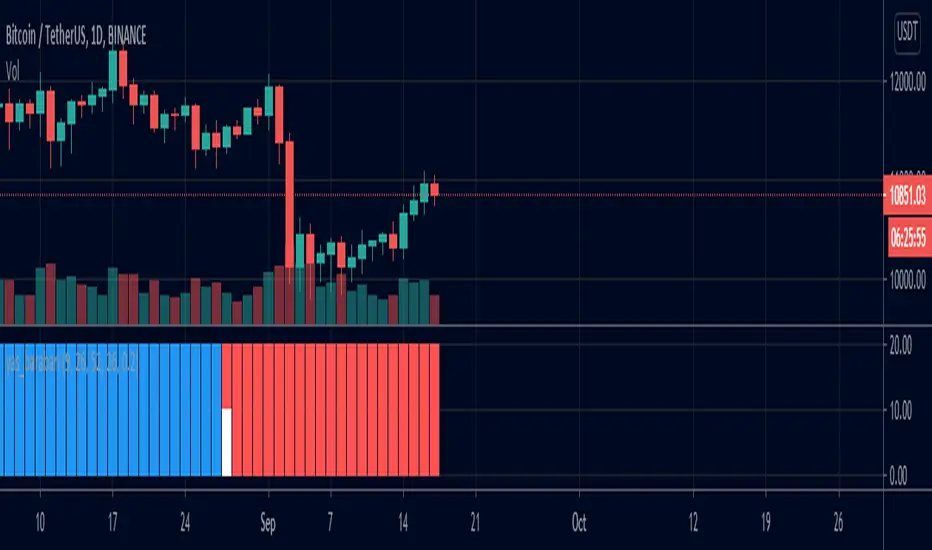
Ehlers Noise Elimination Technology [CC]The Noise Elimination Technology Indicator was created by John Ehlers (Stocks and Commodities Dec 2020 pg 17) and he created this indicator to be used with his version of RSI but I think it works well with any price data or any indicator really.
I'm trying a new signal system due to a request from @luckyCamel58789 so let me know what you think. I now differentiate between a buy and a strong buy when the indicator increases over itself twice and vice versa. Dark green is a strong buy and light green is a regular buy. Dark red is a strong sell and light red is a regular sell.
Let me know what indicators you would like to see me publish!
Exploring UnicodeThis script demonstrates how to display Unicode characters and symbols, including emoji, in Pine:
• Part 1 displays multi-line labels on hi/lo pivots.
• Part 2 displays price/volume bumps using small up/down arrows plotted with plotchar() .
• Part 3 detects bounces and uses plotshape() to mark them.
You can use our `f_bounceFrom()` function from this part as confirmation for signals in your strategies.
Note that the labels displayed on pivots with the code in Part 1 are plotted in the past. In realtime, they would only appear where they are after 50 bars have elapsed from that point. The other plots are plotted on the bar where their conditions are detected.
You can display thousands of Unicode characters and symbols using Pine. As you can see with our script, it is very easy to do so. The challenge will often be to find the exact symbols you are looking for. Many websites exist to help you explore Unicode characters or symbols. The PineCoders Resources page contains a section presenting a few of them.
Duyck has a Unicode font function script containing functions to convert strings to monospaced Unicode representations. TradingView uses the Trebuchet font for most of its text, including text displayed with Pine scripts. While its numerals are monospace and will align vertically in labels text, Duyck's functions will be handy when you need to convert characters to a monospaced form, so they also align vertically in multi-line labels.
What is Unicode?
Unicode is to character encoding what Wikipedia is to knowledge; it holds codes to a good proportion of the characters or symbols used by humans, past or present. In the early days of computing, environments from different manufacturers often used different character encoding schemes, making transport between them difficult. Unicode solves that challenge. It is a comprehensive encoding scheme that visionaries from Xerox and Apple came up with in the late 80's. The addition of members from the Research Libraries Group, Sun Microsystems, Microsoft, Next and Metaphor created the "Unicode working group" and later, the Unicode Consortium , which continues to improve and manage the Unicode standard.
Theoretically, Unicode encodes values representing characters or glyphs —not their pictorial representations. The letters "A" or "a", or the blue heart emoji "💙" are each represented by a Unicode value. In practice, however, there are many different versions of the Latin alphabet in Unicode. That is how our low pivot label can display different representations of the letters "ITV". The exact rendition of Unicode symbols on a specific device is left to equipment manufacturers and typeface designers.
The current Unicode space is comprised of 17 planes of 65,536 characters each, which allows for more than one million code points . Planes are further divided into character blocks , which typically hold a character set corresponding to one script—or language. Emoticons are in the character block starting at U+1F600.
Look first. Then leap.

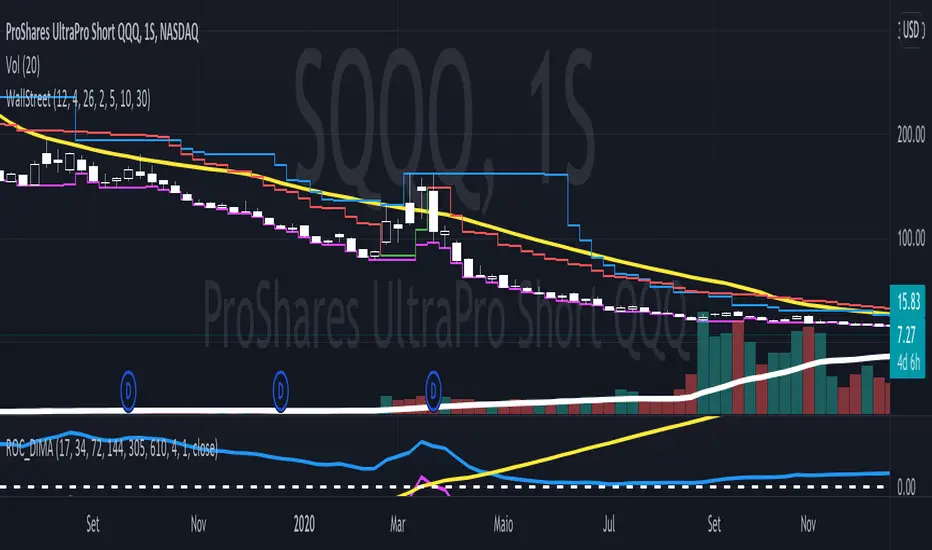
Follow Trend - Wall Street StrategyIt is a mix of three common indicators, they are The High band level of Donchian Channel, 6 emas (17, 34, 72, 144, 200 and 305), and 2 VStop with different multipliers.
We search stocks are going higher and higher each time. So we look at the High-level Donchian band and if the price made a little correction and didn't touch the VStop indicator and, the price is higher than all the ema's. So we try to buy the stocks when it pass through the last highest price.
The Vstop-short we use to stocks and commodities.
The VStop-long, we use to Bonds and Reits.
In order to help, there is a triangle when the price crossover any VStop, at least the half of Donchian period.
Trading View's Standard Color Palette, by @BlueJayBird- Simple color palette for Trading View.
- It works correctly on timeframes lower than 1h. Move it to the side so you can see the whole palette.
- All 17 standard TV colors are there, with fillers at 60 transparency (or 40 % opacity).
- You can custom the colors to your own colors, and use it as a palette color reference.
Additional information: kodify.net

Ichimoku Kinkō HyōThe Ichimoku Kinko Hyo is an trading system developed by the late Goichi Hosoda (pen name "Ichimokusanjin") when he was the general manager of the business conditions department of Miyako Shinbun, the predecessor of the Tokyo Shimbun. Currently, it is a registered trademark of Economic Fluctuation Research Institute Co., Ltd., which is run by the bereaved family of Hosoda as a private research institute.
The Ichimoku Kinko Hyo is composed of time theory, price range theory (target price theory) and wave movement theory. Ichimoku means "At One Glace". The equilibrium table is famous for its span, but the first in the equilibrium table is the time relationship.
In the theory of time, the change date is the day after the number of periods classified into the basic numerical value such as 9, 17, 26, etc., the equal numerical value that takes the number of periods of the past wave motion, and the habit numerical value that appears for each issue is there. The market is based on the idea that the buying and selling equilibrium will move in the wrong direction. Another feature is that time is emphasized in order to estimate when changes will occur.
In the price range theory, there are E・V・N・NT calculated values and multiple values of 4 to 8E as target values. In addition, in order to determine the momentum and direction of the market, we will consider other price ranges and ying and yang numbers.
If the calculated value is realized on the change date calculated by each numerical value, the market price is likely to reverse.
転換線 (Tenkansen) (Conversion Line) = (highest price in the past 9 periods + lowest price) ÷ 2
基準線 (Kijunsen) (Base Line) = (highest price in the past 26 periods + lowest price) ÷ 2
It represents Support/Resistance for 16 bars. It is a 50% Fibonacci Retracement. The Kijun sen is knows as the "container" of the trend. It is prefect to use as an initial stop and/or trailing stop.
先行スパン1 (Senkou span 1) (Lagging Span 1) = {(conversion value + reference value) ÷ 2} 25 periods ahead (26 periods ahead including the current day, that is)
先行スパン2 (Senkou span 2) (Lagging Span 2) = {(highest price in the past 52 periods + lowest price) ÷ 2} 25 periods ahead (26 periods ahead including the current day, that is)
遅行スパン (Chikou span) (Lagging Span) = (current candle closing price) plotted 26 periods before (that is, including the current day) 25 periods ago
It is the only Ichimoku indicator that uses the closing price. It is used for momentum of the trend.
The area surrounded by the two lagging span lines is called a cloud. This is the foundation of the system. It determines the sentiment (Bull/Bear) for the insrument. If price is above the cloud, the instrument is bullish. If price is below the cloud, the instrument is bearish.
-
The wave theory of the Ichimoku Kinko Hyo has the following waves.
All about the rising market. If it is the falling market, the opposite is true.
I wave rise one market price.
V wave the market price that raises and lowers.
N wave the market price for raising, lowering, and raising.
P wave the high price depreciates and the low price rises with the passage of time. Leave either.
Y wave the high price rises and the low price falls with the passage of time. Leave either.
S wave A market in which the lowered market rebounds and rises at the previous high level.
There are the above 6 types but the basis of the Ichimoku Kinko Hyo is the N wave of 3 waves.
In Elliott wave theory and similar theories, basically there are 5 waves but 5 waves are a series of 2 and 3 waves N, 3 for 7 waves, 4 for 9 waves and so on.
Even if it keep continuing, it will be based on N wave. In addition, since the P wave and the Y wave are separated from each other, they can be seen as N waves from a large perspective.
-
There are basic E・V・N・NT calculated values and several other calculation methods for the Ichimoku Kinko Hyo. It is the only calculated value that gives a concrete value in the Ichimoku Kinko Hyo, which is difficult to understand, but since we focus only on the price difference and do not consider the supply and demand, it is forbidden to stick to the calculated value alone.
(The calculation method of the following five calculated values is based on the rising market price, which is raised from the low price A to the high price B and lowered from the high price B to the low price C. Therefore, the low price C is higher than the low price A)
E calculated value The amount of increase from the low price A to the high price B is added to the high price B. = B + (BA)
V calculated value Adds the amount of decline from the high price B to the low price C to the high price B. = B + (BC)
N calculated value The amount of increase from the low price A to the high price B is added to the low price C. = C + (BA)
NT calculated value Adds the amount of increase from the low price A to the low price C to the low price C. = C + (CA)
4E calculated value (four-layer double / quadruple value) Adds three times the amount of increase from the low price A to the high price B to the high price B. = B + 3 × (BA)
Calculated value of P wave The upper price is devalued and the lower price is rounded up, and the price range of both is the same.
Calculated value of Y wave The upper price is rounded up and the lower price is rounded down, and the price range of both is the same.

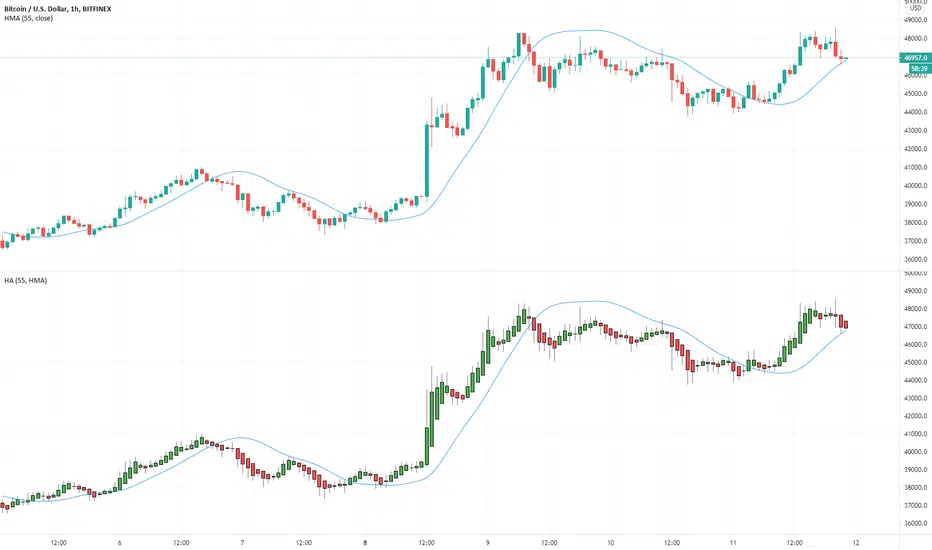
Multiple Moving Averages for Heikin Ashi I want to give credits to @QuantNomad, i got the heikin ashi part of the script from this open script /0iKy7lyG-QuantNomad-Heikin-Ashi-PSAR-Strategy/;
and to the other guy that provided a 17 type of moving average script open source but i forgot his name, if someone remember please tell me.
My idea was to see how the different types of moving averages behaves in a Heinkin Ashi chart, you can change to more than 15 types of Moving Average and use it the way you want it.
For the source of the moving averages i used a simple moving average of 1 period using the high of the heikin ashi candle, low of it and divided by 2 as the source of the different types of moving averages.
Different types of Moving Averages
Moving Average Types
SMA ---> Simple
WMA ---> Weighted
VWMA ---> Volume Weighted
EMA ---> Exponential
DEMA ---> Double EMA
ALMA ---> Arnaud Legoux
HMA ---> Hull MA
SMMA ---> Smoothed
LSMA ---> Least Squares
KAMA ---> Kaufman Adaptive
TEMA ---> Triple EMA
ZLEMA ---> Zero Lag
FRAMA ---> Fractal Adaptive
VIDYA ---> Variable Index Dynamic Average
JMA ---> Jurik Moving Average
T3 ---> Tillson
TRIMA ---> Triangular
The type of moving average you select will appear in a separated chart with Heikin Ashi candles, like in the image above.
Movers and ShakersHello traders
For today, I wanted to translate a FXCM/LUA script to Pinescript
Source: fxcodebase.com
This indicator creates a list of available currency pairs,
Displays Pip or the percentage change for the defined time frames.
I added a lookback option to compare the current close value to the lookback candle open value
Possible optimizations
Throwing a few ideas:
1) Upgrading into a screener for multiple assets like this one: www.investing.com
2) Display more information like the high, low, volume
Keep in mind we're allowed to only 40 security calls per script.
That's said, a security call returning a tuple (see below), is counted like 1 security call. Pretty cool huh?
= security(syminfo.tickerid, "D", )
Special thanks
Special thanks to @PineCoders for the f_print function, used in this script.
All the BEST my besties
Dave

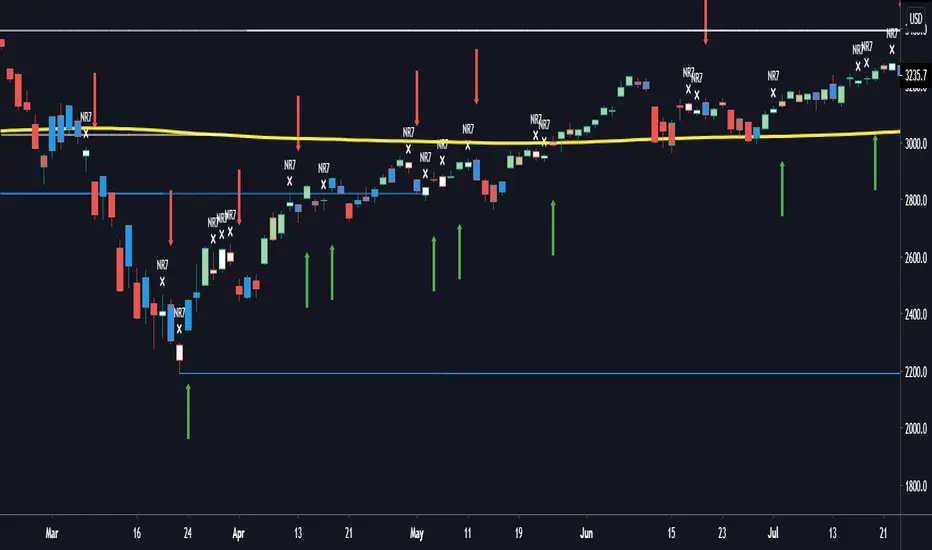
NR7 Indicator Based on Thomas Bulkowski's TheoriesThis NR7 indicator was built on the concept by Thomas Bulkowski and his ThePatternSite. NR7 is based on high to low price range (true range) that is the smallest of the prior 6 days (7 days total), when one NR7 shows, it means that today's candle body (low to high) is the narrowest of the past 7 days. Then if the current close is higher than the NR7's high, we call it a bullish breakout; and if the current close is lower than the NR7's low, we call it a bearish breakout. Regardless the direction, once the current close price goes above or below the high or low of the NR7 candle, we call it a "breakout" in this strategy. Bulkowski suggested on his website that only gave 7 calendar days (NOT trading days) for the symbol to breakout after NR7 occurs, and if the underlying asset does not breakout within 7 calendar days after one NR7 occurs, we would abandon this NR7 signal and start recounting again.
Since most securities/indexes do not trade on the weekends and have no data available, I switched 7 calendar days breakout limit to 5 trading days breakout limit, which will work on most assets. However, if you are trading cryptocurrencies or forex which have data on the weekends, feel free to add 2 more days to finish the NR7 count, all you have to do is to add "Buy6", "Buy7", "Sell6" and "Sell7" under line 11 and line 17, then add the senarioes under those "if" statements.
Every "NR7" will show up on the chart with a cross symbol and text next to it, then green arrowups show bullish signals and red arrowdowns show bearish signals. Bulkowski also added a "CPI" index on his NR7 strategy, this indicator does not include that "CPI equation" for simplicity purposes and other time frame tradings other than just weekly signals. Please like and share this script, let me know if any questions, thanks!
Nubia - Auto Midas Anchored VWAP [xdecow]This indicator looks for the highs and lows using the highest / lowest of 4 different periods. The default values are 17, 72, 305 and 1292 inspired by BO Williams phicube fractals.
The indicator will show anchored vwaps from those 8 dynamic points (4 tops and 4 bottoms).
A true trend is defined when 4 fractals line up without much opposite resistance (only the two smallest opposing vwaps).
When the price is between several vwaps it is a sign of consolidation or pullback. You can use larger timeframes to check for possible targets in large consolidations and pullbacks.

yas_barabariby this indicator u can find where the tenken-sen and kijen-sen is equal
yellow bar means the t/k is equal
red bar means tenken is under kijen-sen
blue bar means kijen is below tenken-sen
white bar on top means t+17 equal kijen-sen
Alternative Daily Reference Points for Intra-hour ChartsThis is a different version of my www.tradingview.com used high, lows and pivots. One problem with pivot points is the number of calculation methods. The alternative version shows historical lows, closes, highs one basic period back.
► On lower timeframes - hour or less - this will show High, Low and Close from the previous day, two days ago, the previous week and two weeks ago and VWAP.
► On 1h daily reference points need to be enabled. On higher timeframes, daily reference points will not be shown. On the daily chart, weekly levels need to be enabled to still show and will be disabled on all higher periods.
► It is configured only for normal timeframes. If you use something like 17-minutes timeframe, you will have to allow this timeframe in the code.
Bear in mind, using all lines at the same time can be a little confusing and price doesn't react to every one of them. You can probably disable lows in the uptrend or scratch closes to simplify your chart.
Have a great trade!

Pivot Points 17 - StandardDisclaimer!
-This indicator doesn't tell you the market condition (BUY or SELL)
Cons!
- Totally dependent on your knowledge
Pros!
- Projects the Key Levels of a single time frame on the chart
Usage!
- Watch out for rejections at these levels
- Identify breakouts at these levels with strong confirmation like RETEST (as Level Role Reversal)

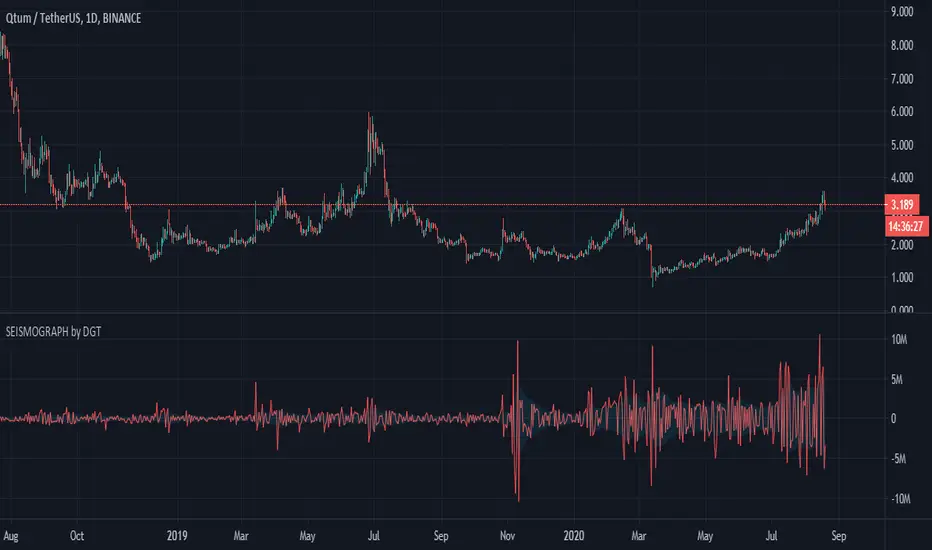
Earthquake Effect by DGTInstitutional investors have a profound impact on financial instruments prices because of the large volume, and their trading activities can greatly impact the price of financial instruments. They sometimes may split trades over time in order to not make a material impact and of course not to decrease liquidity to the point where there may be no one to take the other side of the trade.
Institutional investors (Smart Money) may create an Elephant Effect on the prices of financial instruments, and this study aims to display by emphasizing high volume changes
In the memory of the North Anatolian Earthquake that struck on August 17, 1999, that we remember with pain today, and similarities of plotting outcomes to seismograph plotting I preferred to name this study as Earthquake Effect (SEISMOGRAPH)
Disclaimer:
Trading success is all about following your trading strategy and the indicators should fit within your trading strategy, and not to be traded upon solely
The script is for informational and educational purposes only. Use of the script does not constitute professional and/or financial advice. You alone have the sole responsibility of evaluating the script output and risks associated with the use of the script. In exchange for using the script, you agree not to hold dgtrd TradingView user liable for any possible claim for damages arising from any decision you make based on use of the script
yashi guys
this indicator contain two lines :
the conversion line shifted 17 bar and base line shifted 26 bar
with this indicator u can found where the komo switched and found some potential reversal pivot point
enjoy : Ahmad

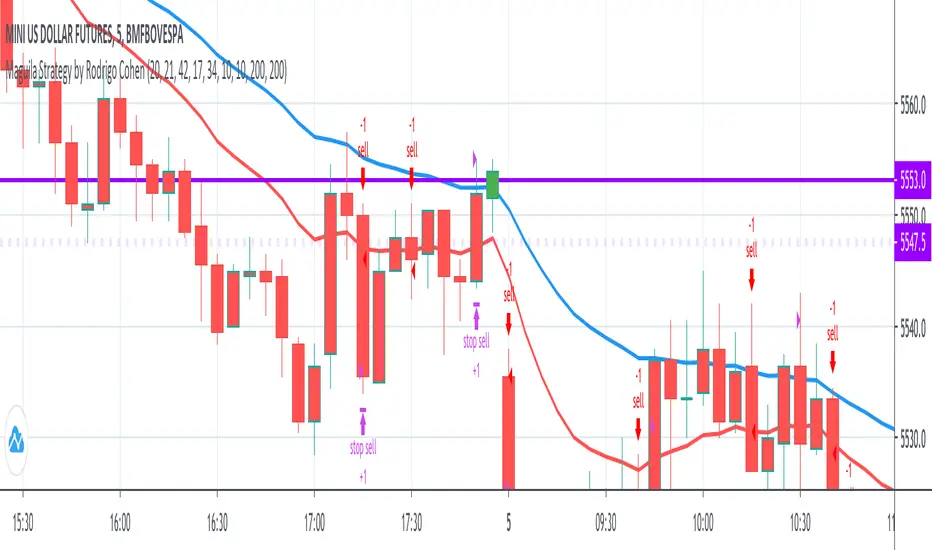
Maguila Strategy by Rodrigo CohenREAD BEFORE USE!!!
!!!ALERT!!!! THIS CODE ONLY WORKS WITH WDO AND WIN , BOTH WITH TIMEFRAMES 1 MINUTE AND 5 MINUTE.
This is a test to the Maguila strategy created by Rodrigo Cohen.
This code MUST be validaded by Rodrigo Cohen, use ONLY for tests.
Some results are different from Cohen's videos, so the McGuinley indicator needs some ajustments.
FUTURES: WIN , WDO
TIME FRAME: 1 Minute (also works in 5 minutes)
INDICATORS: McGinley Dynamic accompanied by the Exponential Moving Average coloring rule of 21 and 42 periods
MARKET TYPE: In trend (up or down)
INPUT:
1. When buying (long) = Market in an upward trend, the average of 21 crosses that of 42 upwards. When the price returns to the average of 21, wait for a positive candle in the Maguila's color and buy a break from the maximum of this signal candle.
2. On sale (short) = Downtrend market, the average of 21 crosses that of 42 downwards. When the price returns to the average of 21, wait for a negative candle in the Maguila's color and sell when the minimum of this signal candle breaks.
GAIN and LOSS are technical.
DEFAULT VALUES:
Averages:
- 1 minute - EMA 21 and EMA 42
- 5 minute - EMA 17 and EMA 34
Gains and Loss:
- WDO - 10 points
- WIN - 200 points
TA Basics: further "Steps" with our Moving AverageSo far in this series of posts, we have worked thru creating a basic zero-lag moving average, then moved forward all the way to coding a "Fibonacci" Weighted Moving Average.
in this post we take a look at a technique that can help traders minimize noise in the underlying data and get better insight on the changes that are happening in the data series represented by the moving average. we'll look at adding "stepping" to our Fibonacci Moving Average as an example. we introduce the Stepping Fibonacci Moving Average , or Step_FiMA
note that you can use the same technique with any plot you may have. feel free to copy or leverage the relevant parts of the script - the script is commented to make this easier.
How is this useful?
==================
with "stepping", you get your indicator to "round" the outcome into pre-specified bands or ranges. this works very similar to how, for example, range or Renko charts work. you can easily see the difference in the chart above once we look at a non-stepped and a stepping moving average of the same length side-by-side
the more granular your timeframe is, you will see the effect of the stepping clearer - here's how the same chart looks when we go into the 1-hr aggregation
Notes about this script
====================
there are couple of pieces i wanted to highlight in the script if you plan to use some of it :
1 - the step(x) function is meant to try to automatically pick the best "suitable" step size based on the range of the underlying series (for example, the closing price). these ranges i included here in the code are just my own "best choices" - you are totally welcome to adjust these ranges and the resulting step size to your own preference
2 - we applied the stepping as a user-choice. user can choose a manual entry, or "0" to get the code to automatically pick the step size, or enter -1 (or actually any value below zero) to cancel the stepping option altogether - this gives us some flexibility on how to use the stepping in an indicator
3 - very important (and somehow confusing): on the "rounding" approach:
the magic math formula that actually creates the stepping is this one
result = round(input / step) * step
now, this tells the script to "round" the result up or down (the basic rounding) -- so for example, a price of 17 with a step of 5 would be rounded (down) to 15, where as a price of 18 would be rounded "up" to 20 -- this is not the way some of us would expect or want, cause the price never reached 20 and they would want an 18 to still be rounded to 15 - and the stepping line not to show 20 *until* the price actually hits or exceeds 20 -- in that case, you would need to replace the function "round" with the function "floor" --
so the new formula becomes: floor(input / step) * step
-- in an ideal world, we can make this rounding choice a user-option in the settings -- maybe in an improved version
4 - we kept the smoothing option, and it takes place before the stepping is applied - we continue to use that smoothing to further minimize the level changes in the FiMA line.
I hope you find this script useful in your journey with technical analysis and DIY scripting, and good luck in your trading.

FUNCTION: Goertzel algorithm -- DFT of a specific frequency binThis function implements the Goertzel algorithm (for integer N).
The Goertzel algorithm is a technique in digital signal processing (DSP) for efficient evaluation of the individual terms of the discrete Fourier transform (DFT).
In short, it measure the power of a specific frequency like one bin of a DFT, over a rolling window (N) of samples.
Here you see an input signal that changes frequency and amplitude (from 7 bars to 17). I am running the indicator 3 times to show it measuring both frequencies and one in between (13). You can see it very accurately measures the signals present and their power, but is noisy in the transition. Changing the block len will cause it to be more responsive but noisier.
Here is a picture of the same signal, but with white noise added.
If you have a cycle you think is present you could use this to test it, but the function is designed for integration in to more complicated scripts. I think power is best interrupted on a log scale.
Given a period (in bars or samples) and a block_len (N in Goertzel terminology) the function returns the Real (InPhase) and Quadrature (Imaginary) components of your signal as well as calculating the power and the instantaneous angle (in radians).
I hope this proves useful to the DSP folks here.

Custom EMA AngleThis script shows the angle of 6 EMAs to perform trade analysis. The EMA angle is also known as its Rate Of Change ( ROC ). The 6 EMAs (I, II, III , IV, V and VI ) default lengthes come from one of the Fibonacci Phi^3 and Phi^3/2 sub series (17, 34, 72, 144, 305 and 610), but can be changed to any values, particularly to the traditionally used 20, 40, 50, 100, 200 and 300. Up to my knowledge, Fibonacci Phi^3 and Phi^3/2 sub series lengthes were first proposed by Bo Williams.
Angle calculation is performed by calculating the tangent over a delta interval. Normalization is required to make the angle independent of the price range.
This script is meant to be used together with the corresponding EMAs on the candle pane. Non normalized view shows a more realistic angle condition but, if intended to be used with the CEMAS indicator, normalized view should be used.

Custom EMA + FIBOThis script combines 6 EMAs with 3 Donchian Channel 78.6% and 21.4% intermediary level lines to perform trade analysis. The 6 EMAs (I, II, III , IV, V and VI ) default lengthes come from one of the Fibonacci Phi^3 and Phi^3/2 sub series (17, 34, 72, 144, 305 and 610), but can be changed to any values, particularly to the traditionally used 20, 40, 50, 100, 200 and 300. Up to my knowledge, Fibonacci Phi^3 and Phi^3/2 sub series lengthes were first proposed by Bo Williams.
The 3 Donchian Channels used have default lengthes 72, 305 and 1292, calculated after the first length default value of 72. For each of the 3 Donchian Channels only an upper line, set by default at 78.6%, is plotted in green and its complement, set to 21.4%, is plotted in red. When the closing price is above 3 green lines, we say it is Forbidden to Sell ( PV ), and when the closing price is below 3 red lines, we say it is Forbidden to Buy ( PC ). Those conditions are flagged on the chart. These PV-PC conditions were, up to my knowledge, first proposed by Bo Williams.

Custom EMA StrategyThis script combines 3 EMAs with Bollinger Bands to build a trend based trading strategy. The 3 EMAs (I, II and III ) default lengthes come from one of the Fibonacci Phi^3/2 sub series (17, 72 and 305), but can be changed to any values, particularly to the traditionally used 20, 50 and 200. Bollinger Band length is set to the same length as EMA I. Up to my knowledge, Fibonacci Phi^3/2 sub series lengthes were first proposed by Bo Williams.
Buy Recommendations happen when src (close) > EMA I > EMA II, EMA I angle > 0 degree, EMA II angle > -1 degree and EMA III angle > -1 degree. My simulations have show that -1 degree usage results in better returns than zero degree.
Top Buy Recommendations happen when, besides Buy recommendation conditions are met, src (close) > HBand, the Bollinger Band High Band.
Sell Recommendations come in 3 flavors: Short Term (close < EMA I), Medium Term (close < EMA2) and Long Term ( EMA I < EMA II).
Angle calculation is performed by calculating the "normalized" tangent over a delta interval. Normalization is required to make the angle independent of the price range.

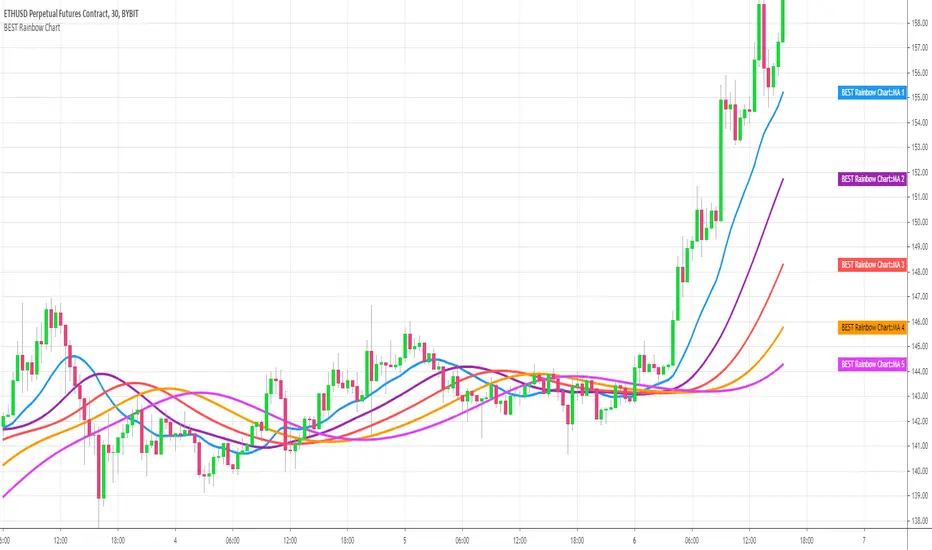
BEST Rainbow ChartHello traders
This script is a Pinescript adaptation of this FXCM/LUA script
Draws a flexible number of moving averages between 1 and 5 - with a end result looking like a rainbow
Formula
Each Moving Average is defined as a Moving Average of the previous MA
The first MA is based on candle close
MA = MA of Price
MA = MA of MA
....
MA = MA of MA
Bonus
You can select the MA type (EMA, SMA, SMMA, TEMA, DEMA, TMA, ALMA, VWMA, ...) and the MA period shared across all the moving averages
Scaling
If you have any issue with your scaling, you may follow this quick tutorial
Hope you'll like it because it looks nice on your chart :)
Dave