Support and Resistance Signals MTF [LuxAlgo]The Support and Resistance Signals MTF indicator aims to identify undoubtedly one of the key concepts of technical analysis Support and Resistance Levels and more importantly, the script aims to capture and highlight major price action movements, such as Breakouts , Tests of the Zones , Retests of the Zones , and Rejections .
The script supports Multi-TimeFrame (MTF) functionality allowing users to analyze and observe the Support and Resistance Levels/Zones and their associated Signals from a higher timeframe perspective.
This script is an extended version of our previously published Support-and-Resistance-Levels-with-Breaks script from 2020.
Identification of key support and resistance levels/zones is an essential ingredient to successful technical analysis.
🔶 USAGE
Support and resistance are key concepts that help traders understand, analyze and act on chart patterns in the financial markets. Support describes a price level where a downtrend pauses due to demand for an asset increasing, while resistance refers to a level where an uptrend reverses as a sell-off happens.
The creation of support and resistance levels comes as a result of an initial imbalance of supply/demand, which forms what we know as a swing high or swing low. This script starts its processing using the swing highs/lows. Swing Highs/Lows are levels that many of the market participants use as a historical reference to place their trading orders (buy, sell, stop loss), as a result, those price levels potentially become and serve as key support and resistance levels.
One of the important features of the script is the signals it provides. The script follows the major price movements and highlights them on the chart.
🔹 Breakouts (non-repaint)
A breakout is a price moving outside a defined support or resistance level, the significance of the breakout can be measured by examining the volume. This script is not filtering them based on volume but provides volume information for the bar where the breakout takes place.
🔹 Retests
Retest is a case where the price action breaches a zone and then revisits the level breached.
🔹 Tests
Test is a case where the price action touches the support or resistance zones.
🔹 Rejections
Rejections are pin bar patterns with high trading volume.
Finally, Multi TimeFrame (MTF) functionality allows users to analyze and observe the Support and Resistance Levels/Zones and their associated Signals from a higher timeframe perspective.
🔶 SETTINGS
The script takes into account user-defined parameters to detect and highlight the zones, levels, and signals.
🔹 Support & Resistance Settings
Detection Timeframe: Set the indicator resolution, the users may examine higher timeframe detection on their chart timeframe.
Detection Length: Swing levels detection length
Check Previous Historical S&R Level: enables the script to check the previous historical levels.
🔹 Signals
Breakouts: Toggles the visibility of the Breakouts, enables customization of the color and the size of the visuals
Tests: Toggles the visibility of the Tests, enables customization of the color and the size of the visuals
Retests: Toggles the visibility of the Retests, enables customization of the color and the size of the visuals
Rejections: Toggles the visibility of the Rejections, enables customization of the color and the size of the visuals
🔹 Others
Sentiment Profile: Toggles the visibility of the Sentiment Profiles
Bullish Nodes: Color option for Bullish Nodes
Bearish Nodes: Color option for Bearish Nodes
🔶 RELATED SCRIPTS
Support-and-Resistance-Levels-with-Breaks
Buyside-Sellside-Liquidity
Liquidity-Levels-Voids
Cari dalam skrip untuk "2020年国际黄金价格走势"

Predictive Ranges [LuxAlgo]The Predictive Ranges indicator aims to efficiently predict future trading ranges in real-time, providing multiple effective support & resistance levels as well as indications of the current trend direction.
Predictive Ranges was a premium feature originally released by LuxAlgo in 2020.
The feature was discontinued & made legacy, however, due to its popularity and reproduction attempts, we deemed it necessary to release it open source to the community.
🔶 USAGE
The primary purpose of this indicator is to provide potential support & resistance levels on the chart by estimating future trading ranges.
When the price reaches one of the upper/lower levels of the Predictive Ranges we can expect the price to reverse.
If the price exits the predicted range, new levels are given in real-time & they do not repaint. Higher "Factor" values allow returning longer term and wider ranges less susceptible to be exited.
🔹 Estimating Trend Directions
Users are able to easily estimate trend directions by looking at the central levels of the predictive ranges, which represent an estimate of the price central tendency.
If this central level increases it means the price is up-trending, if it is decreasing price is down-trending.
🔶 SETTINGS
Length: ATR Length used for the indicator calculation. Higher values will tend to return ranges of equal width.
Factor: Control the ranges width. Higher values will return less frequent ranges, each having a higher width.
Timeframe: Indicator timeframe output.
Source: Input source of the indicator. It is recommended to use input sources on the same scale as the price.

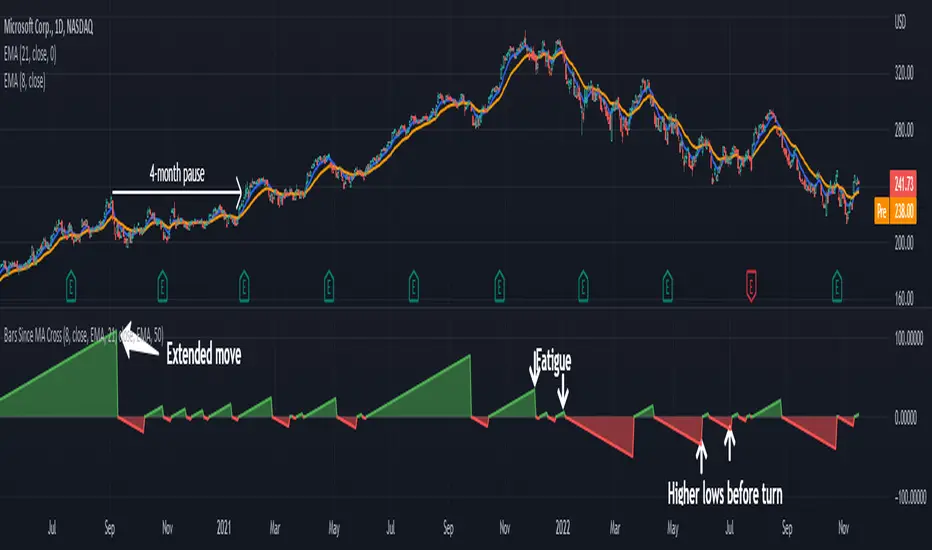
Bars Since MA Cross Can Help Trend FollowingMoving average crosses are popular signals for trend followers. Like many conditions, they tend to reverse after a certain amount of time. Today’s script is designed to help traders visualize and interpret these turns.
Bars Since MA Cross counts how many bars have passed since a fast-moving average crossed a slower MA. Bullish readings, with the faster MA above the slow, are plotted with positive numbers. The opposite is true for bearish conditions. Users can choose between simple, exponential and weighed average types. They can also mix them, comparing a fast EMA for a slower SMA, for example.
By default, it uses the 8- and 21-day EMAs.
This approach can help in a couple of ways. First, it can show divergences as a move weakens. Microsoft, in the example above, had a shorter bullish phase as it made new highs last December. This was followed by even briefer periods in January before the bear market took hold.
Likewise in May and June, Bars Since MA Cross showed shorter bearish periods before July’s counter-trend rally.
The second potential application is to know the age of a move. In this case look at September 2020. MSFT’s 8-day EMA was above its 21-day EMA for 108 days. The chart shows this was unusually long by previous examples, giving traders a sense the rally was getting long in the tooth. (MSFT would go the rest of that year without a new high.)
In conclusion, Bars Since MA Cross judges a move by its age and not its intensity. It’s a different approach that can sometimes help more than viewing simple price action.
TradeStation has, for decades, advanced the trading industry, providing access to stocks, options, futures and cryptocurrencies. See our Overview for more.
Important Information
TradeStation Securities, Inc., TradeStation Crypto, Inc., and TradeStation Technologies, Inc. are each wholly owned subsidiaries of TradeStation Group, Inc., all operating, and providing products and services, under the TradeStation brand and trademark. You Can Trade, Inc. is also a wholly owned subsidiary of TradeStation Group, Inc., operating under its own brand and trademarks. TradeStation Crypto, Inc. offers to self-directed investors and traders cryptocurrency brokerage services. It is neither licensed with the SEC or the CFTC nor is it a Member of NFA. When applying for, or purchasing, accounts, subscriptions, products, and services, it is important that you know which company you will be dealing with. Please click here for further important information explaining what this means.
This content is for informational and educational purposes only. This is not a recommendation regarding any investment or investment strategy. Any opinions expressed herein are those of the author and do not represent the views or opinions of TradeStation or any of its affiliates.
Investing involves risks. Past performance, whether actual or indicated by historical tests of strategies, is no guarantee of future performance or success. There is a possibility that you may sustain a loss equal to or greater than your entire investment regardless of which asset class you trade (equities, options, futures, or digital assets); therefore, you should not invest or risk money that you cannot afford to lose. Before trading any asset class, first read the relevant risk disclosure statements on the Important Documents page, found here: www.tradestation.com .
RSI with Slow and Fast MA Crossing Strategy (by Coinrule)This strategy utilises 3 different conditions that have to be met to buy and 1 condition to sell. This strategy works best on the ETH/USDT pair on the 4-hour timescale.
In order for the strategy to enter the trade, it must meet all of the conditions listed below:
ENTRY
RSI increases by 5
RSI is lower than 70
MA9 crosses above MA50
To exit a trade, the below condition must be met:
EXIT
MA50 crosses above MA9
This strategy works well on LINK/USDT on the 1-day timeframe, MIOTA/USDT on the 2-hour timeframe, BTC/USDT on the 4-hour timeframe, and BEST/USDT on the 1-day timeframe (and 4h).
Back-tested from 1 January 2020.
The strategy assumes each order is using 30% of the available coins to make the results more realistic and to simulate you only ran this strategy on 30% of your holdings. A trading fee of 0.1% is also taken into account and is aligned to the base fee applied on Binance.

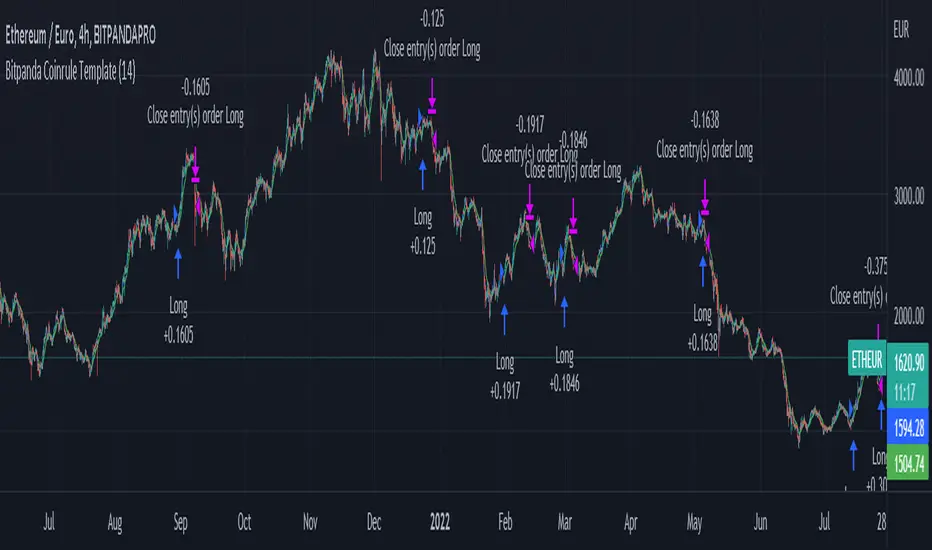
Bitpanda Coinrule TemplateThis strategy for Bitpanda on the Coinrule platform utilises 3 different conditions that have to be met to buy and 1 condition to sell. This strategy works best on the ETH/EUR pair on the 4 hour timescale.
In order for the strategy to enter the trade it must meet all of the conditions listed below.
ENTRY
RSI increases by 5
RSI is lower than 70
MA9 crosses above MA50
EXIT
MA50 crosses above MA9
This strategy works well on LINK/EUR on the 1 day timeframe, MIOTA/EUR on the 2 hour timeframe, BTC/EUR on the 4 hour timeframe and BEST/EUR on the 1 day timeframe (and 4h).
Back tested from 1 January 2020.
The strategy assumes each order is using 30% of the available coins to make the results more realistic and to simulate you only ran this strategy on 30% of your holdings. A trading fee of 0.1% is also taken into account and is aligned to the base fee applied on Binance.
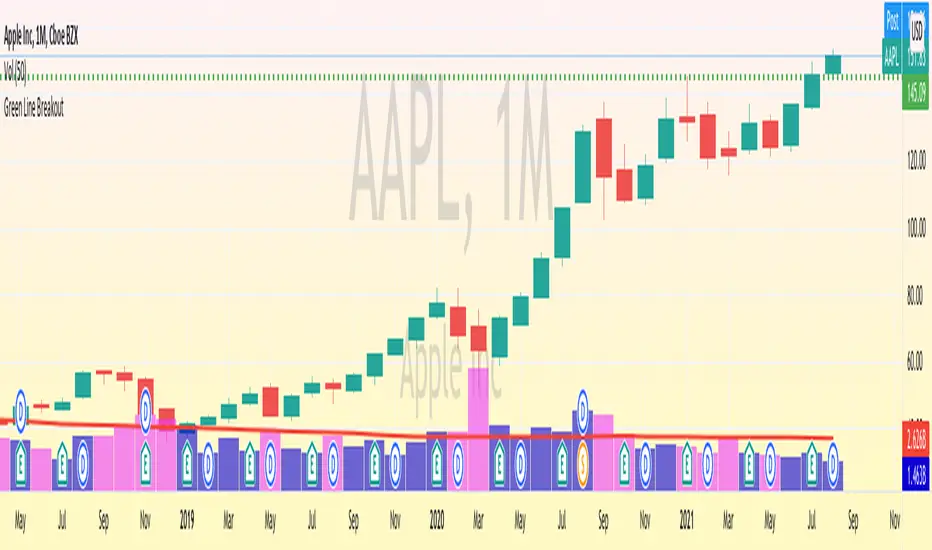
Green Line Breakout (GLB) - Public UseNOTE: This is public use - open source version of GLB published by me in Sep 2020. As Trading View is not allow unprotect script already shared, I am sharing it for anyone to use the script and make a copy.
========
This is an implementation of Green Line Breakout ( GLB ) which is popularized by Eric Wish through his Wishing Wealth Blog.
GLB indicator looks at a monthly chart for a stock that hit a new all time high recently and draw a green horizontal line at the highest price reached at any month, that has not been surpassed for at least 3 months.
In other words, this method finds stock that reached an all-time high and has then rested for at least three months. When a stock moves through the green line or is above its last green line, it is an indication of strong buying interest.
Read more about how to use the indicator in Wishing Wealth Blog.
Usage Explanation:
1. Set the time frame to Monthly for a stock and automatically a green dashed line appears based on the calculation explained above
2. If no GLB found for a stock, then green line appears at 0.0
2. If you set any other time frame other than Monthly, no Green Dashed line shown
Chanu Delta StrategyThis strategy is built on the Chanu Delta Indicator, which indicates the strength of the Bitcoin market. When the Chanu Delta Indicator hits “Delta_bull” and “Delta_bear” and closes the candle, long and short signals are triggered respectively. The example shown on the screen is a default setting optimized for a 4-hour candlestick strategy based on the Bybit BTCUSDT futures market. For the 15-minute candle, "Delta_bull=32", "Delta_bear=-31", "Source=hlc3" are best. You can use it by adjusting the setting value and modifying it to suit you.
If you use this strategy in conjunction with the Chanu Delta Indicator, it is convenient to anticipate alert signals in advance. Since the Chanu Delta Indicator represents the price difference based on the Bybit BTCUSDT futures market, backtesting is possible from March 2020.

Random Entries Work!" tHe MaRkEtS aRe RaNdOm ", say moron academics.
The purpose of this study is to show that most markets are NOT random! Most markets show a clear bias where we can make such easy money, that a random number generator can do it.
=== HOW THE INDICATOR WORKS ===
The study will randomly enter the market
The study will randomly exit the market if in a trade
You can choose a Long Only, Short Only, or Bidirectional strategy
=== DEFAULT VALUES AND THEIR LOGIC ===
Percent Chance to Enter Per Bar: 10%
Percent Chance to Exit Per Bar: 3%
Direction: Long Only
Commission: 0
Each bar has a 10% chance to enter the market. Each bar has a 3% to exit the market . It will only enter long.
I included zero commission for simplification. It's a good exercise to include a commission/slippage to see just how much trading fees take from you.
=== TIPS ===
Increasing "Percent Chance to Exit" will shorten the time in a trade. You can see the "Avg # Bars In Trade" go down as you increase. If "Percent Chance to Exit" is too high, the study won't be in the market long enough to catch any movement, possibly exiting on the same bar most of the time.
If you're getting the red screen, that means the strategy lost so much money it went broke. Try reducing the percent equity on the Properties tab.
Switch the start year to avoid/minimize black swan events like the covid drop in 2020.
=== FINDINGS ===
Most markets lose money with a "Random" direction strategy.
Most markets lose ALL money with a "Short Only" strategy.
Most markets make money with a "Long Only" strategy.
Try this strategy on: Bitcoin (BTCUSD) and the NASDAQ (QQQ).
There are two popular memes right now: "Bitcoin to the moon" and "Stocks only go up". Both are seemingly true. Bitcoin was the best performing asset of the 2010's, gaining several billion percent in gains. The stock market is on a 100 year long uptrend. Why? BECAUSE FIAT CURRENCIES ALWAYS GO DOWN! This is inflation. If we measure the market in terms of others assets instead of fiat, the Long Only strategy doesn't work anymore (or works less well).
Try this strategy on: Bitcoin/GLD (BTCUSD/GLD), the Eurodollar (EURUSD), and the S&P 500 measured in gold (SPY/GLD).
Bitcoin measured in gold (BTCUSD/GLD) still works with a Long Only strategy because Bitcoin increased in value over both USD and gold.
The Eurodollar (EURUSD) generally loses money no matter what, especially if you add any commission. This makes sense as they are both fiat currencies with similar inflation schedules.
Gold and the S&P 500 have gained roughly the same amount since ~2000. Some years will show better results for a long strategy, while others will favor a short strategy. Now look at just SPY or GLD (which are both measured in USD by default!) and you'll see the same trend again: a Long Only strategy crushes even when entering and exiting randomly.
=== " JUST TELL ME WHAT TO DO, YOU NERD! " ===
Bulls always win and Bears always lose because fiat currencies go to zero.
You're not underperforming a random number generator, are you?

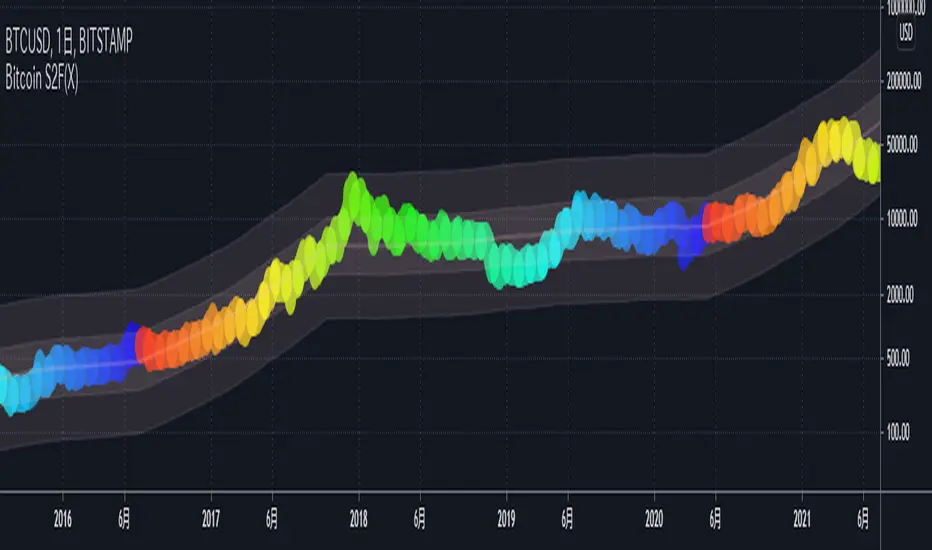
Bitcoin S2F(X)This indicator shows the BTCUSD price based on the S2F Model by PlanB.
We can see not only the S2F(Stock-to-Flow) but also the S2FX(Stock-to-Flow Cross Asset) model announced in 2020.
█ Overview
In this model, bitcoin is treated as comparable to commodities such as gold .
These commodities are known as "store of value" commodities because they retain their value over time due to their relative scarcity.
Bitcoins are scarce.
The number of coins in existence is limited, and the rate of supply is at an all-time low because mining the 2.2 million outstanding coins that have yet to be mined requires a lot of power and computing power.
The Stock-to-flow ratio is used to evaluate the current stock of a commodity (the total amount currently available) versus the flow of new production (the amount mined in a given year).
The higher this ratio, the more scarce the commodity is and the more valuable it is as a store of value.
█ How To View
On the above chart price is overlaid on top of the S2F(X) line. We can see that price has continued to follow the stock-to-flow of Bitcoin over time. By observing the S2F(X) line, we can expect to be able to predict where the price will go.
The coloured circles on the price line of this chart show the number of days until the next Bitcoin halving event. This is an event where the reward for mining new blocks is halved, meaning miners receive 50% fewer bitcoins for verifying transactions. Bitcoin halvings are scheduled to occur every 210,000 blocks until the maximum supply of 21 million bitcoins has been generated by the network. That makes stock-to-flow ratio (scarcity) higher so in theory price should go up.
The stock-to-flow line on this chart incorporates a 463-day average into the model to smooth out the changes caused in the market by the halving events.
I recommend using this indicator on a weekly or monthly basis for BITSTAMP:BTCUSD .
█ Reference Script
Bitcoin Stock to Flow Multiple by yomofoV
rocketLaunchI wanted to see if I could programmatically identify the conditions I saw just before Bitcoin broke its all-time high end of 2020. The signal picks up several rocket launch moments prior to launching which is quite cool. It also picks up a few false starts, however. In any case, I would have loved to be stopped out on those false starts but been there for all the starts this thing picks up.
It could probably use more confirmatory elements such as trailing conditions and volume perhaps?
BINANCE:BTCUSDTPERP

Let it snow... [QuantNomad]It's almost the end of 2020. If you don't have any snow outside but still you want some Christmas mood - feel free to use my indicator.
TradingView added a possibility to use up to 500 labels, so I decided to create something fun and completely useless.
Snowflakes suppose to fall nicely, but labels are not regularly updated by TradingView. If you know how to make it better - let me know )
For the best experience use Dark Theme and play the "Let it snow" song )
Merry Christmas & Happy New Year!

FIR Trend Filter (Sawtooth and Square Waves)Experimental script!
Using sigma approximation with Sine wave to form Sawtooth and Square waves, for a Finite Impulse Response filter.
Higher harmonics make the sawtooth or square wave more "exact", at the expense of more computation. It also makes the filter more "sensitive". I wouldn't exceed 100, but you're the boss.
The default number of harmonics is 20. The length is 20, too. Why? Because we are currently in 2020. Silly, I know.
Feel free to play around with the settings and tune it to your liking.
How to use it is pretty straight forward: Green is trend-up and red is trend-down.
Credit to alexgrover for the template.

Probability of ATR Index (On-chart) [racer8]This indicator is an on-chart version of my other indicator called Probability of ATR Index (PAI) that was published on October 16th 2020.
PAI is an indicator I created that tells you the probability of current price moving a specified ATR distance over a specified number of periods into the future. It takes into account 4 variables: the ATR & the standard deviation of price, and the 2 parameters: ATR distance and # bars (time).
The formula is very complex so I will not be able to explain it without confusion arising.
The reason I created this PAI was because the other PAI does not show you levels. This one plots the price levels that correspond to your specified ATR distance. So it makes it easier for options traders to set their strangle or condor.
Enjoy 😀

Session High and Session LowI have heard many people ask for a script that will identify the high and low of a specific session. So, I made one.
Important Note: This indicator has to be set up properly or you will get an error. Important things to note are the length of the range and the session definition. The idea is that you would set it up for what's relevant to your trading. Going too far back in the chart history will cause errors. Setting the session for a time that is not on the chart can cause errors. If you set it to look farther back than there are bars to display, you may get an error. What I've found is that if you get an error, you just need to change the settings to reflect available data and it will be able to compile the script. At the time of its publishing, the default range start is set to 10/01/2020. If you're looking at this years later, you'll probably have to set the range to something more recent.
Features:
Plot or Lines:
Using Plot (displayed), the indicator will track the high/low from the end of the session into the next session. Then at the start of the next session, it will start tracking the high/low of that session until its end, then track that high/low until the start of the next session then reset.
Using lines, it will extend horizontal lines to the right indefinitely. The number of sessions back that the lines apply to is a user-defined number of sessions. There are limits to the number of lines that can be cast on a chart (roughly 40-50). So, the maximum number of sessions you can apply the lines to is the last 21 sessions (42 lines total). That gets really noisy though so I can't imagine that is a limiting factor.
Colors:
You can change the background color and its transparency, as well as turn the background color on or off.
You can change the highs and lows colors
You can adjust the line width to your preference
Session Length:
You can use a continuous session covering any user-defined period (provided its not tooooo many candles back)
You can define the session length for intraday
You can exclude weekends
Display Options:
You can adjust the colors, transparency, and linewidth
You can display the plotline or horizontal lines
You can show/hide the background color.
You can change how many sessions back the horizontal lines will track
Let me know if there's anything this script is missing or if you run into any issues that I might be able to help resolve.
Here's what it looks like with Lines for the last 5 sessions and different background color.

Profit Maximizer PMaxPMax is a brand new indicator developed by KivancOzbilgic in earlier 2020.
It's a combination of two trailing stop loss indicators;
One is Anıl Özekşi's MOST (Moving Stop Loss) Indicator
and the other one is well known ATR based SuperTrend.
Both MOST and SuperTrend Indicators are very good at trend following systems but conversely their performance is not bright in sideways market conditions like most of the other indicators.
Profit Maximizer - PMax tries to solve this problem. PMax combines the powerful sides of MOST (Moving Average Trend Changer) and SuperTrend (ATR price detection) in one indicator.
Backtest and optimization results of PMax are far better when compared to its ancestors MOST and SuperTrend. It reduces the number of false signals in sideways and give more reliable trade signals.
PMax is easy to determine the trend and can be used in any type of markets and instruments. It does not repaint.
The first parameter in the PMax indicator set by the three parameters is the period/length of ATR.
The second Parameter is the Multiplier of ATR which would be useful to set the value of distance from the built in Moving Average.
I personally think the most important parameter is the Moving Average Length and type.
PMax will be much sensitive to trend movements if Moving Average Length is smaller. And vice versa, will be less sensitive when it is longer.
As the period increases it will become less sensitive to little trends and price actions.
In this way, your choice of period, will be closely related to which of the sort of trends you are interested in.
We are under the effect of the uptrend in cases where the Moving Average is above PMax;
conversely under the influence of a downward trend, when the Moving Average is below PMax.
Built in Moving Average type defaultly set as EMA but users can choose from 8 different Moving Average types like:
SMA : Simple Moving Average
EMA : Exponential Movin Average
WMA : Weighted Moving Average
TMA : Triangular Moving Average
VAR : Variable Index Dynamic Moving Average aka VIDYA
WWMA : Welles Wilder's Moving Average
ZLEMA : Zero Lag Exponential Moving Average
TSF : True Strength Force
Tip: In sideways VAR would be a good choice
You can use PMax default alarms and Buy Sell signals like:
1-
BUY when Moving Average crosses above PMax
SELL when Moving Average crosses under PMax
2-
BUY when prices jumps over PMax line.
SELL when prices go under PMax line.

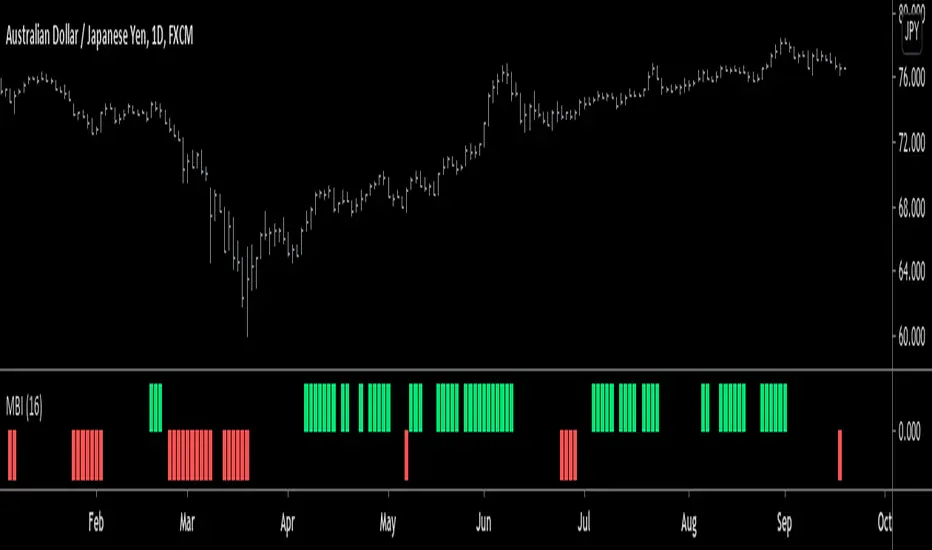
Monster Breakout Index V2Brief Description:
Monster Breakout Index V2 is a the successor to Monster Breakout Index, an indicator I published on May 13, 2020.
Like it's predecessor, MBI V2 gives high quality signals and is incredibly robust at preventing you from trading sideways/consolidating markets.
------------------------------------------------------------------------------------------------------------------------------------------------------------------
Interpreting Signals:
Green = Buy
Red = Sell
------------------------------------------------------------------------------------------------------------------------------------------------------------------
Calculation:
1) Calculate the median price of each bar over n periods. Determine the highest & lowest medians.
2) Current bar's high > highest median? -----Yes = Buy signal
3) Current bar's low < lowest median? -------Yes = Sell signal
Note: Occasionally, the indicator will simultaneously produce both a buy & sell signal. Because of this, it is recommended you use at least one other indicator in conjunction with this one...OR alternatively, ignore this double signal.
------------------------------------------------------------------------------------------------------------------------------------------------------------------
Enjoy ;)
BV's MACD SIGNAL TESTERHello ladies and gentlemen,
Today, as you may have seen in the title, I have coded a strategy to determine once and for all if MACD could make you money in 2020.
So, at the end of this video, you will know which MACD strategy will bring you the most money.
Spoiler alert: we've hit the 90% WinRAte mark on the Euro New Zealand Dollar chart.
I've seen a lot of videos of people testing different MACD signals, some up to 100 times.
But In my opinion, all traders must rely on statistics to put all the odds on their side and good statistics require a lot more data.
The algorithm I'm showing you tests each signal one by one over a 3 year period and on 28 different graphs.
That way we are sure that we have encountered all possible market behavior.
From phases of congestion to major trends or even the effects of COVID-19
I use the ATR to determine my Stop Loss and Take Profits. The Stop Loss is placed at 1.5 times the ATR, the Take Profit is placed at 1 time the ATR.
If my Take Profit is hit, I take 50% of the profits and let the position run by moving my Stop Loss to Zero.
This way, the position can no longer be a losing position.
If you are not familiar with this practice, I invite you to study the "Scaling out" video from the NoNonsenseForex channel.
BV's Trading Journal.

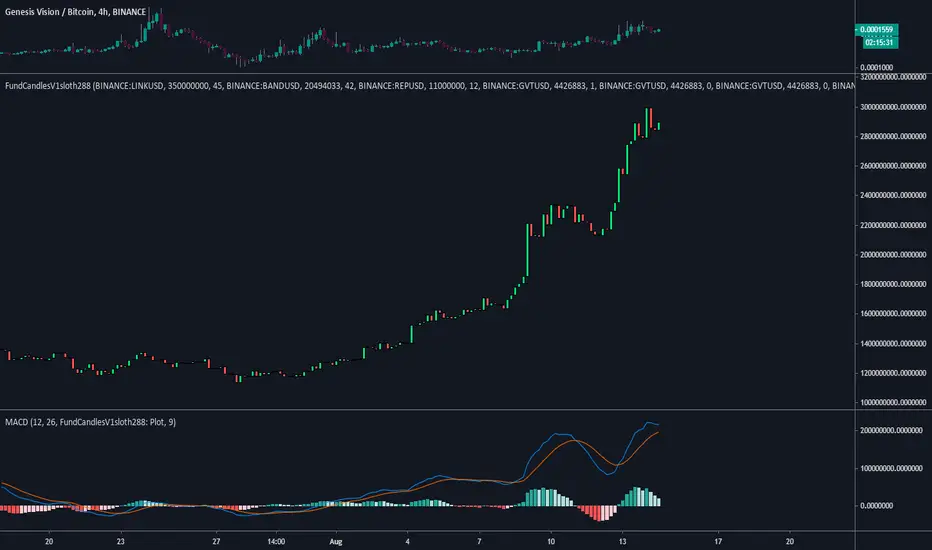
FundCandlesV1sloth288FundCandlesV1sloth288 is an indicator I decided to put together so I can track how funds are doing on $GVT Genesis Vision.
Using a standard MACD or RSI indicator you can change source to use the FundsCandles values to determine if its a good time to enter or exit different funds on the platform.
What you need to know...
Currently all securities need to pair the same, (USD / BTC ).
Security 01, 02, 03 etc etc to maximum of 10 need to be in "BINANCE:LINKUSD" format.
Manually need to input circulating supply from CMC to get the proper ratios for index.
Allocation is the % of the funds exposure to said security.
Inputting the values does not track previous reallocation's, the whole chart will be if the history of the fund was using up to date settings.
Values on the right is the Marketcap of the fund.
Standard settings is of Oracle Basket on the platform made by Somnium Funds as of Aug 13 2020.
Next update will be after GV includes traditional stocks onto the platform for managers to diversify their current allocations into them.
Realized Volatility IIR Filters with BandsDISCLAIMER:
The Following indicator/code IS NOT intended to be a formal investment advice or recommendation by the author, nor should be construed as such. Users will be fully responsible by their use regarding their own trading vehicles/assets.
The following indicator was made for NON LUCRATIVE ACTIVITIES and must remain as is following TradingView's regulations. Use of indicator and their code are published by Invitation Only for work and knowledge sharing. All access granted over it, their use, copy or re-use should mention authorship(s) and origin(s).
WARNING NOTICE!
THE INCLUDED FUNCTION MUST BE CONSIDERED AS TESTING. The models included in the indicator have been taken from open sources on the web and some of them has been modified by the author, problems could occur at diverse data sceneries.
WHAT'S THIS...?
Work derived by previous own research for study:
This is mainly an INFINITE IMPULSE RESPONSE FILTERING INDICATOR , it's purpose is to catch trend given by the nature of lag given by a VOLATILITY ESTIMATION ALGORITHM as it's coefficient. It provides as well an INFINITE IMPULSE RESPONSE DEVIATION FILTER that uses the same coefficients of the main filter to plot deviation bands as an auxiliary tool.
The given Filter based indicator provides my own Multi Volatility-Estimators Function with only 3 models:
ELASTIC VOLUME WEIGHTED VOLATILITY : This is a Modified Daigler & Padungsaksawasdi "Volume Weighted Volatility" as on DOI: 10.1504/IJBAAF.2018.089423 but with Elastic Volume Weighted Moving Average instead of VWAP (intraday) for faster (but inaccurate) calculation. A future version is planned on the way using intra-bar inspection for intraday timeframe as described in original paper.
GARMAN & KLASS / YANG-ZANG EXTENSION : As one of the best range based (OHLC) with open gaps inclusion in a single bar.
PETER MARTIN'S ULCER INDEX : This is a better approach to measure realized volatility than standard deviation of log returns given it's proven convex risk metric for DrawDowns as shown in Chekhlov et al. (2005) . Regarding this particular model, I take a different approach to use it as coefficient feed: Given that the UI only takes in consideration DrawDawns, I code myself the inverse of this to compute Draw-Ups as well and use both of them to filter minimums volatility levels in order to create a SLOW version of the IIR filter, and maximums of both to calculate as FAST variation. This approach can be used as a better proxy instead of any other common moving average given that with NO COMPOUND IN TIME AT ALL (N=1) or only using as long as N=3 bars of compund, the filter can catch a trend easily, making the indicator nearly a NON PARAMETRIC FILTER.
NOTES:
This version DO NOT INCLUDE ALERTS.
This version DO NOT INCLUDE STRATEGY: ALL Feedback welcome.
DERIVED WORK:
Incremental calculation of weighted mean and variance by Tony Finch (fanf2@cam. ac .uk) (dot@dotat.at), 2009.
Volume weighted volatility: empirical evidence for a new realised volatility measure by Chaiyuth Padungsaksawasdi & Robert T. Daigler, 2018.
Basic DSP Tips & Trics by TradingView user @alexgrover
CHEERS!
@XeL_Arjona 2020.

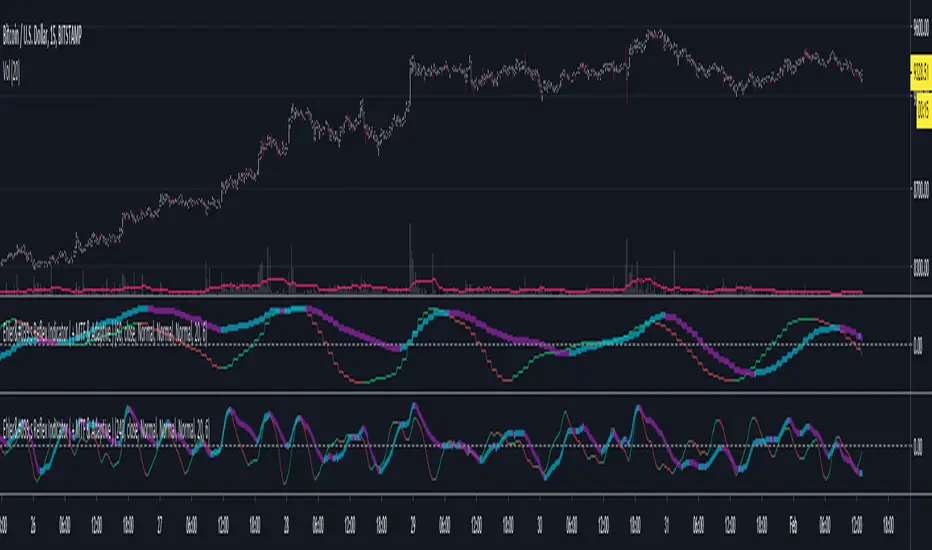
Ehler's Reflex Indicator ( + MTF & Adaptive )Implementation of Ehler's Reflex Indicator from TASC Feb 2020.
Optional MTF and fixed/adaptive length based on one of Ehler's cycle measurements.
Optional settings for his recommended 2 bar averaging, can apply the averaging to either/and source ie (close + close ) / 2, the output of the smoothing filter portion of the calculation or the final indicator output.
Green/Red : Reflex/Cycle
Aqua/Purple : Trend
SMU Price Volume Noise V1This Script show the price volume movement for different time frame. As you can see large buy/sell has significantly increased before the crash or 2018 and similar pattern is developing for 2019/2020. In shorter time frame, the chart shows daily movement of big volume of Buy/Sell and the low volume period appears as a noise. The idea is to look ta the volume price noise to distinguish big market moves from small side line or low volume movement. Fell free to expand on this idea.

Argentina Price per m² (USD) — (1999–2025)Overview
This indicator plots the historical USD price per square meter of apartments in CABA (Buenos Aires City), Argentina, combining annual data (1999–2011) from Maure Real Estate Market Reports with monthly data (2012–2025) from UCEMA and private market sources.
All values were manually digitized, cleaned, and consolidated to reconstruct the most complete long-term pricing series publicly available.
The script also includes SMA20, SMA50, and SMA100 over the custom dataset to support long-term trend analysis, cycle detection, and macro technical structure.
Data Sources
1999–2011 (Annual): Maure Real Estate Market Reports
2012–2020 (Monthly): UCEMA Real Estate Index
2020–2025 (Monthly): RE/MAX – UCEMA Market Monitor
How to Use This Indicator
This tool allows investors, developers, and analysts to:
Identify multiyear trend shifts
Compare cycles vs. Argentine macro environments
Map long-term support/resistance zones in real estate
Detect early signs of market recovery or contraction
Combine real estate fundamentals with technical analysis
The SMAs help visualize structural trends normally hidden in real estate data.
About This Work
This series was fully reconstructed and coded by engineer Francisco Michelich (@esFranMiche on X), combining market research, statistical consolidation, and technical analysis.
It is intended as an analytical tool, not an official financial index.
If you find this useful, feel free to follow and connect — feedback and collaboration are welcome.
Linkedin
X

J.P. Morgan Efficiente 5 IndexJ.P. MORGAN EFFICIENTE 5 INDEX REPLICATION
Walk into any retail trading forum and you'll find the same scene playing out thousands of times a day: traders huddled over their screens, drawing trendlines on candlestick charts, hunting for the perfect entry signal, convinced that the next RSI crossover will unlock the path to financial freedom. Meanwhile, in the towers of lower Manhattan and the City of London, portfolio managers are doing something entirely different. They're not drawing lines. They're not hunting patterns. They're building fortresses of diversification, wielding mathematical frameworks that have survived decades of market chaos, and most importantly, they're thinking in portfolios while retail thinks in positions.
This divide is not just philosophical. It's structural, mathematical, and ultimately, profitable. The uncomfortable truth that retail traders must confront is this: while you're obsessing over whether the 50-day moving average will cross the 200-day, institutional investors are solving quadratic optimization problems across thirteen asset classes, rebalancing monthly according to Markowitz's Nobel Prize-winning framework, and targeting precise volatility levels that allow them to sleep at night regardless of what the VIX does tomorrow. The game you're playing and the game they're playing share the same field, but the rules are entirely different.
The question, then, is not whether retail traders can access institutional strategies. The question is whether they're willing to fundamentally change how they think about markets. Are you ready to stop painting lines and start building portfolios?
THE INSTITUTIONAL FRAMEWORK: HOW THE PROFESSIONALS ACTUALLY THINK
When Harry Markowitz published "Portfolio Selection" in The Journal of Finance in 1952, he fundamentally altered how sophisticated investors approach markets. His insight was deceptively simple: returns alone mean nothing. Risk-adjusted returns mean everything. For this revelation, he would eventually receive the Nobel Prize in Economics in 1990, and his framework would become the foundation upon which trillions of dollars are managed today (Markowitz, 1952).
Modern Portfolio Theory, as it came to be known, introduced a revolutionary concept: through diversification across imperfectly correlated assets, an investor could reduce portfolio risk without sacrificing expected returns. This wasn't about finding the single best asset. It was about constructing the optimal combination of assets. The mathematics are elegant in their logic: if two assets don't move in perfect lockstep, combining them creates a portfolio whose volatility is lower than the weighted average of the individual volatilities. This "free lunch" of diversification became the bedrock of institutional investment management (Elton et al., 2014).
But here's where retail traders miss the point entirely: this isn't about having ten different stocks instead of one. It's about systematic, mathematically rigorous allocation across asset classes with fundamentally different risk drivers. When equity markets crash, high-quality government bonds often rally. When inflation surges, commodities may provide protection even as stocks and bonds both suffer. When emerging markets are in vogue, developed markets may lag. The professional investor doesn't predict which scenario will unfold. Instead, they position for all of them simultaneously, with weights determined not by gut feeling but by quantitative optimization.
This is what J.P. Morgan Asset Management embedded into their Efficiente Index series. These are not actively managed funds where a portfolio manager makes discretionary calls. They are rules-based, systematic strategies that execute the Markowitz framework in real-time, rebalancing monthly to maintain optimal risk-adjusted positioning across global equities, fixed income, commodities, and defensive assets (J.P. Morgan Asset Management, 2016).
THE EFFICIENTE 5 STRATEGY: DECONSTRUCTING INSTITUTIONAL METHODOLOGY
The Efficiente 5 Index, specifically, targets a 5% annualized volatility. Let that sink in for a moment. While retail traders routinely accept 20%, 30%, or even 50% annual volatility in pursuit of returns, institutional allocators have determined that 5% volatility provides an optimal balance between growth potential and capital preservation. This isn't timidity. It's mathematics. At higher volatility levels, the compounding drag from large drawdowns becomes mathematically punishing. A 50% loss requires a 100% gain just to break even. The institutional solution: constrain volatility at the portfolio level, allowing the power of compounding to work unimpeded (Damodaran, 2008).
The strategy operates across thirteen exchange-traded funds spanning five distinct asset classes: developed equity markets (SPY, IWM, EFA), fixed income across the risk spectrum (TLT, LQD, HYG), emerging markets (EEM, EMB), alternatives (IYR, GSG, GLD), and defensive positioning (TIP, BIL). These aren't arbitrary choices. Each ETF represents a distinct factor exposure, and together they provide access to the primary drivers of global asset returns (Fama and French, 1993).
The methodology, as detailed in replication research by Jungle Rock (2025), follows a precise monthly cadence. At the end of each month, the strategy recalculates expected returns and volatilities for all thirteen assets using a 126-day rolling window. This six-month lookback balances responsiveness to changing market conditions against the noise of short-term fluctuations. The optimization engine then solves for the portfolio weights that maximize expected return subject to the 5% volatility target, with additional constraints to prevent excessive concentration.
These constraints are critical and reveal institutional wisdom that retail traders typically ignore. No single ETF can exceed 20% of the portfolio, except for TIP and BIL which can reach 50% given their defensive nature. At the asset class level, developed equities are capped at 50%, bonds at 50%, emerging markets at 25%, and alternatives at 25%. These aren't arbitrary limits. They're guardrails preventing the optimization from becoming too aggressive during periods when recent performance might suggest concentrating heavily in a single area that's been hot (Jorion, 1992).
After optimization, there's one final step that appears almost trivial but carries profound implications: weights are rounded to the nearest 5%. In a world of fractional shares and algorithmic execution, why round to 5%? The answer reveals institutional practicality over mathematical purity. A portfolio weight of 13.7% and 15.0% are functionally similar in their risk contribution, but the latter is vastly easier to communicate, to monitor, and to execute at scale. When you're managing billions, parsimony matters.
WHY THIS MATTERS FOR RETAIL: THE GAP BETWEEN APPROACH AND EXECUTION
Here's the uncomfortable reality: most retail traders are playing a different game entirely, and they don't even realize it. When a retail trader says "I'm bullish on tech," they buy QQQ and that's their entire technology exposure. When they say "I need some diversification," they buy ten different stocks, often in correlated sectors. This isn't diversification in the Markowitzian sense. It's concentration with extra steps.
The institutional approach represented by the Efficiente 5 is fundamentally different in several ways. First, it's systematic. Emotions don't drive the allocation. The mathematics do. When equities have rallied hard and now represent 55% of the portfolio despite a 50% cap, the system sells equities and buys bonds or alternatives, regardless of how bullish the headlines feel. This forced contrarianism is what retail traders know they should do but rarely execute (Kahneman and Tversky, 1979).
Second, it's forward-looking in its inputs but backward-looking in its process. The strategy doesn't try to predict the next crisis or the next boom. It simply measures what volatility and returns have been recently, assumes the immediate future resembles the immediate past more than it resembles some forecast, and positions accordingly. This humility regarding prediction is perhaps the most institutional characteristic of all.
Third, and most critically, it treats the portfolio as a single organism. Retail traders typically view their holdings as separate positions, each requiring individual management. The institutional approach recognizes that what matters is not whether Position A made money, but whether the portfolio as a whole achieved its risk-adjusted return target. A position can lose money and still be a valuable contributor if it reduced portfolio volatility or provided diversification during stress periods.
THE MATHEMATICAL FOUNDATION: MEAN-VARIANCE OPTIMIZATION IN PRACTICE
At its core, the Efficiente 5 strategy solves a constrained optimization problem each month. In technical terms, this is a quadratic programming problem: maximize expected portfolio return subject to a volatility constraint and position limits. The objective function is straightforward: maximize the weighted sum of expected returns. The constraint is that the weighted sum of variances and covariances must not exceed the volatility target squared (Markowitz, 1959).
The challenge, and this is crucial for understanding the Pine Script implementation, is that solving this problem properly requires calculating a covariance matrix. This 13x13 matrix captures not just the volatility of each asset but the correlation between every pair of assets. Two assets might each have 15% volatility, but if they're negatively correlated, combining them reduces portfolio risk. If they're positively correlated, it doesn't. The covariance matrix encodes these relationships.
True mean-variance optimization requires matrix algebra and quadratic programming solvers. Pine Script, by design, lacks these capabilities. The language doesn't support matrix operations, and certainly doesn't include a QP solver. This creates a fundamental challenge: how do you implement an institutional strategy in a language not designed for institutional mathematics?
The solution implemented here uses a pragmatic approximation. Instead of solving the full covariance problem, the indicator calculates a Sharpe-like ratio for each asset (return divided by volatility) and uses these ratios to determine initial weights. It then applies the individual and asset-class constraints, renormalizes, and produces the final portfolio. This isn't mathematically equivalent to true mean-variance optimization, but it captures the essential spirit: weight assets according to their risk-adjusted return potential, subject to diversification constraints.
For retail implementation, this approximation is likely sufficient. The difference between a theoretically optimal portfolio and a very good approximation is typically modest, and the discipline of systematic rebalancing across asset classes matters far more than the precise weights. Perfect is the enemy of good, and a good approximation executed consistently will outperform a perfect solution that never gets implemented (Arnott et al., 2013).
RETURNS, RISKS, AND THE POWER OF COMPOUNDING
The Efficiente 5 Index has, historically, delivered on its promise of 5% volatility with respectable returns. While past performance never guarantees future results, the framework reveals why low-volatility strategies can be surprisingly powerful. Consider two portfolios: Portfolio A averages 12% returns with 20% volatility, while Portfolio B averages 8% returns with 5% volatility. Which performs better over time?
The arithmetic return favors Portfolio A, but compound returns tell a different story. Portfolio A will experience occasional 20-30% drawdowns. Portfolio B rarely draws down more than 10%. Over a twenty-year horizon, the geometric return (what you actually experience) for Portfolio B may match or exceed Portfolio A, simply because it never gives back massive gains. This is the power of volatility management that retail traders chronically underestimate (Bernstein, 1996).
Moreover, low volatility enables behavioral advantages. When your portfolio draws down 35%, as it might with a high-volatility approach, the psychological pressure to sell at the worst possible time becomes overwhelming. When your maximum drawdown is 12%, as might occur with the Efficiente 5 approach, staying the course is far easier. Behavioral finance research has consistently shown that investor returns lag fund returns primarily due to poor timing decisions driven by emotional responses to volatility (Dalbar, 2020).
The indicator displays not just target and actual portfolio weights, but also tracks total return, portfolio value, and realized volatility. This isn't just data. It's feedback. Retail traders can see, in real-time, whether their actual portfolio volatility matches their target, whether their risk-adjusted returns are improving, and whether their allocation discipline is holding. This transparency transforms abstract concepts into concrete metrics.
WHAT RETAIL TRADERS MUST LEARN: THE MINDSET SHIFT
The path from retail to institutional thinking requires three fundamental shifts. First, stop thinking in positions and start thinking in portfolios. Your question should never be "Should I buy this stock?" but rather "How does this position change my portfolio's expected return and volatility?" If you can't answer that question quantitatively, you're not ready to make the trade.
Second, embrace systematic rebalancing even when it feels wrong. Perhaps especially when it feels wrong. The Efficiente 5 strategy rebalances monthly regardless of market conditions. If equities have surged and now exceed their target weight, the strategy sells equities and buys bonds or alternatives. Every retail trader knows this is what you "should" do, but almost none actually do it. The institutional edge isn't in having better information. It's in having better discipline (Swensen, 2009).
Third, accept that volatility is not your friend. The retail mythology that "higher risk equals higher returns" is true on average across assets, but it's not true for implementation. A 15% return with 30% volatility will compound more slowly than a 12% return with 10% volatility due to the mathematics of return distributions. Institutions figured this out decades ago. Retail is still learning.
The Efficiente 5 replication indicator provides a bridge. It won't solve the problem of prediction no indicator can. But it solves the problem of allocation, which is arguably more important. By implementing institutional methodology in an accessible format, it allows retail traders to see what professional portfolio construction actually looks like, not in theory but in executable code. The the colorful lines that retail traders love to draw, don't disappear. They simply become less central to the process. The portfolio becomes central instead.
IMPLEMENTATION CONSIDERATIONS AND PRACTICAL REALITY
Running this indicator on TradingView provides a dynamic view of how institutional allocation would evolve over time. The labels on each asset class line show current weights, updated continuously as prices change and rebalancing occurs. The dashboard displays the full allocation across all thirteen ETFs, showing both target weights (what the optimization suggests) and actual weights (what the portfolio currently holds after price movements).
Several key insights emerge from watching this process unfold. First, the strategy is not static. Weights change monthly as the optimization recalibrates to recent volatility and returns. What worked last month may not be optimal this month. Second, the strategy is not market-timing. It doesn't try to predict whether stocks will rise or fall. It simply measures recent behavior and positions accordingly. If volatility has risen, the strategy shifts toward defensive assets. If correlations have changed, the diversification benefits adjust.
Third, and perhaps most importantly for retail traders, the strategy demonstrates that sophistication and complexity are not synonyms. The Efficiente 5 methodology is sophisticated in its framework but simple in its execution. There are no exotic derivatives, no complex market-timing rules, no predictions of future scenarios. Just systematic optimization, monthly rebalancing, and discipline. This simplicity is a feature, not a bug.
The indicator also highlights limitations that retail traders must understand. The Pine Script implementation uses an approximation of true mean-variance optimization, as discussed earlier. Transaction costs are not modeled. Slippage is ignored. Tax implications are not considered. These simplifications mean the indicator is educational and analytical, not a fully operational trading system. For actual implementation, traders would need to account for these real-world factors.
Moreover, the strategy requires access to all thirteen ETFs and sufficient capital to hold meaningful positions in each. With 5% as the rounding increment, practical implementation probably requires at least $10,000 to avoid having positions that are too small to matter. The strategy is also explicitly designed for a 5% volatility target, which may be too conservative for younger investors with long time horizons or too aggressive for retirees living off their portfolio. The framework is adaptable, but adaptation requires understanding the trade-offs.
CAN RETAIL TRULY COMPETE WITH INSTITUTIONS?
The honest answer is nuanced. Retail traders will never have the same resources as institutions. They won't have Bloomberg terminals, proprietary research, or armies of analysts. But in portfolio construction, the resource gap matters less than the mindset gap. The mathematics of Markowitz are available to everyone. ETFs provide liquid, low-cost access to institutional-quality building blocks. Computing power is essentially free. The barriers are not technological or financial. They're conceptual.
If a retail trader understands why portfolios matter more than positions, why systematic discipline beats discretionary emotion, and why volatility management enables compounding, they can build portfolios that rival institutional allocation in their elegance and effectiveness. Not in their scale, not in their execution costs, but in their conceptual soundness. The Efficiente 5 framework proves this is possible.
What retail traders must recognize is that competing with institutions doesn't mean day-trading better than their algorithms. It means portfolio-building better than their average client. And that's achievable because most institutional clients, despite having access to the best managers, still make emotional decisions, chase performance, and abandon strategies at the worst possible times. The retail edge isn't in outsmarting professionals. It's in out-disciplining amateurs who happen to have more money.
The J.P. Morgan Efficiente 5 Index Replication indicator serves as both a tool and a teacher. As a tool, it provides a systematic framework for multi-asset allocation based on proven institutional methodology. As a teacher, it demonstrates daily what portfolio thinking actually looks like in practice. The colorful lines remain on the chart, but they're no longer the focus. The portfolio is the focus. The risk-adjusted return is the focus. The systematic discipline is the focus.
Stop painting lines. Start building portfolios. The institutions have been doing it for seventy years. It's time retail caught up.
REFERENCES
Arnott, R. D., Hsu, J., & Moore, P. (2013). Fundamental Indexation. Financial Analysts Journal, 61(2), 83-99.
Bernstein, W. J. (1996). The Intelligent Asset Allocator. New York: McGraw-Hill.
Dalbar, Inc. (2020). Quantitative Analysis of Investor Behavior. Boston: Dalbar.
Damodaran, A. (2008). Strategic Risk Taking: A Framework for Risk Management. Upper Saddle River: Pearson Education.
Elton, E. J., Gruber, M. J., Brown, S. J., & Goetzmann, W. N. (2014). Modern Portfolio Theory and Investment Analysis (9th ed.). Hoboken: John Wiley & Sons.
Fama, E. F., & French, K. R. (1993). Common risk factors in the returns on stocks and bonds. Journal of Financial Economics, 33(1), 3-56.
Jorion, P. (1992). Portfolio optimization in practice. Financial Analysts Journal, 48(1), 68-74.
J.P. Morgan Asset Management. (2016). Guide to the Markets. New York: J.P. Morgan.
Jungle Rock. (2025). Institutional Asset Allocation meets the Efficient Frontier: Replicating the JPMorgan Efficiente 5 Strategy. Working Paper.
Kahneman, D., & Tversky, A. (1979). Prospect Theory: An Analysis of Decision under Risk. Econometrica, 47(2), 263-291.
Markowitz, H. (1952). Portfolio Selection. The Journal of Finance, 7(1), 77-91.
Markowitz, H. (1959). Portfolio Selection: Efficient Diversification of Investments. New York: John Wiley & Sons.
Swensen, D. F. (2009). Pioneering Portfolio Management: An Unconventional Approach to Institutional Investment. New York: Free Press.
