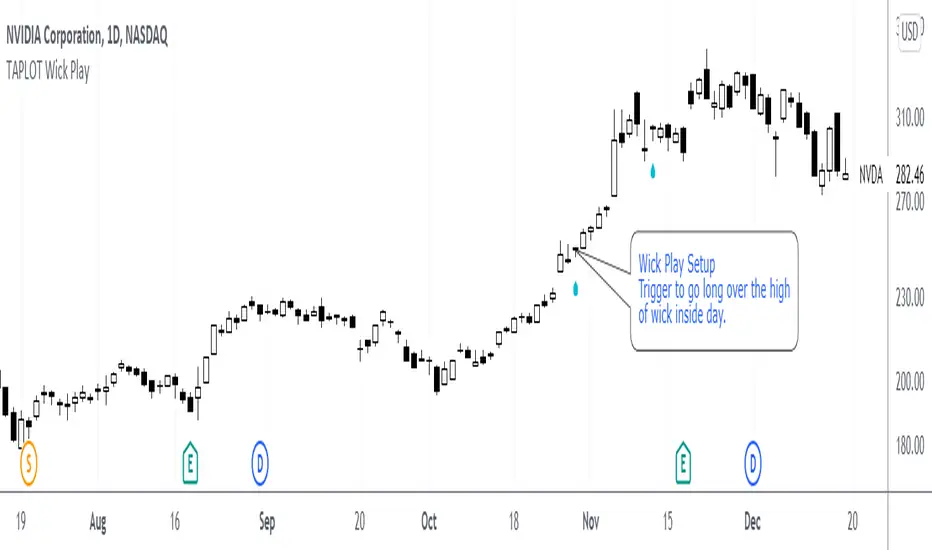
TAPLOT Wick PlayWick play is a candle stick long setup popularized by 2020 US Investing Champion Oliver Kell
Wick Play is a setup in which:
Strong stock with momentum to the upside closes off the highs of the day in yesterdays session.
Today's session opens in the candle "wick" of yesterdays bar.
If stock holds in the wick and doesn't trade in the body of yesterdays candle, it is a sign of strength.
Trigger happens on day 3 when price moves over the high of the wick inside day.
It is important to note that this setup should not be traded in isolation. Not every wick play is buyable.
This is to be used in the context of strong stocks like True Market Leaders and with buying momentum behind them.
Indicator places an up arrow under the candle setup. It also colors the candle itself. All configurable through indicator settings.
Cheers!
Cari dalam skrip untuk "2020年3月+中证芯片产业指数+成分股调整"
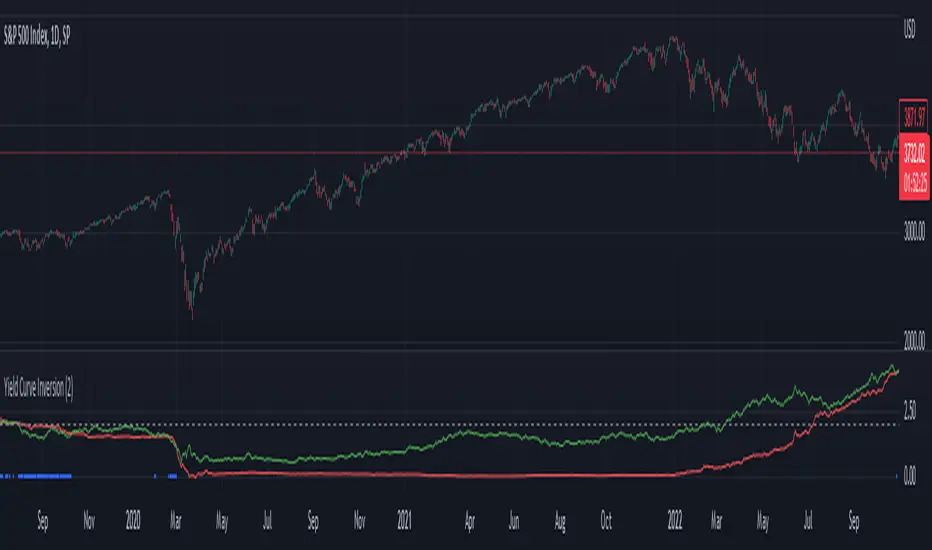
Yield Curve Inversion IndicatorIntroduction
The last time (as of this publishing) that this indicator detected an inverted interest rate yield curve was on February 20th, 2020 at 12:30pm EST, the afternoon before the S&P500 began one of its largest crashes in US history. The vast majority of major economic recessions since the 1950's have been preceded by an interest rate yield curve inversion. I created this indicator originally as an input to study the impacts of more conservative risk management on quantitative trading strategies following a yield curve inversion event. It is being shared with the community as a quick indicator to check to see the comparative status of short term and long term interest rates, and as an indicator where you can easily check to see if we are experiencing an inverted yield curve in real-time.
Background of the significance of an inverted yield curve:
"What an inverted yield curve really means is that most investors believe that short-term interest rates are going to fall sharply at some point in the future. As a practical matter, recessions usually cause interest rates to fall. Historically, inversions of the yield curve have preceded recessions in the U.S. Due to this historical correlation, the yield curve is often seen as a way to predict the turning points of the business cycle. When the yield curve inverts, short-term interest rates become higher than long-term rates. This type of yield curve is the rarest of the three main curve types and is considered to be a predictor of economic recession. Because of the rarity of yield curve inversions, they typically draw attention from all parts of the financial world." (www.investopedia.com)
Settings and Usage
This indicator pulls in pricing data from tickers that represent short term and long term interest rates, and compares them. The red line represents short term interest rates, and the green line represents long term interest rates. When the red line is above the green line, it indicates that we are experiencing a yield curve inversion. Small blue crosses also appear on the bottom of the indicator during an inversion to further highlight the event visually. This indicator pulls in the same information on the same two interest rate tickers regardless of what chart it is applied to.
Other Thoughts
This script uses the f_secureSecurity function as a best practice. For those that are versed in PineScript, code from this indicator could be adapted to be applied to an interest rate chart that allows custom alerts to be created the moment that there is an inverted interest rate yield curve.
FBMKLCI VolumeVolume for FBMKLCI Malaysia. Note that the volume starts on 27th Oct 2020 due to the change of securities in index. There are 30 securities combined into single volume.

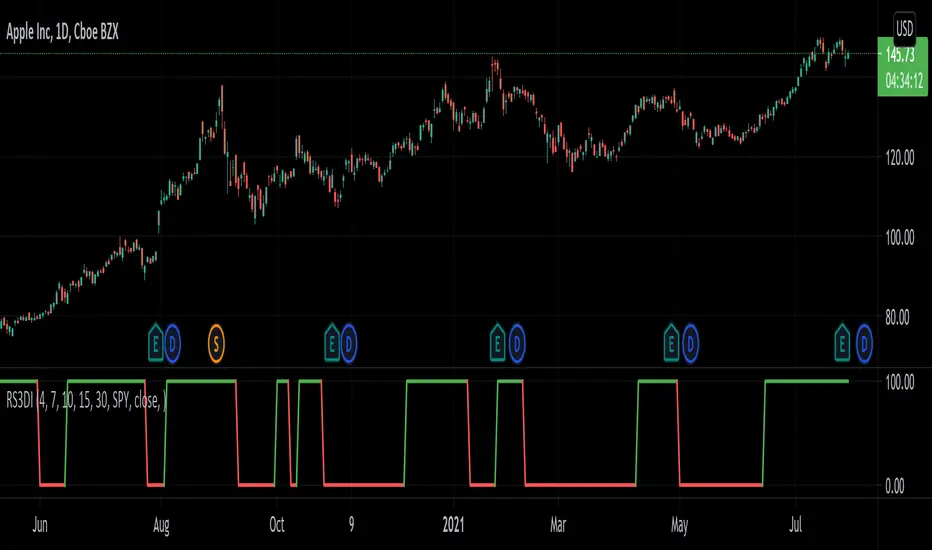
Relative Strength 3D Indicator [CC]This is a custom indicator of mine loosely based on the work by James Garofallou (Stocks and Commodities Sep 2020 pg 14) and this is meant for medium to long term trend confirmations. The idea behind this indicator is to capture 3 different dimensions of trend strength. The first dimension captures the overall strength of the underlying stock vs the market (in this case the S&P 500). The second dimension captures the overall trend strength by assigning a scoring system so when all faster moving averages are stronger than slower moving averages then it gets the max points. The final dimension is the strength of the overall strength of everything so far. Buy when the indicator line turns green and sell when it turns red.
Let me know if there are any other indicators or scripts you would like to see me publish!
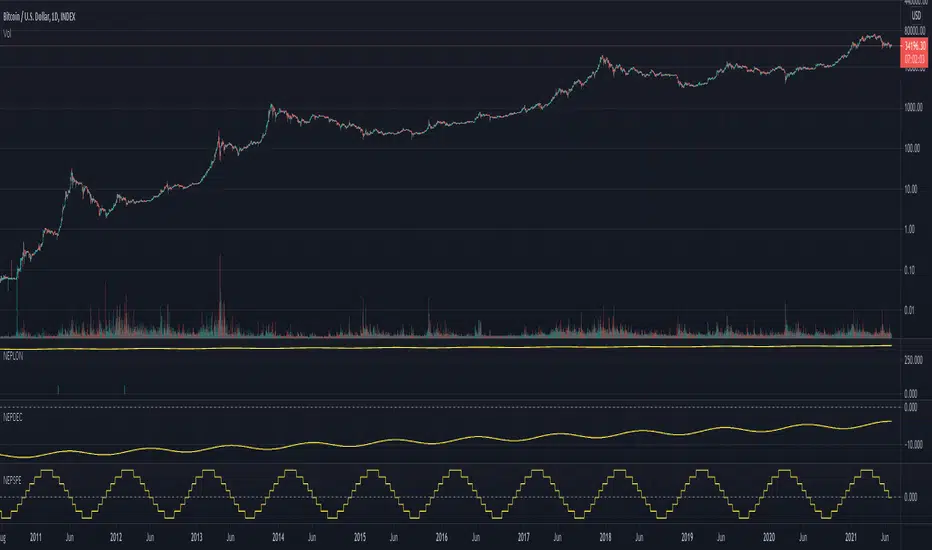
Financial Astrology Neptune SpeedNeptune retrograde and stationary phases indicates periods of delusion, on that moments the traders optimism bubble is burst, as consequence, we can see that most of this retrograde speed phase periods correlates with BTCUSD price correction or consolidation periods. Is very clear to see in the chart that only once, the Neptune retrogradation occurrence in September 2020, resulted in price growth. Therefore, periods of price growth and optimism are more likely when Neptune is direct.
Note: The Neptune speed indicator is based on an ephemeris array that covers years 2010 to 2030, prior or after this years the speed is not available, this daily ephemeris are based on UTC time so in order to align properly with the price bars times you should set UTC as your chart timezone.
5MA_X_LThis is a 5 day moving average crossing long strategy in 10 min. chart, used in short term momentum trading strategy.
Momentum trading Strategy: When S&P 500 index is at up trend (or above 60 sma ), buy 10+ stocks in top 20% stock RS ranking at equal weight using this MA5X_L strategy. Change stocks when any stock exited by algorithm.
Back test start since 2020/7/1, each long entry for condition 1 is $30000, condition 2 is $20000, with max of 2 long positions.
Setup: 10 minutes chart
Buy condition 1) 3 wma cross up 195 wma (5day) 2) 3wma > 78wma > 195wma UP Trend Arrangement (UTA)
Exit condition 1) 3 wma cross under 195 wma 2) position profit > 20% and 3 wma cross under 6 ATRs line (green)

Sortino RatioThe Sortino ratio is a variation of the Sharpe ratio that differentiates harmful volatility from total overall volatility using the asset's standard deviation of negative portfolio returns—downside deviation—instead of the total standard deviation of portfolio returns. The Sortino ratio takes an asset or portfolio's return and subtracts the risk-free rate and then divides that amount by the asset's downside deviation. The ratio was named after Frank A. Sortino.
What Can the Sortino Ratio Tell You?
The Sortino ratio is useful for investors, analysts, and portfolio managers to evaluate an investment's return for a given level of bad risk. Since this ratio uses only the downside deviation as its risk measure, it addresses the problem of using total risk, or standard deviation, which is important because upside volatility is beneficial to investors and isn't a factor most investors worry about.
The Difference Between the Sortino Ratio and the Sharpe Ratio
The Sortino ratio improves upon the Sharpe ratio by isolating downside or negative volatility from total volatility by dividing excess return by the downside deviation instead of the total standard deviation of a portfolio or asset.
The Sharpe ratio punishes the investment for good risk, which provides positive returns for investors. However, determining which ratio to use depends on whether the investor wants to focus on total or standard deviation or just downside deviation.
CONCLUSION: THE HIGHER THE RATIO, THE BETTER IT IS.
Note: The default risk-free rate is based on the Malaysian rate. Please change based on your country rate.
Note: The default length is based on 1 year Malaysia trading day (11/6/2020 - 11/6/2021).
Note: Sortino ratio is good for assessing a long-term investment, and thus, please use a longer time frame to get a better risk assessment.
Please let me know if this script contains any mistake. Cheers!

Relative Difference Of Squares Oscillator [CC]The Relative Difference Of Squares Oscillator was created by Marco Alves (Stocks and Commodities Aug 2020 pg 10) and this is a heavily customized version of his indicator that works for single stocks instead of the entire market. I have included extra buy and sell signals to account for strong signals vs normal signals based on some user feedback I got. Buy when the line turns green and sell when it turns red. Keep in mind that this is a lagging indicator so good for trend confirmation.
Let me know if there are any other scripts you would like to see me publish!

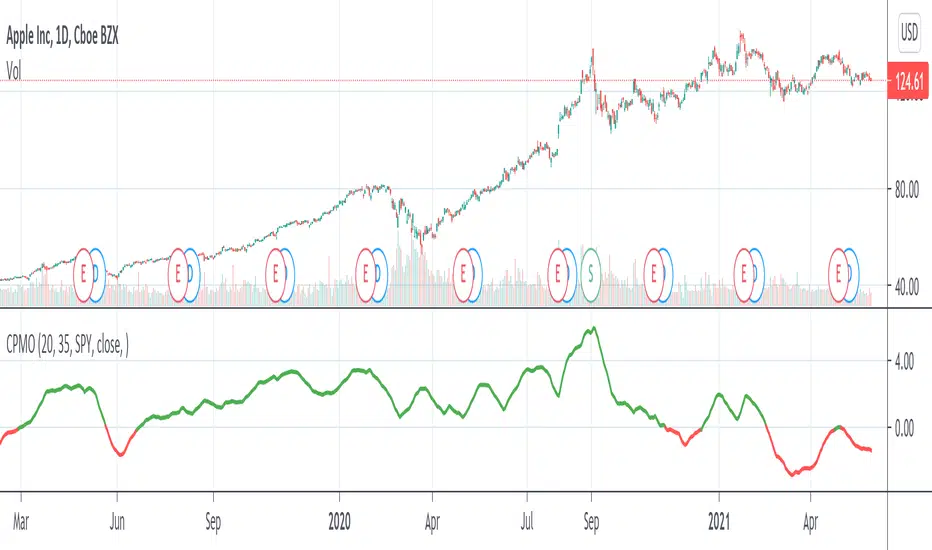
Compare Price Momentum Oscillator [CC]The Compare Price Momentum Oscillator was created by Vitali Apirine (Stocks and Commodities Aug 2020 pg 16) and this is a handy indicator to compare the momentum of the current symbol you are looking at to the s&p to determine the relative strength of the underlying security. Buy when the line turns green and sell when it turns red.
Let me know if there are any other scripts you would like to see me publish!
Tripple super Trend + EMA + RSI StrategyGreetings!
Here I show you the Tripple Super Trend Strategy.
I discovered the strategy on a YouTube channel and tried to transfer it as a strategy into a script.
Tested with the currency pair EUR/USD in the one hour chart.
Period: beginning of 2020 until today.
The strategy should also work with cryptocurrencies. But then the settings have to be adjusted.
There is the possibility to activate only long or only short position.
The EMA can be used in a time different from the chart.
-----------------------------------------------------------------------------------
How does the strategy work?
For long positions, the candle must be above the EMA .
The candle must be closed above at least two of the supertrend lines.
The stochastic RSI must show oversold and the k line must cross over the D line.
For short positions, the candle must be below the EMA .
The candle must be closed below at least two of the supertrend lines.
The stochastic RSI must indicate overbought and the K line must cross below the D line.
The stop loss is determined with the "lowest low/highest high lookback".
The profit factor is multiplied by the value of the lowest low/highest high lookback.
The results of the strategy are without commissions and levers.
If you have any questions or feedback, please let me know in the comments.
In the future I will add other types of stop loss / take profits. (ATR; %; eg.)
If you need more information about the strategy and want to know exactly how to apply it, check out my profile.
I wish you good luck with the strategy!

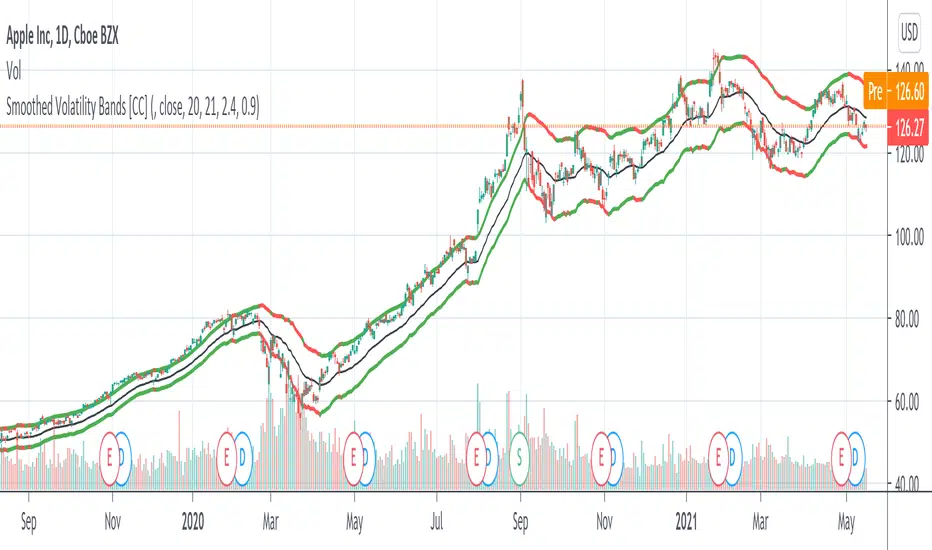
Smoothed Volatility Bands [CC]The Smoothed Volatility Bands were created by Sylvain Vervoort (Stocks and Commodities Sep 2020 pg 19) and this is a heavily customized version of regular Bollinger Bands that take volatility into account. Feel free to change the moving average since Vervoort recommended trying that out. Buy when the indicator line turns green and sell when it turns red.
Let me know if there are any other indicators you want me to publish!
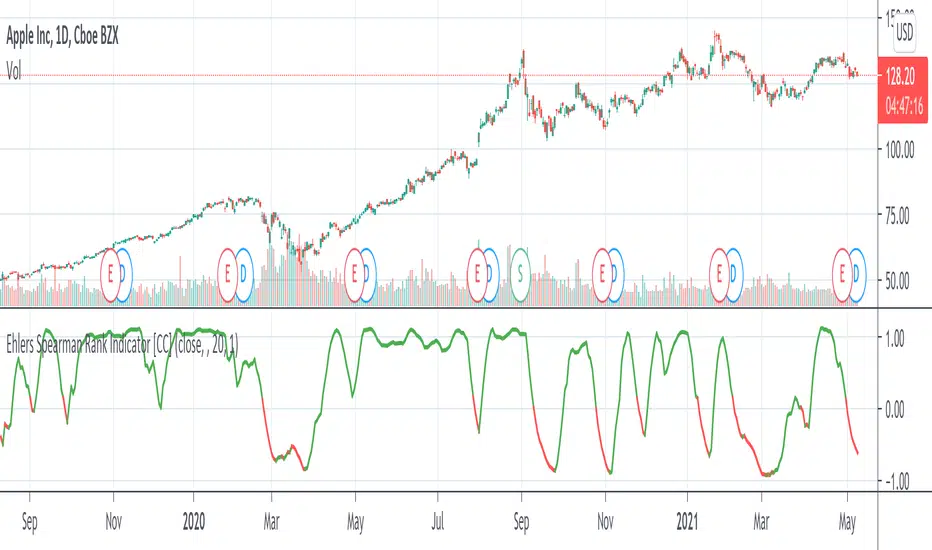
Ehlers Spearman Rank Indicator [CC]The Spearman Rank Indicator was created by John Ehlers (Stocks and Commodities July 2020 pg 6) and this works well as a trend confirmation indicator. This is obviously his take on the Spearman Ranking Correlation and make sure to let me know what you think! Buy when the line turns green and sell when it turns red.
Let me know if there are any other indicators you want me to publish!
Max GainThis indicator is meant to be used for coming up with price targets based on past performances of rallies/selloffs.
It shows how much a trade could have made over a 30-day period (or other length of time) in terms of percentage gain.
It also show how much could have been lost in terms of percentage loss
The green plot shows percentage gain from current high to the low of the previous 30 days.
The red plot shows adjusted percentage loss from current low to the high of the previous 30 days.
The 30 can be adjusted and the chart can be used on any time interval.
Note on max loss adjustment:
Max loss percentage is adjusted to be higher to account for the fact that a percentage loss corresponds to a percentage
gain of a greater amount. For instance, a loss of 25% can only be recovered with a percentage gain of 33%.
A 25% loss looking at the chart from left to right would be a 33% gain looking at the same price
action from right to left. In order to compare apples to apples visually and performance wise, max loss percent needs to be adjusted.
The actual max loss percent is calculated and plottable but is not plotted by default because it is less useful and adds clutter.
There is not a great difference between actual max loss and adjusted max loss under everyday market conditions, but
major selloffs (SPY 2020), short squeezes (GME 2021), or other unusually directional moves will display percentage losses
that, in absolute terms, should be considered to be fairly incorrect. The adjusted percentages are good indicators of
relative performance when comparing the magnitudes to the magnitudes of the max gain percentages and
are more visually meaningful than the actual max loss percentages in every situation, so they are plotted despite having incorrect values.
Note on bear markets:
This indicator was designed for bull markets but should it be used in bear markets the indicators that are and aren't
plotted should be swapped using the plot check boxes in the settings dialogue if there is interest in using the loss percentages
for actual loss amount calculations while maintaining visual/performance adjustment
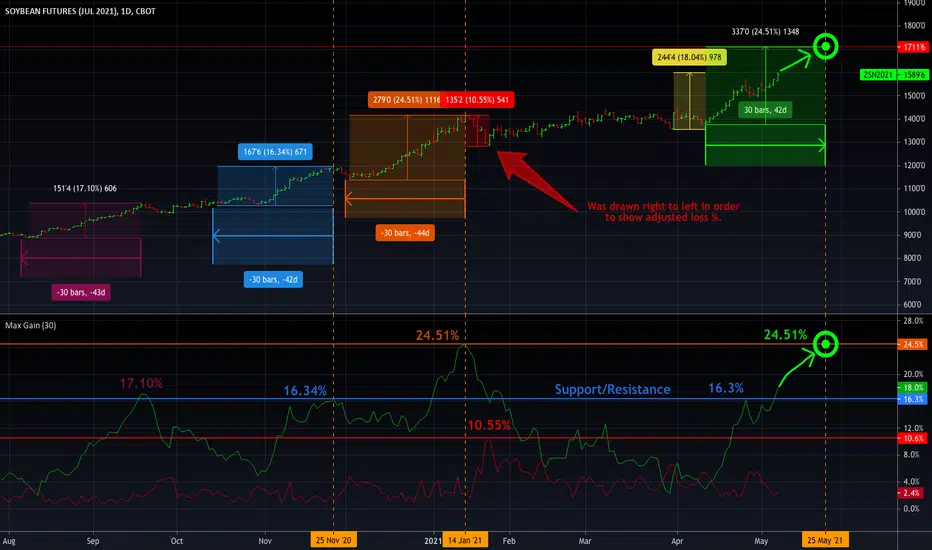
As can been seen in the example chart a gain of 16.3% to 17.1% appears to be a resistance level. This level was recently broken through and the next resistance is 24.5%.
The target is a 24.5% gain from the anticipated 30-day low at the time when the price can be expected to reach a 25.4% gain at the gain rate observed in recent rallies.
Previous rallies are shown for reference with their 30-day periods and corresponding gain percentages which are plotted below.
A selloff is shown in red for reference as well. It was drawn backward to trick the tool into thinking it was a gain, so as to demonstrate logic behind the adjustment.
In reality, this was closer to a 9.5% loss, not 10.55%.
I am still experimenting with this indicator to see how to best use it. Ultimately, it helps me do what I was already doing with the percentage gain tools
but now I can do those analyses in a more systematic manner and with charting. Please feel free to ask questions.
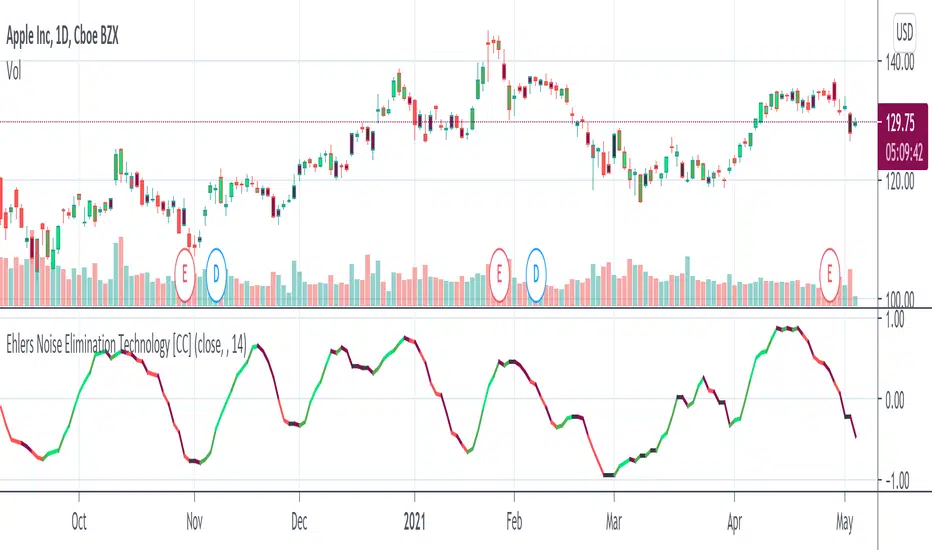
Ehlers Noise Elimination Technology [CC]The Noise Elimination Technology Indicator was created by John Ehlers (Stocks and Commodities Dec 2020 pg 17) and he created this indicator to be used with his version of RSI but I think it works well with any price data or any indicator really.
I'm trying a new signal system due to a request from @luckyCamel58789 so let me know what you think. I now differentiate between a buy and a strong buy when the indicator increases over itself twice and vice versa. Dark green is a strong buy and light green is a regular buy. Dark red is a strong sell and light red is a regular sell.
Let me know what indicators you would like to see me publish!
Zweig Market Breadth Thrust Indicator StrategyThe Breadth Thrust Indicator is a technical indicator which determines market momentum, signaling the start of a potential new bull market.
The Breadth Thrust Indicator was developed by Martin Zweig, an American stock investor, financial analyst, and investment adviser. According to Zweig, the concept is based on the principle that the sudden change of money in the investment markets elevates stocks and signals increased liquidity. In other words, this indicator is all about how quickly the NYSE's advancing and declining numbers go from poor to great in a compressed time period.
A "Thrust" indicates that the stock market has rapidly changed from an oversold condition to one of strength, but has not yet become overbought. This is very rare and has happened only a few times. Dr . Zweig also points out that most bull markets begin with a Breadth Thrust.
More info can be found at www.investopedia.com
I have inspired by indicator introduced in TradingView by LazyBear and adopted the logic from there. Thanks LazyBear !!!
Though indicator signals the new Bull market, but I have not found much information how to use it in daily market. So I had come up with a strategy, which would allow us to trade SPY, QQQ , AMEX and securities under these markets.
I have used MA setting as 65 (since Zweig indicator setting was 10 days , based on that I set 65 for Hourly chart ... 10d x 6.5 Hrs = 65 in my startegy). You have to change this setting if you change the timeframe. Also , note that this strategy is for Stock Market only.
Strategy Rule/Settings
===================
Select the market type based on your security symbol.
SPY => use NYSE
QQQ => use NASDAQ
any other security => check exchange it was listed and select the corresponding market.
if you dont know , use COMBINED option
BUY
====
when indicator cross 0.40 from below
Note:
1. see how well it picks the bottoms ... example : Nov 2020 ....
2. setting 0.45 is also produces good results , only thing is you get more signals.
EXIT
=====
Exit when indicator cross down from 0.60 . I have used RSI (5) for partial exits. These two are available in settings
Close the whole position when indicator crossing down 0.40
STOP LOSS
=========
defaulted to 5%
Please Note , I have tested SPY , QQQ on Horly chart with MA 65. You need to chnage the MA setting based on your time frame and check the results.
WARNING
========
For the use of educational purposes only

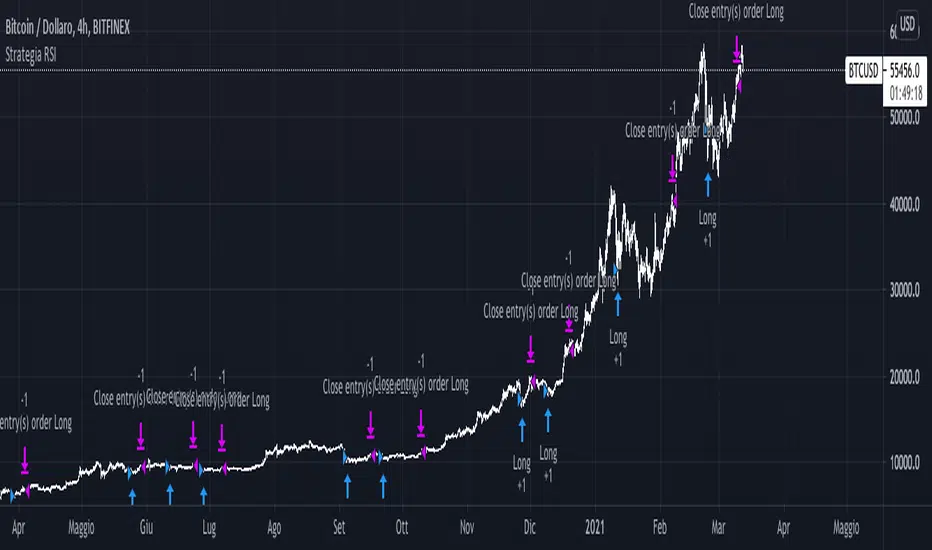
Strategia RSI sempliceQuesto semplice script sfrutta il RSI a 14 periodi per comprare (solo long) quando RSI crocia al rialzo i 30 (oversold line) e chiude l'operazione quando RSI crocia al ribasso i 70 (overbought line).
La strategia è stata progettata sul TimeFrame delle 4H (su BTC) e dimostra come una semplicissima strategia con un solo segnale poteva portare un 20% dal 2020 ad oggi su BTC/USD
RedK Strength of MovementThis is a quick indicator i wrote to inspect the strength of price movement and show when what i consider to be "a quality trend" has been established. the code is open and commented - the "math concept" is really simple and i'm not sure if this has already been coded before :) - my apologies if it was.
my main goal was to identify opportunities to establish "simple, straight" long call or put positions for the stocks i follow
- what i noticed thru the years is that some opportunities will present themselves to take these basic option positions but they are "rare", maybe once or twice a year -- for example, in 2020, TSLA presented 2 such opportunities around the split and the index inclusion - so i needed an indicator that exposes these setups. if you can time yourself with these setups, they are incredibly rewarding.
these setups will happen when the SoM reaches 100% (in either directions) while it's in agreement with the prevailing trend (hence the need to use the SoM with a MACD or something like the Ribbon) - if the SoM hits the 100% in one direction and the trend is not in the same direction, that signal is invalid. see the chart for some examples.
a quick useful observation, is that the SoM will sometimes also act as a leading indicator for an imminent change in trend direction, which makes sense .. given that the SoM relies on exposing the "relative" movement or change of price (close for example) - thru the use of the stoch() function - and that this "change value" will usually expand in the direction of a strong trend and starts to contract ahead of a reversal.
Please fee free to use this code, leverage the indicator, or give feedback
i may come back later and update this with some features (like making this volume-weighted)
best of luck!

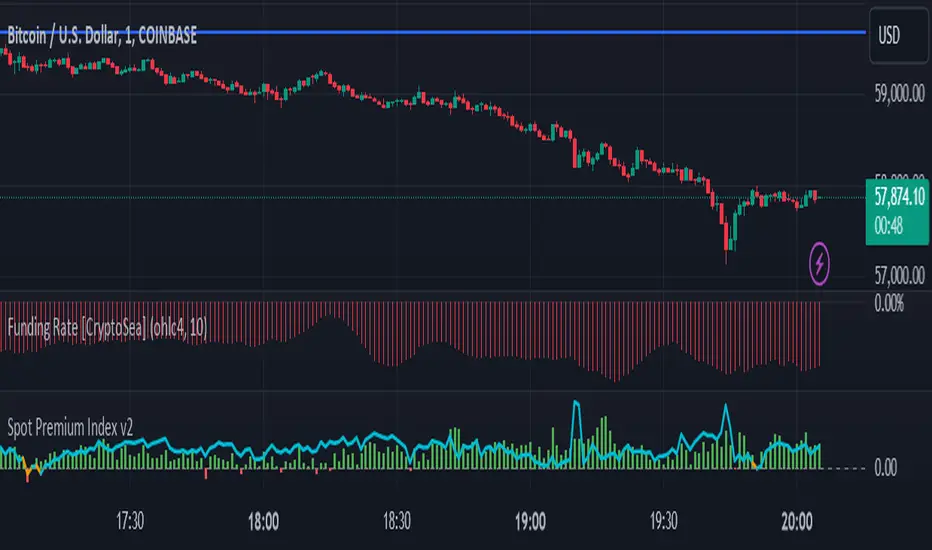
BTC Coinbase PremiumThis script is base on another script by oh 92.
It basically shows you where the price of Bitcoin (in USD) on Coinbase trades at a premium against an average of several futures exchanges.
Coinbase premium shows spot interest on bitcoin which happens either when futures are shorting heavily but spot holds the price up (often bullish especially when price is at a support level).
Negative premium shows that futures are leading price during an uptrend or spot is leading price during a downtrend.
Strong positive premium is often considered bullish.
Strong negative premium is often considered bearish even if price goes up.
The histogramm coinbase premium vs an average of several futures exchanges (Bitmex, Bitfinex, Binance, FTX, Phemex and Bitstamp).
The line diagramm shows coinbase premium vs Bybit.
In contrast to the script by oh92 this script uses different exchages (especially Bybit as a lot of former Bitmex traders changed to Bybit during september and october 2020).
All values are in percent because differences in USD only are not suitable for historic prices. This means if CB-premium is -0.1 then futures trade 0.1% lower than coinbase.
TradingView Alerts to MT4 MT5 - Forex, indices, commoditiesHowdy Algo-Traders! This example script has been created for educational purposes - to present how to use and automatically execute TradingView Alerts on real markets.
I'm posting this script today for a reason. TradingView has just released a new feature of the PineScript language - ALERT() function. Why is it important? It is finally possible to set alerts inside PineScript strategy-type script, without the need to convert the script into study-type. You may say triggering alerts straight from strategies was possible in PineScript before (since June 2020), but it had its limitations. Starting today you can attach alert to any custom event you might want to include in your PineScript code.
With the new feature, it is easier not only to execute strategies, but to maintain codebase - having to update 2 versions of the code with each single modification was... ahem... inconvenient. Moreover, the need to convert strategy into study also meant it was required to rip the code from all strategy...() calls, which carried a lot of useful information, like entry price, position size, and more, definitely influencing results calculated by strategy backtest. So the strategy without these features very likely produced different results than with them. While it was possible to convert these features into study with some advanced "coding gymnastics", it was also quite difficult to test whether those gymnastics didn't introduce serious, bankrupting bugs.
//////
How does this new feature work? It is really simple. On your custom events in the code like "GoLong" or "GoShort", create a string variable containing all the values you need inside your alert and this string variable will be your alert's message. Then, invoke brand new alert() function and that's it (see lines 67 onwards in the script). Set it up in CreateAlert popup and enjoy. Alerts will trigger on candle close as freq= parameter specifies. Detailed specification of the new alert() function can be found in TradingView's PineScript Reference (www.tradingview.com), but there's nothing more than message= and freq= parameters. Nothing else is needed, it is very simple. Yet powerful :)
//////
Alert syntax in this script is prepared to work with TradingConnector. Strategy here is not too complex, but also not the most basic one: it includes full exits, partial exits, stop-losses and it also utilizes dynamic variables calculated by the code (such as stop-loss price). This is only an example use case, because you could handle variety of other functionalities as well: conditional entries, pending entries, pyramiding, hedging, moving stop-loss to break-even, delivering alerts to multiple brokers and more.
//////
This script is a spin-off from my previous work, posted over a year ago here: Some comments on strategy parameters have been discussed there, but let me copy-paste most important points:
* Commission is taken into consideration.
* Slippage is intentionally left at 0. Due to shorter than 1 second delivery time of TradingConnector, slippage is practically non-existing.
* This strategy is NON-REPAINTING and uses NO TRAILING-STOP or any other feature known to be causing problems.
* The strategy was backtested on EURUSD 6h timeframe, will perform differently on other markets and timeframes.
Despite the fact this strategy seems to be still profitable, it is not guaranteed it will continue to perform well in the future. Remember the no.1 rule of backtesting - no matter how profitable and good looking a script is, it only tells about the past. There is zero guarantee the same strategy will get similar results in the future.
Full specs of TradingView alerts and how to set them up can be found here: www.tradingview.com

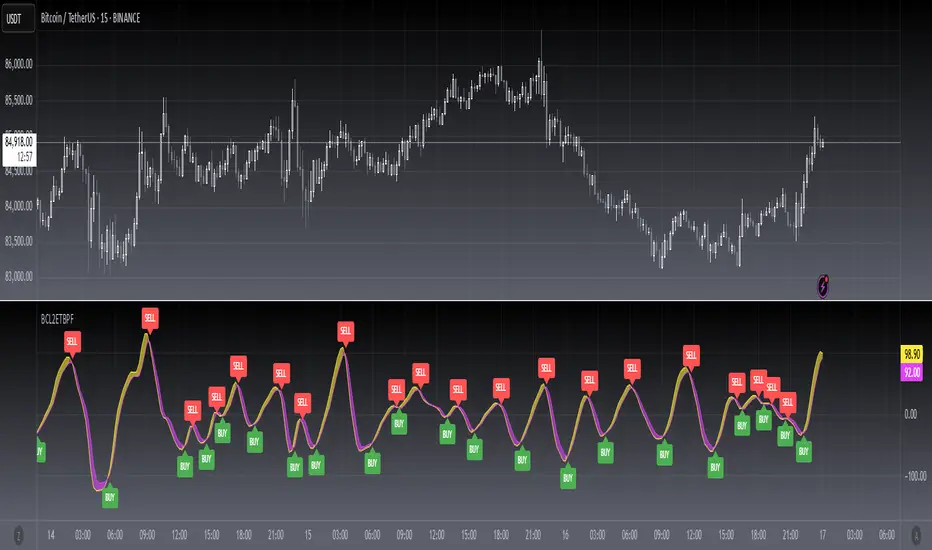
[blackcat] L2 Ehlers Truncated BP FilterLevel: 2
Background
John F. Ehlers introuced Truncated BandPass (BP) Filter in Jul, 2020.
Function
In Dr. Ehlers' article “Truncated Indicators” in Jul, 2020, he introduces a method that can be used to modify some indicators, improving how accurately they are able to track and respond to price action. By limiting the data range, that is, truncating the data, indicators may be able to better handle extreme price events. A reasonable goal, especially during times of high volatility. John Ehlers shows how to improve a bandpass filter’s ability to reflect price by limiting the data range. Filtering out the temporary spikes and price extremes should positively affect the indicator stability. Enter a new indicator ——— the Truncated BandPass (BP) filter.
Cumulative indicators, such as the EMA or MACD, are affected not only by previous candles, but by a theoretically infinite history of candles. Although this effect is often assumed to be negligible, John Ehlers demonstrates in his article that it is not so. Or at least not for a narrow-band bandpass filter.
Bandpass filters are normally used for detecting cycles in price curves. But they do not work well with steep edges in the price curve. Sudden price jumps cause a narrow-band filter to “ring like a bell” and generate artificial cycles that can cause false triggers. As a solution, Ehlers proposes to truncate the candle history of the filter. Limiting the history to 10 bars effectively dampened the filter output and produced a better representation of the cycles in the price curve. For limiting the history of a cumulative indicator, John Ehlers proposes “Truncated Indicators,” John Ehlers takes us aside to look at the impact of sharp price movements on two fundamentally different types of filters: finite impulse response, and infinite impulse response filters. Given recent market conditions, this is a very well timed subject.
As demostrated in this script, Ehlers suggests “truncation” as an approach to the way the trader calculates filters. He explains why truncation is not appropriate for finite impulse response filters but why truncation can be beneficial to infinite impulse response filters. He then explains how to apply truncation to infinite impulse response filters using his bandpass filter as an example.
Key Signal
BPT --> Truncated BandPass (BP) Filter fast line
Trigger --> Truncated BandPass (BP) Filter slow line
Pros and Cons
100% John F. Ehlers definition translation, even variable names are the same. This help readers who would like to use pine to read his book.
Remarks
The 98th script for Blackcat1402 John F. Ehlers Week publication.
Readme
In real life, I am a prolific inventor. I have successfully applied for more than 60 international and regional patents in the past 12 years. But in the past two years or so, I have tried to transfer my creativity to the development of trading strategies. Tradingview is the ideal platform for me. I am selecting and contributing some of the hundreds of scripts to publish in Tradingview community. Welcome everyone to interact with me to discuss these interesting pine scripts.
The scripts posted are categorized into 5 levels according to my efforts or manhours put into these works.
Level 1 : interesting script snippets or distinctive improvement from classic indicators or strategy. Level 1 scripts can usually appear in more complex indicators as a function module or element.
Level 2 : composite indicator/strategy. By selecting or combining several independent or dependent functions or sub indicators in proper way, the composite script exhibits a resonance phenomenon which can filter out noise or fake trading signal to enhance trading confidence level.
Level 3 : comprehensive indicator/strategy. They are simple trading systems based on my strategies. They are commonly containing several or all of entry signal, close signal, stop loss, take profit, re-entry, risk management, and position sizing techniques. Even some interesting fundamental and mass psychological aspects are incorporated.
Level 4 : script snippets or functions that do not disclose source code. Interesting element that can reveal market laws and work as raw material for indicators and strategies. If you find Level 1~2 scripts are helpful, Level 4 is a private version that took me far more efforts to develop.
Level 5 : indicator/strategy that do not disclose source code. private version of Level 3 script with my accumulated script processing skills or a large number of custom functions. I had a private function library built in past two years. Level 5 scripts use many of them to achieve private trading strategy.
Strange_index_version jan2021_1this is an indicator show the most important support and resistant in crypto market for some days in Jan 2020
just chosse which date you want to see the resistant and support in it and the indicator will plot it

[blackcat] L2 Ehlers Correlation Trend StrategyLevel: 2
Background
John F. Ehlers introuced Correlation Trend Strategy in May, 2020.
Function
In Dr. Ehlers article “Correlation As A Trend Indicator” in May, 2020, he introduces a new trend indicator that is based on the correlation between a security’s price history and the ideal trend: a straight line. He describes methods for using the indicator to not only identify the onset of new trends but to identify trend failures as well. The indicator helps to identify the onset of a trend or to detect the failure of a trend. While his correlation trend indicator measures the price correlation with a rising slope, the new correlation cycle indicator (CCY) measures the correlation with a sine wave .
Key Signal
CorrF --> Correlation Trend Strategy fast line
CorrS --> Correlation Trend Strategy slow line
Pros and Cons
100% John F. Ehlers definition translation, even variable names are the same. This help readers who would like to use pine to read his book.
Remarks
The 97th script for Blackcat1402 John F. Ehlers Week publication.
Readme
In real life, I am a prolific inventor. I have successfully applied for more than 60 international and regional patents in the past 12 years. But in the past two years or so, I have tried to transfer my creativity to the development of trading strategies. Tradingview is the ideal platform for me. I am selecting and contributing some of the hundreds of scripts to publish in Tradingview community. Welcome everyone to interact with me to discuss these interesting pine scripts.
The scripts posted are categorized into 5 levels according to my efforts or manhours put into these works.
Level 1 : interesting script snippets or distinctive improvement from classic indicators or strategy. Level 1 scripts can usually appear in more complex indicators as a function module or element.
Level 2 : composite indicator/strategy. By selecting or combining several independent or dependent functions or sub indicators in proper way, the composite script exhibits a resonance phenomenon which can filter out noise or fake trading signal to enhance trading confidence level.
Level 3 : comprehensive indicator/strategy. They are simple trading systems based on my strategies. They are commonly containing several or all of entry signal, close signal, stop loss, take profit, re-entry, risk management, and position sizing techniques. Even some interesting fundamental and mass psychological aspects are incorporated.
Level 4 : script snippets or functions that do not disclose source code. Interesting element that can reveal market laws and work as raw material for indicators and strategies. If you find Level 1~2 scripts are helpful, Level 4 is a private version that took me far more efforts to develop.
Level 5 : indicator/strategy that do not disclose source code. private version of Level 3 script with my accumulated script processing skills or a large number of custom functions. I had a private function library built in past two years. Level 5 scripts use many of them to achieve private trading strategy.
[blackcat] L2 Ehlers Correlation CycleLevel: 2
Background
John F. Ehlers introuced Correlation Cycle indicator in Jun, 2020.
Function
In his article “Correlation As A Cycle Indicator” in Jun, 2020, John Ehlers introduces a companion to the trend indicator he presented in his article. This new indicator is designed to help traders navigate cycling markets. The new cycle indicator can help the trader get into trades earlier and have better insight into prevailing market conditions. While his correlation trend indicator measures the price correlation with a rising slope, the new correlation cycle indicator (CCY) measures the correlation with a sine wave.The new system trades only when the market state is 1 or -1, indicating trend regime. It goes out of the market when the market state is 0.
Key Signal
State --> +1 for long and -1 for short
Pros and Cons
100% John F. Ehlers definition translation, even variable names are the same. This help readers who would like to use pine to read his book.
Remarks
The 96th script for Blackcat1402 John F. Ehlers Week publication.
Readme
In real life, I am a prolific inventor. I have successfully applied for more than 60 international and regional patents in the past 12 years. But in the past two years or so, I have tried to transfer my creativity to the development of trading strategies. Tradingview is the ideal platform for me. I am selecting and contributing some of the hundreds of scripts to publish in Tradingview community. Welcome everyone to interact with me to discuss these interesting pine scripts.
The scripts posted are categorized into 5 levels according to my efforts or manhours put into these works.
Level 1 : interesting script snippets or distinctive improvement from classic indicators or strategy. Level 1 scripts can usually appear in more complex indicators as a function module or element.
Level 2 : composite indicator/strategy. By selecting or combining several independent or dependent functions or sub indicators in proper way, the composite script exhibits a resonance phenomenon which can filter out noise or fake trading signal to enhance trading confidence level.
Level 3 : comprehensive indicator/strategy. They are simple trading systems based on my strategies. They are commonly containing several or all of entry signal, close signal, stop loss, take profit, re-entry, risk management, and position sizing techniques. Even some interesting fundamental and mass psychological aspects are incorporated.
Level 4 : script snippets or functions that do not disclose source code. Interesting element that can reveal market laws and work as raw material for indicators and strategies. If you find Level 1~2 scripts are helpful, Level 4 is a private version that took me far more efforts to develop.
Level 5 : indicator/strategy that do not disclose source code. private version of Level 3 script with my accumulated script processing skills or a large number of custom functions. I had a private function library built in past two years. Level 5 scripts use many of them to achieve private trading strategy.
