Turtle Soup IndicatorTurtle Soup Indicator plots a shape when we have a 20-period high or 20-period low.
Turtle Soup Setup
The Turtle Soup setup was published in the book Street Smarts by Laurence A Connors and Linda Raschke. You can learn about it there. It is a great setup for false breakouts or breakdowns in the group failure tests.
Going long
1) We have a new 20-period low
2) that must have occured at least four trading sessions earlier <- this is very important
Then we place a buy stop above 5-10 ticks or 5 to 10 cents above the previous 20-period low.
If filled immediately place a good til cancelled sell stop one tick or one cent below todays low.
Turtle Soup Plus One
Similar to above but occurs one day later. It should close at/below previous 20-period low.
Buy stop at earlier 20 day low. Cancel fi not filled on day 2.
Take partials within 2-6 bars on this one and trail stop rest of position.
Going short
Reverse
Time frames
Works on all timeframes. Only adjust stoplosses accordingly to chosen timeframe.
Settings
You can change the color, shape and placement of the indicator shape. I actually prefer a grey color for both highs and lows as the color actually doesn't add much information. The placement says it all but it is up to you to change this as you like.
Cari dalam skrip untuk "20蒙古币兑换人民币"

Trendlines Boll Ichi S1 by GammaprodI. How to use this indicator :
------------------------------
I.1. Set your teadingview theme to dark theme.
I.2. Gammaprod indicator is valid for forex, stock and but more valid for crypto.
I.3. Use three timeframe for more validation (choose between those, that fit to your trading style) :
- Timeframe 1m, 5m, and 15m for Scalping
- Timeframe 30m, 1h and 4h for Intraday
- Timeframe 4h, 1D and 1W for Swing Trading
I.4 Always use THREE INDICATORS FROM GAMMAPROD, those three indicators is back to back each other, by the way, I only made those three indicators only (for now) :
- Trendlines Boll Ichi S1 by Gammaprod
- MACD Volume S2 by Gammaprod
- Stoch RSI Divs Zone S2 by Gammaprod
============================================================================
II. How to setting :
--------------------
II.1. Trendlines Boll Ichi Crypto by Gammaprod
II.1.A. Support and Resistance
- Well if you familiar with this indicator you can add it, but recommended for Timeframe 30m or more
II.1.B. Trendlines Primary or Trendlines Secondary
- Timeframe 1m you DON'T NEED Trendlines Primary or Trendlines Secondary
- Timeframe 5m you DON'T NEED Trendlines Secondary, but you CAN ADD Trendlines Primary if you fell it helpful (for me, it is helpful to find where the candles start or the end trend or a consolidation or where the candles will surpass a resistance or a support).
- Timeframe 15m you DON'T NEED Trendlines Secondary, DEFENITELY add Trendlines Primary it will help to find where the candles stop or a consolidation or where the candles will surpass a resistance or a support).
- Timeframe 30m or more, DEFENITELY NEED BOTH Trendlines Primary and Secondary Trendlines, it will help to find where the candle stop or consolidation or where the candle will surpass a resistance or support).
II.1.C. Bollinger, Ichimoku Cloud and Lagging Span
- Please DON'T CHANGE IT at all, it's really helpful to know when and where to make an entry decesion or a trend or a consolidation, if you don't understand how to read it, you better to learn it first (on "how to read" section and "How to OPEN position" the section below)
II.2. Stoch RSI Divs Zone Crypto by Gammaprod (DON'T CHANGE IT)
II.3. MACD Volume Crypto by Gammaprod (DON'T CHANGE IT)
============================================================================
III. How to read :
------------------
III.1. Sell or Buy Priority :
III.1.A. Sell Priority
- Color background on macd and stoch rsi is pink or purple sell is the priority, (if you're not sure to buy, just wait until the best moment to sell)
III.1.B. Buy Priority
- Color background on macd and stoch rsi Teal or light green buy is the priority, (if you're not sure to sell, just wait until the best moment to buy)
III.1.C. Indecision / Golden Moment
- Color background on stoch rsi yellow is indecision / golden moment of reversal pattern (wait until it formed background only on Stoch RSI), please be careful at this moment.
III.2. Trend / Consolidation :
III.2.A. BULLISH trend
- When Stoch RSI and MACD have teal or light green background that's means BULLISH trend, better to confirm by the candle is above green cloud and lagging span (red line) is also above the candle.
III.2.B. BEARISH trend
- When Stoch RSI and MACD have the Pink or purple background that's means BEARISH trend, better to confirm by the candle is above purple cloud and lagging span (red line) is also below the candle.
III.2.C. CONSOLIDATION
- When Stoch RSI have the mix background that's means CONSOLIDATION, better to confirm by the candle is in or near to green / purple cloud and lagging span (red line) is also on the candle.
III.3. Special Mark
III.3.A. Ideal Bullish :
- Near line 20 and green / teal background = When Stoch RSI have the char R / H on lime color label, that's means divergence or hidden divergence for buy position, if you not see this label that's means just a standard confirmation for buy
III.3.B. Not an Ideal Bullish :
- Near line 80 and green / teal background = if this happens make sure you know what happen, it could be a false signal or bullish continual pattern
III.3.C. Ideal Bearish :
- Near line 80 and pink / purple background = When Stoch RSI have the char R / H on lime color label, that's means divergence or hidden divergence for buy position, if you not see this label that's means just a standard confirmation for sell position.
III.3.D. Not an Ideal Bearish:
- Near line 20 and pink / purple background = if this happens make sure you know what happen, it could be a false signal or bearish continual pattern
III.3.E. The Beginning of Reversal (from BEARISH to BULLISH) :
- When Stoch RSI line shaping GREEN position is near 20.
- MACD lines still PINK, position lines is UNDER the HISTOGRAM, but the HISTOGRAM start to SHAPE FALL PINK (light pink) and the BACKGROUND still PINK / PURPLE.
- Position CANDLES NEAR BLUE line, NEAR PURPLE CLOUD, and lagging span (red line) STILL ON the area candle. (it used to be confirmed with the golden moment).
III.3.F. The Beginning of Reversal (from BULLISH to BEARISH) :
- When Stoch RSI line shaping PINK position is near 80.
- MACD lines still GREEN, position lines is ABOVE the HISTOGRAM, but the HISTOGRAM start to SHAPE FALL GREEN (light green) and the BACKGROUND still TEAL / GREEN.
- Position CANDLES NEAR WHITE line, NEAR TEAL CLOUD, and lagging span (red line) STILL ON the area candle. (it used to be confirmed with the golden moment).
III.3.G. False Signals, or It could be a Golden Moment (better to see it on TF 15 or bigger):
- Near line 20 or 80 and yellow background = When Stoch RSI have the char R / H on color label, that's means divergence or hidden divergence for buy / sell position, if you not see this label that's means just a standard confirmation for buy / sell depends on where the Stoch RSI line if near 20 that's means buy, near 80 means sell
============================================================================
IV. How to OPEN position:
-------------------------
IV.1. Bullish
IV.1.A. Trendlines Boll Ichi S1 by Gammaprod
- The candles above the green cloud.
- Lagging span (red line) above the candles.
- then open buy near yellow line (the first option) / blue line (the second option) (always confirm the position with two other indicators below).
IV.1.B. MACD Volume S2 by Gammaprod
- Teal or Green background.
- The lines is shaped or shaping green.
- Better if at the green histogram.
IV.1.C. Stoch RSI Divs Zone S3 by Gammaprod
- Teal or Green background.
- The lines is shaping green.
- Better if on the bottom (at a range 20).
IV.2. Bearish
IV.2.A. Trendlines Boll Ichi S1 by Gammaprod
- The candles below the purple cloud.
- Lagging span (red line) below the candles.
- then open buy near yellow line (the first option) / white line (the second option) (always confirm the position with two other indicators below).
IV.2.B. MACD Volume S2 by Gammaprod
- Pink or purple background.
- The lines are shaped or shaping green.
- Better if at the pink histogram.
IV.2.C. Stoch RSI Divs Zone S3 by Gammaprod
- Pink or purple background.
- The lines are shaping pink.
- Better if the line on the top (at a range 80).
IV.3. Consolidation
IV.3.A. Trendlines Boll Ichi S1 by Gammaprod
- The candles on the cloud (green or purple).
- Lagging span (red line) on the candles.
- then open buy near the white or blue line (always confirm the position with two other indicators below).
IV.3.B. MACD Volume S2 by Gammaprod
- Changing the background.
- The line is near the middle line.
- Have small Histogram.
IV.3.C. Stoch RSI Divs Zone S3 by Gammaprod
- Mix background specially on a timeframe 15m or more.
- The line move fast up and down.
- Better if on the bottom or the top of the lines (at a range 20 or 80).
============================================================================
>> The secret ingredient is comparing the timeframe :
The example scalping (Timeframe 1m, 5m and 15m)
- TF 1m is for making an open position.
- TF 5m is for making a judgement of the trend market.
- TF 15m is to confirm that judgement from TF 5m, be careful if it not similar then it used to be a consolidation or the beginning of the reversal.
There's a lot a way to open the position than above information that i gave it to you, but consider there are a limit chars on this column, I hope it will help your trading and make a more profit on it.

MACD Volume S2 By Gammaprod>> How to use this indicator :
1. Set your teadingview theme to dark theme.
2. My indicator is valid for forex, stock and but more valid for crypto.
3. Use three timeframe for more validation (choose between those, that fit to your trading style) :
- Timeframe 1m, 5m, and 15m for Scalping
- Timeframe 30m, 1h and 4h for Intraday
- Timeframe 4h, 1D and 1W for Swing Trading
4 . Always use THREE INDICATORS FROM GAMMAPROD, those three indicators is back to back each other, by the way, I only made those three indicators only (for now) :
- Trendlines Boll Ichi Crypto by Gammaprod
- Stoch RSI Divs Zone Crypto by Gammaprod
- MACD Volume Crypto by Gammaprod
>> How to setting :
1. Trendlines Boll Ichi Crypto by Gammaprod
A. Support and Resistence
- Well if you familiar with this indicator you can add it, but recommended for Timeframe 30m or more
B. Trendlines Primary or Trendlines Secondary
- Timeframe 1m you DON'T NEED Trendlines Primary or Trendlines Secondary
- Timeframe 5m you DON'T NEED Trendlines Secondary, but you CAN ADD Trendlines Primary if you fell it helpful (for me, it is helpful to find where the candles start or the end trend or a consolidation or where the candles will surpass a resistance or a support).
- Timeframe 15m you DON'T NEED Trendlines Secondary, DEFENITELY add Trendlines Primary it will help to find where the candles stop or a consolidation or where the candles will surpass a resistance or a support).
- Timeframe 30m or more, DEFENITELY NEED BOTH Trendlines Primary and Secondary Trendlines, it will help to find where the candle stop or consolidation or where the candle will surpass a resistance or support).
C. Bolinger, Ichimoku Cloud and Lagging Span
- Please DON'T CHANGE IT at all, it's really helpful to know when and where to make an entry decesion or a trend or a consolidation, if you don't understand how to read it, you better to learn it first (on "how to read" section and "How to OPEN position" the section below)
2. Stoch RSI Divs Zone Crypto by Gammaprod (DON'T CHANGE IT)
3. MACD Volume Crypto by Gammaprod (DON'T CHANGE IT)
>> How to read :
1. Sell or Buy Priority :
A. Buy Priority
- Color background on macd and stoch rsi is pink or purple sell is the priority, (if you're not sure to buy, just wait until the best moment to sell)
B. Buy Priority
- Color background on macd and stoch rsi Teal or light green buy is the priority, (if you're not sure to sell, just wait until the best moment to buy)
C. Indecision / Golden Moment
- Color background on stoch rsi yellow is indecision / golden moment of reversal pattern (wait until it formed background only on Stoch RSI), please becareful at this moment.
2. Trend / Consolidation :
A. BULLISH trend
- When Stoch RSI and MACD have teal or light green background that's means BULLISH trend, better to confirm by the candle is above green cloud and lagging span (red line) is also above the candle.
B. BEARISH trend
- When Stoch RSI and MACD have the Pink or purple background that's means BEARISH trend, better to confirm by the candle is above purple cloud and lagging span (red line) is also below the candle.
C. CONSOLIDATION
- When Stoch RSI have the mix background that's means CONSOLIDATION, better to confirm by the candle is in or near to green / purple cloud and lagging span (red line) is also on the candle.
3. Special Mark
A. Ideal Bullish :
- Near line 20 and green / teal background = When Stoch RSI have the char R / H on lime color label, that's means divergence or hidden divergence for buy position, if you not see this label that's means just a standard confirmation for buy
B. Not an Ideal Bullish :
- Near line 80 and green / teal background = if this happens make sure you know what happen, it could be a false signal or bullish continual pattern
C. Ideal Bearish :
- Near line 80 and pink / purple background = When Stoch RSI have the char R / H on lime color label, that's means divergence or hidden divergence for buy position, if you not see this label that's means just a standard confirmation for sell position.
D. Not an Ideal Bearish:
- Near line 20 and pink / purple background = if this happens make sure you know what happen, it could be a false signal or bearish continual pattern
E. The Beginning of Reversal (from BEARISH to BULLISH) :
- When Stoch RSI line shaping GREEN position is near 20.
- MACD lines still PINK, position lines is UNDER the HISTOGRAM, but the HISTOGRAM start to SHAPE FALL PINK (light pink) and the BACKGROUND still PINK / PURPLE.
- Position CANDLES NEAR BLUE line, NEAR PURPLE CLOUD, and lagging span (red line) STILL ON the area candle. (it used to be confirmed with the golden moment).
F. The Beginning of Reversal (from BULLISH to BEARISH) :
- When Stoch RSI line shaping PINK position is near 80.
- MACD lines still GREEN, position lines is ABOVE the HISTOGRAM, but the HISTOGRAM start to SHAPE FALL GREEN (light green) and the BACKGROUND still TEAL / GREEN.
- Position CANDLES NEAR WHITE line, NEAR TEAL CLOUD, and lagging span (red line) STILL ON the area candle. (it used to be confirmed with the golden moment).
G. False Signals, or It could be a Golden Moment (better to see it on TF 15 or bigger):
- Near line 20 or 80 and yellow background = When Stoch RSI have the char R / H on color label, that's means divergence or hidden divergence for buy / sell position, if you not see this label that's means just a standard confirmation for buy / sell depends on where the Stoch RSI line if near 20 that's means buy, near 80 means sell
>> How to OPEN position:
A. Bullish
1. Trendlines Boll Ichi Crypto by Gammaprod
- The candles above the green cloud.
- Lagging span (red line) above the candles.
- then open buy near yellow line (the first option) / blue line (the second option) (always confirm the position with two other indicators below).
2. Stoch RSI Divs Zone Crypto by Gammaprod
- Teal or Green background.
- The lines is shaping green.
- Better if on the bottom (at a range 20).
3. MACD Volume Crypto by Gammaprod
- Teal or Green background.
- The lines is shaped or shaping green.
- Better if at the green histogram.
B. Bearish
1. Trendlines Boll Ichi Crypto by Gammaprod
- The candles below the purple cloud.
- Lagging span (red line) below the candles.
- then open buy near yellow line (the first option) / white line (the second option) (always confirm the position with two other indicators below).
2. Stoch RSI Divs Zone Crypto by Gammaprod
- Pink or purple background.
- The lines are shaping pink.
- Better if the line on the top (at a range 80).
3. MACD Volume Crypto by Gammaprod
- Pink or purple background.
- The lines are shaped or shaping green.
- Better if at the pink histogram.
C. Consolidation
1. Trendlines Boll Ichi Crypto by Gammaprod
- The candles on the cloud (green or purple).
- Lagging span (red line) on the candles.
- then open buy near the white or blue line (always confirm the position with two other indicators below).
2. Stoch RSI Divs Zone Crypto by Gammaprod
- Mix background specially on a timeframe 15m or more.
- The line move fast up and down.
- Better if on the bottom or the top of the lines (at a range 20 or 80).
3. MACD Volume Crypto by Gammaprod
- Changing the background.
- The line is near the middle line.
- Have small Histogram.
>> The secret ingridient is comparing the timeframe :
The example scalping (Timeframe 1m, 5m and 15m)
- TF 1m is for making an open position.
- TF 5m is for making a judgement of the trend market.
- TF 15m is to confirm that judgement from TF 5m, be careful if it not similar then it used to be a consolidation or the beginning of the reversal.
There's a lot a way to open the position than above information that i gave it to you, but consider there are a limit char on this column, I hope it will help your trading and make a more profit on it.

Stoch RSI, Div, Zone S3 by Gammaprod>> How to use this indicator :
1. Set your teadingview theme to dark theme.
2. My indicator is valid for forex, stock and but more valid for crypto.
3. Use three timeframe for more validation (choose between those, that fit to your trading style) :
- Timeframe 1m, 5m, and 15m for Scalping
- Timeframe 30m, 1h and 4h for Intraday
- Timeframe 4h, 1D and 1W for Swing Trading
4 . Always use THREE INDICATORS FROM GAMMAPROD, those three indicators is back to back each other, by the way, I only made those three indicators only (for now) :
- Trendlines Boll Ichi Crypto by Gammaprod
- Stoch RSI Divs Zone Crypto by Gammaprod
- MACD Volume Crypto by Gammaprod
>> How to setting :
1. Trendlines Boll Ichi Crypto by Gammaprod
A. Support and Resistence
- Well if you familiar with this indicator you can add it, but recommended for Timeframe 30m or more
B. Trendlines Primary or Trendlines Secondary
- Timeframe 1m you DON'T NEED Trendlines Primary or Trendlines Secondary
- Timeframe 5m you DON'T NEED Trendlines Secondary, but you CAN ADD Trendlines Primary if you fell it helpful (for me, it is helpful to find where the candles start or the end trend or a consolidation or where the candles will surpass a resistance or a support).
- Timeframe 15m you DON'T NEED Trendlines Secondary, DEFENITELY add Trendlines Primary it will help to find where the candles stop or a consolidation or where the candles will surpass a resistance or a support).
- Timeframe 30m or more, DEFENITELY NEED BOTH Trendlines Primary and Secondary Trendlines, it will help to find where the candle stop or consolidation or where the candle will surpass a resistance or support).
C. Bolinger, Ichimoku Cloud and Lagging Span
- Please DON'T CHANGE IT at all, it's really helpful to know when and where to make an entry decesion or a trend or a consolidation, if you don't understand how to read it, you better to learn it first (on "how to read" section and "How to OPEN position" the section below)
2. Stoch RSI Divs Zone Crypto by Gammaprod (DON'T CHANGE IT)
3. MACD Volume Crypto by Gammaprod (DON'T CHANGE IT)
>> How to read :
1. Sell or Buy Priority :
A. Buy Priority
- Color background on macd and stoch rsi is pink or purple sell is the priority, (if you're not sure to buy, just wait until the best moment to sell)
B. Buy Priority
- Color background on macd and stoch rsi Teal or light green buy is the priority, (if you're not sure to sell, just wait until the best moment to buy)
C. Indecision / Golden Moment
- Color background on stoch rsi yellow is indecision / golden moment of reversal pattern (wait until it formed background only on Stoch RSI), please becareful at this moment.
2. Trend / Consolidation :
A. BULLISH trend
- When Stoch RSI and MACD have teal or light green background that's means BULLISH trend, better to confirm by the candle is above green cloud and lagging span (red line) is also above the candle.
B. BEARISH trend
- When Stoch RSI and MACD have the Pink or purple background that's means BEARISH trend, better to confirm by the candle is above purple cloud and lagging span (red line) is also below the candle.
C. CONSOLIDATION
- When Stoch RSI have the mix background that's means CONSOLIDATION, better to confirm by the candle is in or near to green / purple cloud and lagging span (red line) is also on the candle.
3. Special Mark
A. Ideal Bullish :
- Near line 20 and green / teal background = When Stoch RSI have the char R / H on lime color label, that's means divergence or hidden divergence for buy position, if you not see this label that's means just a standard confirmation for buy
B. Not an Ideal Bullish :
- Near line 80 and green / teal background = if this happens make sure you know what happen, it could be a false signal or bullish continual pattern
C. Ideal Bearish :
- Near line 80 and pink / purple background = When Stoch RSI have the char R / H on lime color label, that's means divergence or hidden divergence for buy position, if you not see this label that's means just a standard confirmation for sell position.
D. Not an Ideal Bearish:
- Near line 20 and pink / purple background = if this happens make sure you know what happen, it could be a false signal or bearish continual pattern
E. The Beginning of Reversal (from BEARISH to BULLISH) :
- When Stoch RSI line shaping GREEN position is near 20.
- MACD lines still PINK, position lines is UNDER the HISTOGRAM, but the HISTOGRAM start to SHAPE FALL PINK (light pink) and the BACKGROUND still PINK / PURPLE.
- Position CANDLES NEAR BLUE line, NEAR PURPLE CLOUD, and lagging span (red line) STILL ON the area candle. (it used to be confirmed with the golden moment).
F. The Beginning of Reversal (from BULLISH to BEARISH) :
- When Stoch RSI line shaping PINK position is near 80.
- MACD lines still GREEN, position lines is ABOVE the HISTOGRAM, but the HISTOGRAM start to SHAPE FALL GREEN (light green) and the BACKGROUND still TEAL / GREEN.
- Position CANDLES NEAR WHITE line, NEAR TEAL CLOUD, and lagging span (red line) STILL ON the area candle. (it used to be confirmed with the golden moment).
G. False Signals, or It could be a Golden Moment (better to see it on TF 15 or bigger):
- Near line 20 or 80 and yellow background = When Stoch RSI have the char R / H on color label, that's means divergence or hidden divergence for buy / sell position, if you not see this label that's means just a standard confirmation for buy / sell depends on where the Stoch RSI line if near 20 that's means buy, near 80 means sell
>> How to OPEN position:
A. Bullish
1. Trendlines Boll Ichi Crypto by Gammaprod
- The candles above the green cloud.
- Lagging span (red line) above the candles.
- then open buy near yellow line (the first option) / blue line (the second option) (always confirm the position with two other indicators below).
2. Stoch RSI Divs Zone Crypto by Gammaprod
- Teal or Green background.
- The lines is shaping green.
- Better if on the bottom (at a range 20).
3. MACD Volume Crypto by Gammaprod
- Teal or Green background.
- The lines is shaped or shaping green.
- Better if at the green histogram.
B. Bearish
1. Trendlines Boll Ichi Crypto by Gammaprod
- The candles below the purple cloud.
- Lagging span (red line) below the candles.
- then open buy near yellow line (the first option) / white line (the second option) (always confirm the position with two other indicators below).
2. Stoch RSI Divs Zone Crypto by Gammaprod
- Pink or purple background.
- The lines are shaping pink.
- Better if the line on the top (at a range 80).
3. MACD Volume Crypto by Gammaprod
- Pink or purple background.
- The lines are shaped or shaping green.
- Better if at the pink histogram.
C. Consolidation
1. Trendlines Boll Ichi Crypto by Gammaprod
- The candles on the cloud (green or purple).
- Lagging span (red line) on the candles.
- then open buy near the white or blue line (always confirm the position with two other indicators below).
2. Stoch RSI Divs Zone Crypto by Gammaprod
- Mix background specially on a timeframe 15m or more.
- The line move fast up and down.
- Better if on the bottom or the top of the lines (at a range 20 or 80).
3. MACD Volume Crypto by Gammaprod
- Changing the background.
- The line is near the middle line.
- Have small Histogram.
>> The secret ingridient is comparing the timeframe :
The example scalping (Timeframe 1m, 5m and 15m)
- TF 1m is for making an open position.
- TF 5m is for making a judgement of the trend market.
- TF 15m is to confirm that judgement from TF 5m, be careful if it not similar then it used to be a consolidation or the beginning of the reversal.
There's a lot a way to open the position than above information that i gave it to you, but consider there are a limit char on this column, I hope it will help your trading and make a more profit on it.

3EMA + Boullinger + PIVOTTRES EMAS + BANDAS DE BOLLINGER + PIVOTE
INDICADOR 1: TRES EMAS (MEDIA MOVIL EXPONENCIAL)
Con este indicador puede visualizar el promedio de precios con mayor peso a los datos mas recientes.
Se calculan y dibujan tres medias móviles exponenciales: 8, 20 y 200 últimas velas.
-Rápida EMA1 = 8
-Media EMA2 = 20
-Lenta EMA 3 = 200
INDICADOR 2: BANDAS DE BOLLINGER
Con este indicador podrá ver la fuerza y la tendencia del mercado, es decir la mide la volatilidad del precio del activo.
Si el precio sobrepasa la banda superior, el activo está sobrecomprado.
Si el precio sobrepasa la banda inferior, el activo está sobrevendido.
Longitud tendencia - BASE = 20, paso = 1
Desviación Estándar - Multiplicador = 2, paso = 0.2
INDICADOR 3: PIVOTE
Este indicador etiqueta los puntos donde el precio es mínimo y máximo, en un rango de velas determinado en el parámetro "Distancia para el Pivote".
Estos 3 indicadores sirven para todo tipo de activos: FOREX, CRIPTO, CFD´s, ETC.
------------------------------------------------------------------------------------------------------------------
THREE EMAS + BOLLINGER BANDS + PIVOT
INDICATOR 1: THREE EMAS ( EXPONENTIAL MOVING AVERAGE )
With this indicator you can visualize the average of prices with greater weight to the most recent data.
Three exponential moving averages are calculated and drawn: 4, 20 and 200 last candles.
-Fast EMA1 = 8
-Average EMA2 = 20
-Slow EMA 3 = 200
INDICATOR 2: BOLLINGER BANDS
With this indicator you can see the strength and trend of the market, that is, it is measured by the volatility of the asset price.
If the price goes above the upper band, the asset is overbought.
If the price goes above the lower band, the asset is oversold.
Trend length - BASE = 20, step = 1
Standard Deviation - Multiplier = 2, step = 0.2
INDICATOR 3: PIVOT
This indicator labels the points where the price is minimum and maximum, in a range of candles determined in the parameter "Distance to Pivot".
These 3 indicators are used for all types of assets: FOREX, CRYPT, CFD's, ETC.

Realtime FootprintThe purpose of this script is to gain a better understanding of the order flow by the footprint. To that end, i have added unusual features in addition to the standard features.
I use "Real Time 5D Profile by LucF" main engine to create basic footprint(profile type) and added some popular features and my favorites.
This script can only be used in realtime, because tradingview doesn't provide historical Bid/Ask date.
Bid/Ask date used this script are up/down ticks.
This script can only be used by time based chart (1m, 5m , 60m and daily etc)
This script use many labels and these are limited max 500, so you can't display many bars.
If you want to display foot print bars longer, turn off the unused sub-display function.
Default setting is footprint is 25 labels, IB count is 1, COT high and Ratio high is 1, COT low and Ratio low is 1 and Delta Box Ratio Volume is 1 , total 29.
plus UA , IB stripes , ladder fading mark use several labels.
///////// General Setting ///////////
Resets on Volume / Range bar
: If you want to use simple time based Resets on, please set Total Volume is 0.
Your timeframe is always the first condition. So if you set Total Volume is 1000, both conditions(Volume >= 1000 and your timeframe start next bar) must be met. (that is, new footprint bar doesn't start at when total volume = exactly 1000).
Ticks per row and Maximum row of Bar
: 1 is minimum size(tick). "Maximum row of Bar" decide the number of rows used in one footprint. 1 row is created from 1 label, so you need to reduce this number to display many footprints (Max label is 500).
Volume Filter and For Calculation and Display
: "Volume Filter" decide minimum size of using volume for this script.
"For Calculation and Display" is used to convert volume to an integer.
This script only use integer to make profile look better (I contained Bid number and Ask number in one row( one label) to saving labels. This require to make no difference in width by the number of digits and this script corresponds integers from 0 to 3 digits).
ex) Symbol average volume size is from 0.0001 to 0.001. You decide only use Volume >= 0.0005 by "Volume Filter".
Next, you convert volume to integer, by setting "For Calculation and Display" is 1000 (0.0005 * 1000 = 5).
If 0.00052 → 5.2 → 5, 0.00058 → 5.8 → 6 (Decimal numbers are rounded off)
This integer is used to all calculation in this script.
//////// Main Display ///////
Footprint, Total, Row Delta, Diagonal Delta and Profile
: "Footprint" display Ask and Bid per row. "Total" display Ask + Bid per row.
"Row Delta" display Ask - Bid per row. "Diagonal Delta" display Ask(row N) - Bid(row N -1) per row.
Profile display Total Volume(Ask + Bid) per row by using Block. Profile Block coloring are decided by Row Delta value(default: positive Row Delta (Ask > Bid) is greenish colors and negative Row Delta (Ask < Bid) is reddish colors.)
Volume per Profile Block, Row Imbalance Ratio and Delta Bull/Bear/Neutral Colors
: "Volume per Profile Block" decide one block contain how many total volume.
ex) When you set 20, Total volume 70 display 3 block.
The maximum number of blocks that can be used per low is 20.
So if you set 20, Total volume 400 is 20 blocks. total volume 800 is 20 blocks too.
"Row Imbalance Ratio" decide block coloring. The row imbalance is that the difference between Ask and Bid (row delta) is large.
default is x3, x2 and x1. The larger the difference, the brighter the color.
ex) Ask 30 Bid 10 is light green. Ask 20 Bid 10 is green. Ask 11 Bid 10 is dark green.
Ask 0 Bid 1 is light red. Ask 1 Bid 2 is red. ask 30 Bid 59 is dark green.
Ask 10 Bid 10 is neutral color(gray)
profile coloring is reflected same row's other elements(Ask, Bid, Total and Delta) too.
It's because one label can only use one text color.
/////// Sub Display ///////
Delta, total and Commitment of Traders
: "Delta" is total Ask - total Bid in one footprint bar. Total is total Ask + total Bid in one footprint bar.
"Commitment of traders" is variation of "Delta". COT High is reset to 0 when current highest is touched. COT Low is opposite.
Basic concept of Delta is to compare price with Delta. Ordinary, when price move up, delta is positive. Price move down is negative delta.
This is because market orders move price and market orders are counted by Delta (although this description is not exactly correct).
But, sometimes prices do not move even though many market orders are putting pressure on price , or conversely, price move strongly without many market orders.
This is key point. Big player absorb market orders by iceberg order(Subdivide large orders and pretend to be small limit orders.
Small limit orders look weak in the order book, but they are added each time you fill, so they are more powerful than they look.), so price don't move.
On the other hand, when the price is moving easily, smart players may be aiming to attract and counterattack to a better price for them.
It's more of a sport than science, and there's always no right response. Pay attention to the relationship between price, volume and delta.
ex) If COT Low is large negative value, it means many sell market orders is coming, but iceberg order is absorbing their attack at limit order.
you should not do buy entry, only this clue. but this is one of the hints.
"Delta, Box Ratio and Total texts is contained same label and its color are "Delta" coloring. Positive Delta is Delta Bull color(green),Negative Delta is Delta Bear Color
and Delta = 0 is Neutral Color(gray). When Delta direction and price direction are opposite is Delta Divergence Color(yellow).
I didn't add the cumulative volume delta because I prefer to display the CVD line on the price chart rather than the number.
Box Ratio , Box Ratio Divisor and Heavy Box Ratio Ratio
: This is not ordinary footprint features, but I like this concept so I added.
Box Ratio by Richard W. Arms is simple but useful tool. calculation is "total volume (one bar) divided by Bar range (highest - lowest)."
When Bull and bear are fighting fiercely this number become large, and then important price move happen.
I made average BR from something like 5 SMA and if current BR exceeds average BR x (Heavy Box Ratio Ratio), BR box mark will be filled.
Box Ratio Divisor is used to good looking display(BR multiplied by Box Ratio Divisor is rounded off and displayed as an integer)
Diagonal Imbalance Count , D IB Mark and D IB Stripes
: Diagonal Imbalance is defined by "Diagonal Imbalance Ratio".
ex) You set 2. When Ask(row N) 30 Bid(row N -1)10, it's 30 > 10*2, so positive Diagonal Imbalance.
When Ask(row N) 4 Bid(row N -1)9, it's 4*2 < 9, so negative Diagonal Imbalance.
This calculation does not use equals to avoid Ask(row N) 0 Bid(row N -1)0 became Diagonal Imbalance.
Ask(row N) 0 Bid(row N -1)0, it's 0 = 0*2, not Diagonal Imbalance. Ask(row N) 10 Bid(row N -1)5, it's 10 = 5*2, not Diagonal Imbalance.
"D IB Mark" emphasize Ask or Bid number which is dominant side(Winner of Diagonal Imbalance calculation), by under line.
"Diagonal Imbalance Count" compare Ask side D IB Mark to Bid side D IB Mark in one footprint.
Coloring depend on which is more aggressive side (it has many IB Mark) and When Aggressive direction and price direction are opposite is Delta Divergence Color(yellow).
"D IB Stripes" is a function that further emphasizes with an arrow Mark, when a DIB mark is added on the same side for three consecutive row. Three consecutive arrow is added at third row.
Unfinished Auction, Ratio Bounds and Ladder fading Mark
: "Unfinished Auction" emphasize highest or lowest row which has both Ask and Bid, by Delta Divergence Color(yellow) XXXXXX mark.
Unfinished Auction sometimes has magnet effect, price may touch and breakout at UA side in the future.
This concept is famous as profit taking target than entry decision.
But, I'm interested in the case that Big player make fake breakout at UA side and trapped retail traders, and then do reversal with retail traders stop-loss hunt.
Anyway, it's not stand alone signal.
"Ratio Bounds" gauge decrease of pressure at extreme price. Ratio Bounds High is number which second highest ask is divided by highest ask.
Ratio Bounds Low is number which second lowest bid is divided by lowest bid. The larger the number, the less momentum the price has.
ex)first footprint bar has Ratio Bounds Low 2, second footprint bar has RBL 4, third footprint bar has RBL 20.
This indicates that the bear's power is gradually diminishing.
"Ladder fading mark" emphasizes the decrease of the value in 3 consecutive row at extreme price. I added two type Marks.
Ask/Bid type(triangle Mark) is Ask/Bid values are decreasing of three consecutive row at extreme price.
Row Imbalance type(Diamond Mark) are row Imbalance values are decreasing of three consecutive row at extreme price.
ex)Third lowest Bid 40, second lowest Bid 10 and lowest Bid 5 have triangle up Mark. That is bear's power is gradually diminishing.
(This Mark only check Bid value at lowest price and Ask value at highest price).
Third highest row delta + 60, second highest row delta + 5, highest delta - 20 have diamond Mark. That is Bull's power is gradually diminishing.
Sub display use Delta colors at bottom of Sub display section.
////// Candle & POC /////////
candle and POC
: Ordinary, "POC" Point of Control is row of largest total volume, but this script'POC is volume weighted average.
This is because the regular POC was visually displayed by the profile ,and I was influenced LucF's ideas.
POC coloring is decided in relation to the previous POC. When current POC is higher than previous POC, color is UP Bar Color(green).
In the opposite case, Down Bar color is used.
POC Divergence Color is used when Current POC is up but current bar close is lower than open (Down price Bar),or in the opposite case.
POC coloring has option also highlight background by Delta Divergence Color(yellow). but bg color is displayed at your time frame current price bar not current footprint bar.
The basic explanation is over.
I add some image to promote understanding basic ideas.

T3 + BB
TRES EMAS + BANDAS DE BOLLINGER
INDICADOR 1: TRES EMAS (MEDIA MOVIL EXPONENCIAL)
Con este indicador puede visualizar el promedio de precios con mayor peso a los datos mas recientes.
Se calculan y dibujan tres medias móviles exponenciales: 4, 20 y 200 últimas velas.
-Rápida EMA1 = 4, paso = 1
-Media EMA2 = 20, paso = 2
-Lenta EMA 3 = 200, paso = 10
INDICADOR 2: BANDAS DE BOLLINGER
Con este indicador podrá ver la fuerza y la tendencia del mercado, es decir la mide la volatilidad del precio del activo.
Si el precio sobrepasa la banda superior, el activo está sobrecomprado.
Si el precio sobrepasa la banda inferior, el activo está sobrevendido.
Longitud tendencia - BASE = 20, paso = 1
Desviación Estándar - Multiplicador = 2, paso = 0.2
Estos 2 indicadores sirven para todo tipo de activos: FOREX, CRIPTO, CFD´s, ETC.
------------------------------------------------------------------------------------------------------------------
THREE EMAS + BOLLINGER BANDS
INDICATOR 1: THREE EMAS (EXPONENTIAL MOVING AVERAGE)
With this indicator you can visualize the average of prices with greater weight to the most recent data.
Three exponential moving averages are calculated and drawn: 4, 20 and 200 last candles.
-Fast EMA1 = 4, step = 1
-Average EMA2 = 20, step = 2
-Slow EMA 3 = 200, step = 10
INDICATOR 2: BOLLINGER BANDS
With this indicator you can see the strength and trend of the market, that is, it is measured by the volatility of the asset price.
If the price goes above the upper band, the asset is overbought.
If the price goes above the lower band, the asset is oversold.
Trend length - BASE = 20, step = 1
Standard Deviation - Multiplier = 2, step = 0.2
These 2 indicators are used for all types of assets: FOREX, CRYPT, CFD's, ETC.

PROFIT INDICATORFirst let me tell you which indicators have been used in this script so that you have the confidence while taking the trade:
(a) Bollinger Band with 20 SMA Inside it - Currently it is off, you can turn it on from settings.
(b) HMA 33, I have added the option of using two HMA's simultaneously. You can use HMA, EMA, SMA as per your settings and it would be color trending.
(c) VWAP- you can turn it on from settings
(d) CPR- you can turn it on from settings
(e) EMA's 20, 50, 200. Currently off, you can turn it on from settings.
(d) SMA's 50 and 200. Currently off, yu can turn it on from settings, if you want to use 20 SMA you can use bollinger band basis that is 20 period SMA.
(f) Trend bar at bottom on the basis of 50 EMA.
(g) Half Trend
(h) Trend strength Detector
(d) EMA 50 high and low to show the pac channel. I am not using this however as per request I have added this. Currently, it is trun on and you can turn it off from settings.
(f) Auto Fib levels
Please use a stick note for few days and mention imp notes before taking trade to check if all the conditions are matching to take the trade.
Buy Condition:-
1. Bolling band should be widely open.
2. Check the support and resistance from CPR. Candle should close above support in green.
3. Check the trend bar at bottom, it should be green, if it is grey in colour dont enter in trade.
4. Candle should be closing above EMA 50 and its upto you if you need additional confirmation, you can use EMA 20, 50, 200 and SMA 50 and 200, this is optional.
5. You can use VWAP as support or resistance and you can turn it on from settings.
6. Trending HMA of 33 should be in green for buy.
7. Half trend Indicator should give buy signal.
8. Trend Strength Indicator for checking the strength of the trend, if the arrow is big upside, you can go for buy.
9. Exit from buy trade when it start showing very small arrow which means trend is about to change.
10.Exit buy trade at 61.8 Fib level
Sell Condition:-
1. Bolling band should be widely open.
2. Check the support and resistance from CPR. Candle should close below resistance in red.
3. Check the trend bar at bottom, it should be red, if it is grey in colour dont enter in trade.
4. Candle should be closing below EMA 50 and its upto you if you need additional confirmation, you can use EMA 20, 50, 200 and SMA 50 and 200, this is optional.
5. You can use VWAP as support or resistance and you can turn it on from settings.
6. Trending HMA of 33 should be in red for sell.
7. Half trend Indicator should give sell signal.
8. Trend Strength Indicator for checking the strength of the trend, if the arrow is big downside, you can go for sell.
9. Exit from sell trade when down arrows start showing very small in size which means trend is about to change.
10.Exit sell trade at 61.8 Fib level

4 SMAs & Inside Bar (Colored)SMAs and Inside Bar strategy is very common as far as Technical analysis is concern. This script is a combination of 10-20-50-200 SMA and Inside Bar Candle Identification.
SMA Crossover:
4 SMAs (10, 20, 50 & 200) are combined here in one single indicator.
Crossover signal for Buy as "B" will be shown in the chart if SMA 10 is above 20 & 50 and SMA 20 is above 50.
Crossover signal for Sell as "S" will be shown in the chart if SMA 10 is below 20 & 50 and SMA 20 is below 50.
Inside Bar Identification:
This is to simply identify if there is a inside bar candle. The logic is very simple - High of the previous candle should be higher than current candle and low of the previous candle should be lower than the current candle.
If the previous candle is red, the following candle would be Yellow - which may give some bullish view in most of the cases but not always
If the previous candle is green, the following candle would be Black - which may give some bearish view in most of the cases but not always
Be Cautious when you see alternate yellow and black candle, it may give move on the both side
Please comment if you have any interesting ideas to improve this indicator.

HYE Combo Market [Strategy] (Vwap Mean Reversion + Trend Hunter)In this strategy, I used a combination of trend hunter and vwap mean reversion strategies that I published before.
Trend Hunter Strategy:
Mean Reversion Vwap Strategy:
The results are quite impressive, especially for bitcoin.
While the hodl return for bitcoin was 13419%, the strategy's return in the same period was about 5 times (65000%) of this.
s3.tradingview.com
In this combo strategy, I made some changes to the original settings of the strategies used together and added some more new features.
Trend Hunter Strategy Settings: (Original / Combo)
- Slow Tenkansen Period : 9 / 9
- Slow Kijunsen Period : 26 / 13
- Fast Tenkansen Period : 5 / 3
- Fast Kijunsen Period : 13 / 7
- BB Length : 20 / 20
- BB Stdev : 2 / 2
- TSV Length : 13 / 20
- TSV Ema Length : 7 / 7
* I also added a "vidya moving average" to be used as a confirmation tool to open a long position. (Candle close must be above the vidya line.)
Vwap Mean Reversion Strategy Settings: (Original / Combo)
- Small Vwap : 2 / 8
- Big Vwap : 5 / 10
- Percent Below to Buy : 3 / 2
- RSI Period : 2 / 2
- RSI Ema Period : 5 / 5
- Maximum RSI Level for Buy : 30
* I also added a "mean vwap line" to be used for exits in this part of the strategy. In the original version, when small vwap crossovers big vwap, we close the position, but in this strategy we will wait for the close above the mean vwap.
TIPS AND WARNINGS
1-) The standard settings of this combo strategy is designed and tested with daily timeframe. For lower timeframes, you should change the strategy settings and find the best value for yourself.
2-) Only the mean vwap line is displayed on the graph. For a detailed view, you can delete the "//" marks from the plot codes in the strategy code.
3-) This is a strategy for educational and experimental purposes. It cannot be considered as investment advice. You should be careful and make your own risk assessment when opening real market trades using this strategy.
________________________________________________________
Bu stratejide, daha önce yayınladığım trend avcısı ve vwap ortalamaya geri dönüş stratejilerinin bir kombinasyonunu kullandım.
Sonuçlar özellikle bitcoin için oldukça etkileyici.
Bitcoin için hodl getirisi %13419 iken, stratejinin aynı dönemdeki getirisi bunun yaklaşık 5 katı (%65000) idi.
Bu kombo stratejide, birlikte kullanılan stratejilerin orijinal ayarlarında bazı değişiklikler yaptım ve bazı yeni özellikler ekledim.
Trend Avcısı Strateji Ayarları: (Orijinal / Combo)
- Yavaş Tenkansen Periyodu : 9 / 9
- Yavaş Kijunsen Periyodu : 26 / 13
- Hızlı Tenkansen Periyodu : 5 / 3
- Hızlı Kijunsen Periyodu : 13 / 7
- BB Uzunluğu : 20 / 20
- BB Standart Sapması : 2 / 2
- TSV Uzunluğu : 13 / 20
- TSV Ema Uzunluğu : 7 / 7
* Ayrıca long pozisyon açmak için onay aracı olarak kullanılmak üzere "vidya hareketli ortalama" ekledim. (Mum kapanışı vidya çizgisinin üzerinde olmalıdır.)
Vwap Ortalamaya Dönüş Stratejisi Ayarları: (Orijinal / Combo)
- Küçük Vwap : 2 / 8
- Büyük Vwap : 5 / 10
- Alış İçin Gerekli Fark Oranı : 3 / 2
- RSI Periyodu : 2 / 2
- RSI Ema Periyodu: 5 / 5
- Alış için gerekli maksimum RSI seviyesi : 30
* Stratejinin bu bölümünde pozisyondan çıkışlar için kullanılacak bir "ortalama vwap çizgisi" de ekledim. Orijinal versiyonda, küçük vwap, büyük vwap'ı yukarı kestiğinde pozisyonu kapatıyoruz, ancak bu stratejide, ortalama vwap'ın üzerindeki kapanışı bekleyeceğiz.
İPUÇLARI VE UYARILAR
1-) Bu birleşik stratejinin standart ayarları, günlük zaman dilimi ile tasarlanmış ve test edilmiştir. Daha düşük zaman dilimleri için strateji ayarlarını değiştirmeli ve kendiniz için en iyi değeri bulmalısınız.
2-) Grafikte sadece ortalama vwap çizgisi görüntülenir. Ayrıntılı bir görünüm için strateji kodundaki "plot" ile başlayan satırlarda grafikte görünmesini istediğiniz özelliğin önündeki "//" işaretlerini silebilirsiniz.
3-) Eğitim ve deneysel amaçlı bir stratejidir. Yatırım tavsiyesi olarak değerlendirilemez. Bu stratejiyi kullanarak gerçek piyasa işlem açarken dikkatli olmalı ve kendi risk değerlendirmenizi yapmalısınız.

Price Distance to its MA by DGTPrices high above the moving average (MA) or low below it are likely to be remedied in the future by a reverse price movement as stated in an Article by Denis Alajbeg, Zoran Bubas and Dina Vasic published in International Journal of Economics, Commerce and Management
Here comes a study to indicate the idea of this article, Price Distance to its Moving Averages (P/MA Ratio)
The analysis expressed in the paper indicates that there is a connection between the distance of the prices to moving averages and subsequent returns : portfolios of stocks with lower prices to moving averages generally outperformed portfolios of stocks with higher prices to moving averages. This “overextended” effect is more pronounced when using shorter moving averages of 20 and 50 days, and is especially strong in short-term holding periods like one and two weeks. The highest annual returns are recorded when buying in the range of 0-5% below shorter moving averages of 20/50 days, and 0-10% below longer moving averages of 100/200 days. However, buying very far below almost all moving averages on almost all holding periods produces the lowest returns.
The concept of this study recognizes three different modes of action.
In a clearly established upward trend traders should be buying when prices are near or below the MA line and selling when prices move too far above the MA.
Conversely, in downward trend stocks should be shorted when reaching or going above the moving average and covered when they drop too far below the MA line.
In a sideways movement traders are advised to buy if the price is too low below the moving average and sell when it goes too far above it
Short-term traders can expect to outperform in a one or two week time window if buying stocks with lower prices compared to their 20 and 50 SMA/EMA, one to two-week holding periods is quite high, ranging from 72,09% to 90,61% for the SMA(20, 50) and 85,03% to 87,5% for the EMA(20, 50). The best results for the SMA 20 and 50, on average, are concentrated in the region of 0-5% below the MA for the majority of holding periods. Buying very far below almost all MA in almost all holding periods turns out to be the worst possible option
Candle patterns, momentum could be used in conjunction with this indicator for better results. Try Colored DMI and Ichimoku colored SuperTrend by DGT

Turtle Trade Channels by KıvanÇ fr3762his trend following system was designed by Dennis Gartman and Bill Eckhart, and relies on breakouts of historical highs and lows to take and close trades: it is the complete opposite to the "buy low and sell high" approach. This trend following system was taught to a group of average and normal individuals, and almost everyone turned into a profitable trader.
The main rule is "Trade an N-day breakout and take profits when an M-day high or low is breached (N must me above M)". Examples:
Buy a 10-day breakout and close the trade when price action reaches a 5-day low.
Go short a 20-day breakout and close the trade when price action reaches a 10-day high.
In this indicator, the red line is the trading line, and the dotted blue line is the exit line. Original system is:
Go long when the trading line crosses below close price
Go short when the trading line rosses above close price
Exit long positions when the price touches the exit line
Exit short positions when the price touches the exit line
Recommended initial stop-loss is ATR * 2 from the opening price. Default system parameters were 20,10 and 55,20.
Original Turtle Rules:
To trade exactly like the turtles did, you need to set up two indicators representing the main and the failsafe system.
Set up the main indicator with TradePeriod = 20 and StopPeriod = 10 (A.k.a S1)
Set up the failsafe indicator with TradePeriod = 55 and StopPeriod = 20 using a different color. (A.k.a S2)
The entry strategy using S1 is as follows
Buy 20-day breakouts using S1 only if last signaled trade was a loss.
Sell 20-day breakouts using S1 only if last signaled trade was a loss.
If last signaled trade by S1 was a win, you shouldn't trade -Irregardless of the direction or if you traded last signal it or not-
The entry strategy using S2 is as follows:
Buy 55-day breakouts only if you ignored last S1 signal and the market is rallying without you
Sell 55-day breakouts only if you ignored last S1 signal and the market is pluging without you
The turtles had a progressive position sizing approach that boosted their winnings. Once a trading decision has been made you should...
Developers: Dennis Gartman and Bill Eckhart
İndikatörü geliştiren: Dennis Gartman and Bill Eckhart

MACD/EMA Long StrategyThis incredibly simple strategy uses a combination of the 20 EMA and bullish/bearish MACD crosses as a low risk method of getting in and out of markets.
Depending on whether the market is above or below the 200 SMA, the script determines if the market is in bullish or bearish territory. Above the 200 SMA, the script will ignore the 20 EMA as a buy condition and buy solely on the confirmation of a bullish MACD cross upon the close of a candle. In this bullish market, the script will only enable the sell condition if both the MACD is bearish AND a close below the 20 EMA occurs. This is to reduce the chances of the script selling prematurely in the event of a bearish MACD cross, if the market is still in overall bullish territory.
When the market is below the 200 SMA, the confirmation occurs in the opposite direction. The buy condition will only be met if both the MACD is bullish AND a close above the 20 EMA occurs. However, the sell condition ignores the 20 EMA and will sell solely on the confirmation of a bearish MACD cross upon the close of the candle.
This strategy can be used in both bullish and bearish markets. This conservative strategy will slightly underperform in a bull market, with the sell condition occasionally being met and then potentially buying back higher. However, it will successfully get you out of a turning market and automatically switch into a more 'risk-off' mentality during a bear market. This strategy is not recommended for sideways markets, as trading around the 20 EMA coupled with a relatively flat MACD profile can cause the strategy to buy the peaks and sell troughs easily.

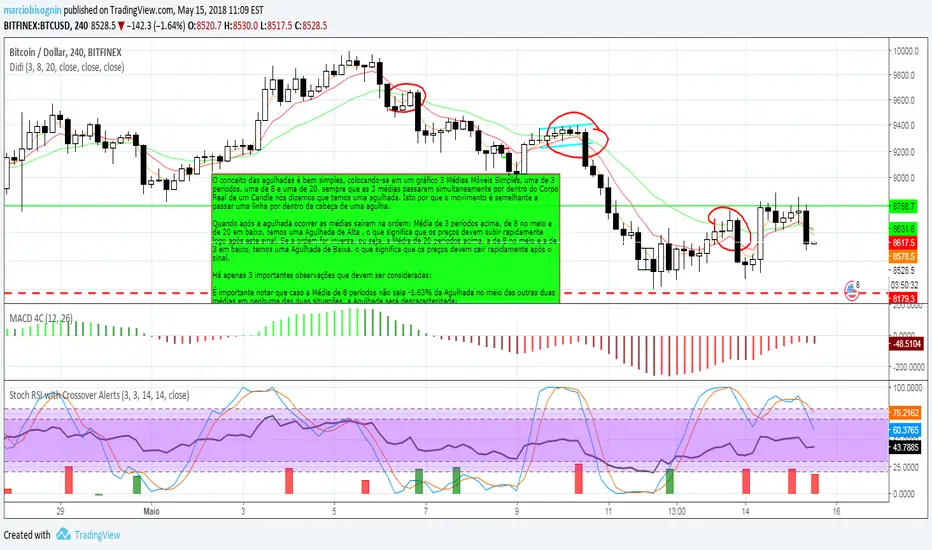
Didi Index OriginalO conceito das agulhadas é bem simples, colocando-se em um gráfico 3 Médias Móveis Simples, uma de 3 períodos, uma de 8 e uma de 20, sempre que as 3 médias passarem simultaneamente por dentro do Corpo Real de um Candle nós dizemos que temos uma agulhada. Isto por que o movimento é semelhante a passar uma linha por dentro da cabeça de uma agulha.
Quando após a agulhada ocorrer as médias saírem na ordem: Média de 3 períodos acima, de 8 no meio e de 20 em baixo, temos uma Agulhada de Alta , o que significa que os preços devem subir rapidamente logo após este sinal. Se a ordem for inversa, ou seja, a Média de 20 períodos acima, a de 8 no meio e a de 3 em baixo, temos uma Agulhada de Baixa, o que significa que os preços devem cair rapidamente após o sinal.
Há apenas 3 importantes observações que devem ser consideradas:
É importante notar que caso a Média de 8 períodos não saia -1.63% da Agulhada no meio das outras duas médias em nenhuma das duas situações, a Agulhada será descaracterizada;
Após a Agulhada ser observada, é importante aguardar pela confirmação do sinal por mais uma barra para evitar sinais falso.
Este é o conceito tradicional.
------
The concept of the needles is very simple, placing on a graph 3 Simple Moving Averages, one of 3 periods, one of 8 and one of 20, whenever the 3 means pass simultaneously inside the Real Body of a Candle we say that we have a needle. This is because the movement is similar to passing a line through the head of a needle.
When after the needling occurs the averages come out in the order: Average of 3 periods above, 8 in the middle and 20 in lower, we have a High Needle, which means that prices must rise rapidly soon after this signal. If the order is the reverse, ie the average of 20 periods above, that of 8 in the middle and that of 3 down, we have a Down Needle, which means that prices must drop quickly after the signal.
There are only 3 important observations that should be considered:
It is important to note that if the Mean of 8 periods does not leave the Needle in the middle of the other two means in either of the two situations, the Needle will be decharacterized;
After the Needle is observed, it is important to wait for the confirmation of the signal for another bar to avoid false signals.
This is the traditional concept.
Aroon Single Line This indicator converts double lined Aroon indicator into a single line oscillator.
It is simply obtained by subtracting Aroon down from Aroon Up.
*If Oscillator points 100 value, it means there is a Strong Uptrend.
*If Oscillator points values between 100 and 40, it means there is an uptrend.
*If Oscillator points values between 20 and -20, it means no trend, it is sideways.But, when it is sideways; generally, oscillator makes FLAT LINES
between 20 and -20 values. 0 value is pointed out when the trend is downward as well, which means aroon up=aroon down.
*If Oscillator points values between -40 and -100, it means there is a downtrend.
*If Oscillator points -100 value, it means there is a Strong downtrend.
(20, 40) and (-20, -40) intervals are not mentioned, because; generally these are transition values and hard to comment, it will be more certain to
wait till values are between or at the reference values given.

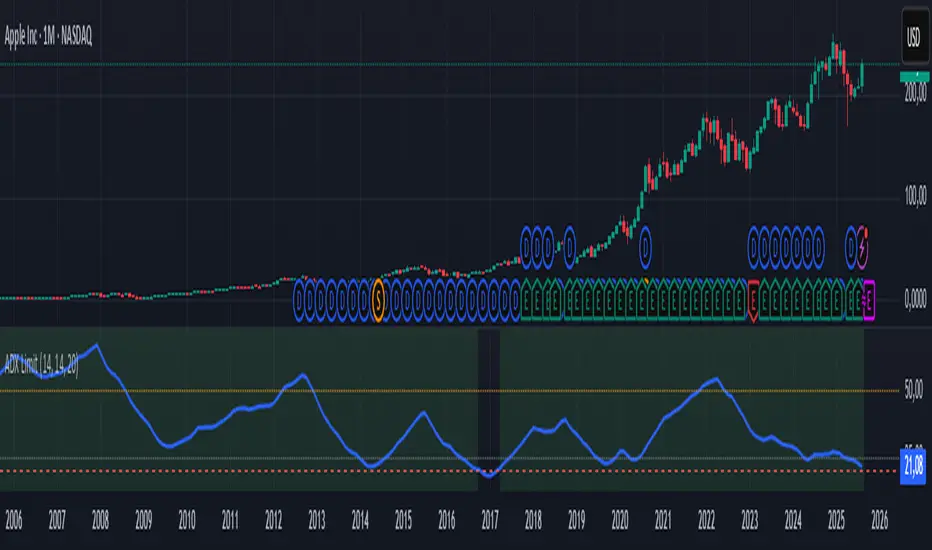
ADX with Custom Limit LineADX with Custom Limit Line - Educational Indicator
═════════════════════════════════════════════════════════════
WHAT IS THIS INDICATOR?
This indicator displays the Average Directional Index (ADX) with a fully customizable limit line, designed specifically for educational purposes and trend strength analysis learning.
ORIGINALITY AND PURPOSE
Unlike standard ADX indicators that use fixed reference levels, this version allows traders to set their own custom threshold line based on their specific trading strategy requirements. The indicator focuses purely on trend strength measurement while removing directional noise from +DI/-DI lines for cleaner analysis.
HOW IT WORKS
The ADX calculation uses the standard Welles Wilder formula:
• Calculates True Range and Directional Movement
• Smooths the values using the specified periods
• Applies additional smoothing to create the final ADX value
• Compares this value against your custom limit line
KEY FEATURES
🎯 Customizable Limit Line: Set your own threshold level (default: 20)
📊 Clean Visual Design: Focus on trend strength without directional confusion
📏 Reference Lines: Additional levels at 25 (weak trend) and 50 (strong trend)
🟢 Background Highlighting: Green background when ADX exceeds your limit
🔔 Multiple Alert Types: Notifications for limit crossovers and trend changes
⚙️ Flexible Parameters: Adjust DI Length and ADX Smoothing periods
SETTINGS EXPLANATION
DI Length (14): Period used for calculating +DI and -DI components
ADX Smoothing (14): Additional smoothing applied to the ADX calculation
Limit Line (20): Your custom threshold - adjust based on your strategy
Background Highlight: Toggle visual emphasis on/off
INTERPRETATION GUIDE
ADX < 20: Weak or absent trend - market may be ranging
ADX 20-25: Trend is developing but still weak
ADX 25-40: Moderate trend strength - consider trend-following strategies
ADX 40-50: Strong trend present - high-probability trend trades
ADX > 50: Very strong trend - momentum strategies may be effective
WHY THIS APPROACH?
This simplified version eliminates +DI/-DI lines to focus exclusively on trend STRENGTH rather than direction. This approach helps traders:
✓ Identify when trends are strong enough to trade
✓ Avoid choppy, sideways markets that can cause whipsaws
✓ Set objective criteria for trend-based strategy entry/exit
✓ Learn trend analysis without directional bias
ALERT SYSTEM
The indicator includes four distinct alert conditions:
1. ADX Above Custom Limit: When ADX crosses above your threshold
2. ADX Below Custom Limit: When ADX falls below your threshold
3. Strong Trend Formation: When ADX exceeds 40 (strong trend alert)
4. Weak Trend Warning: When ADX drops below 20 (ranging market alert)
EDUCATIONAL VALUE
This indicator serves as an excellent learning tool for understanding:
• How trend strength differs from trend direction
• The relationship between ADX values and market conditions
• Custom threshold optimization for different timeframes and instruments
• The importance of trend strength in trading system development
USAGE RECOMMENDATIONS
Combine with price action: Use ADX to confirm trend strength, not as standalone signals
Timeframe considerations: Higher timeframes typically show more reliable ADX readings
Market adaptation: Adjust your custom limit based on instrument volatility
Risk management: Always implement proper position sizing and stop losses
Paper trading: Test your custom limit settings before live trading
TECHNICAL LIMITATIONS
⚠️ ADX is a lagging indicator based on historical price data
⚠️ Strong ADX readings can persist during trend exhaustion phases
⚠️ No indicator provides 100% accurate signals
⚠️ Market conditions can change rapidly regardless of ADX readings
⚠️ Should be used as part of a comprehensive trading strategy
═════════════════════════════════════════════════════════════
⚠️⚠️ IMPORTANT DISCLAIMER ⚠️⚠️
This indicator is provided for EDUCATIONAL PURPOSES ONLY and should NOT be considered as financial or investment advice.
RISK WARNING:
• Past performance does not guarantee future results
• All trading involves substantial risk of loss
• No indicator can predict future market movements with certainty
• Always use appropriate risk management techniques
• Never risk more capital than you can afford to lose completely
• Consider seeking advice from qualified financial professionals
RESPONSIBLE USAGE:
• This tool is designed for learning trend analysis concepts
• Use paper trading to understand the indicator's behavior
• Combine with fundamental analysis and market knowledge
• Implement proper risk management in all trading activities
• Remember that successful trading requires more than technical indicators
By using this indicator, you acknowledge understanding these risks and accept full responsibility for your trading decisions.
═════════════════════════════════════════════════════════════
Educational tool for trend strength analysis - Trade responsibly and never stop learning!
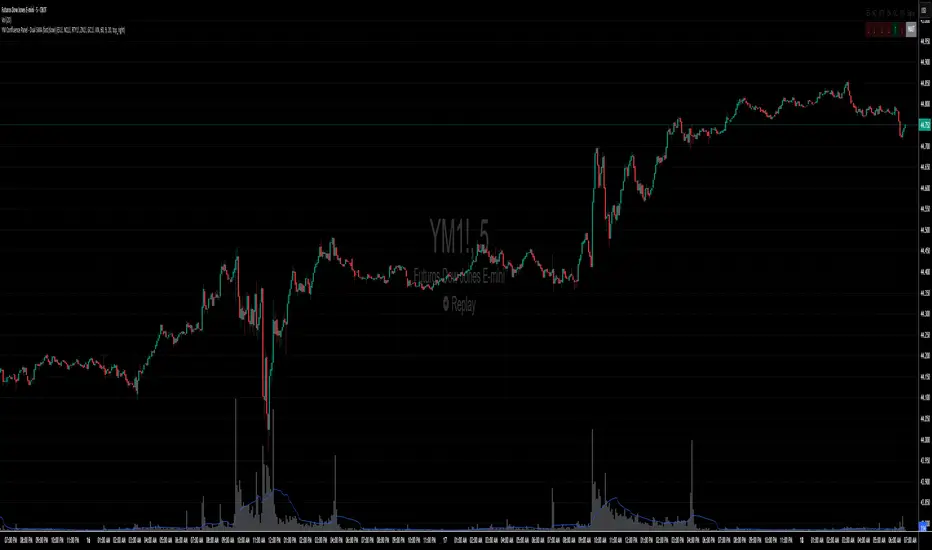
YM Confluence Panel - Dual SMA (fast/slow)This script displays a YM Confluence Panel for the mini Dow Jones (YM), using six correlated/inversely correlated assets (ES, NQ, RTY, ZN, GC, VIX) and two simple moving averages (fast: 9 / slow: 20).
The logic determines bullish or bearish conditions for each asset based on SMA relationships and price, generating arrows and an aggregated BUY / SELL / WAIT signal.
🔹 How it works:
• Correlated assets (ES, NQ, RTY): bullish when SMA(9) > SMA(20) and price above SMA(20).
• Inverse assets (ZN, GC, VIX): bullish when SMA(9) < SMA(20) and price below SMA(20).
• All bullish → BUY
• All bearish → SELL
• Otherwise → WAIT
✅ Customizable:
• Adjust assets and timeframes.
• Change SMA periods.
• Set panel position.
⚠️ Disclaimer: For educational purposes only. Not financial advice.
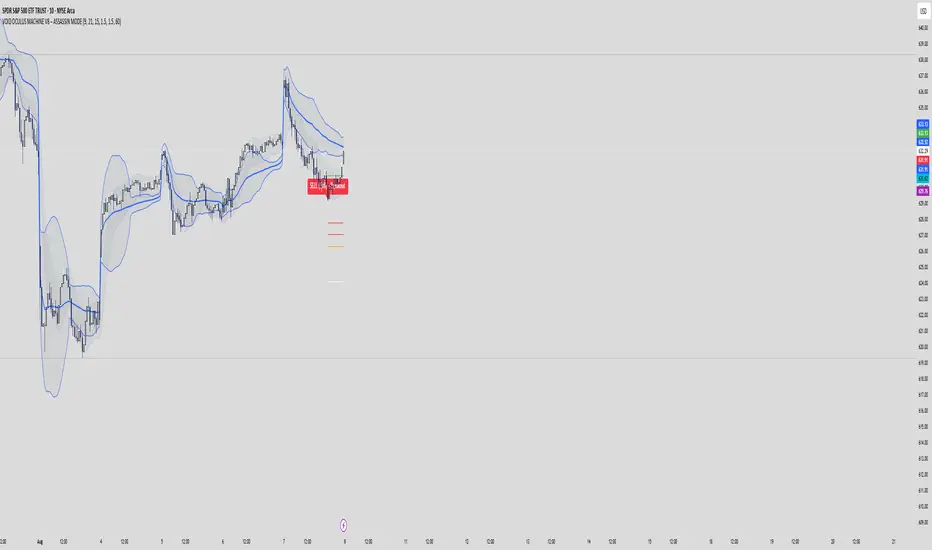
VOID OCULUS MACHINE V8 – ASSASSIN MODEVOID OCULUS MACHINE V8 – ASSASSIN MODE
Version 8.0 | Pine Script v6
Purpose & Originality
VOID OCULUS MACHINE V8 – ASSASSIN MODE brings together four advanced trading filters—EMA crossovers, TRIX momentum, VWAP band positioning, and a proprietary “Predictive Cloud”—into a single, high-precision entry system. Rather than relying on any one signal, it calculates a confidence score combining trend, momentum, volume, and volatility cues, then triggers only the highest-probability setups once a user-defined threshold is met. This multi-layer architecture offers traders laser-focused entries (“Assassin Mode”) with built-in risk (stop) and reward (targets) visualization.
How It Works & Component Rationale
EMA Trend Alignment
Fast EMA (9) vs. Slow EMA (21): Captures short-term versus medium-term trend. A bullish bias requires EMA9 > EMA21, bearish bias EMA9 < EMA21.
TRIX Momentum Filter
A triple-smoothed EMA oscillator over 15 bars, expressed as a percentage change. Positive TRIX confirms upward momentum; negative TRIX confirms downward momentum.
Gaussian Noise Reduction
Dual 5-period EMA smoothing of price removes short-term noise, creating a “cloud base.” Entries only fire when price interacts favorably with this smoothed baseline.
VWAP Band Confirmation (Optional)
Calculates session VWAP ± one standard deviation over 20 bars, plotting upper/lower bands. Traders can require price to sit above/below VWAP mid for trend confirmation.
Predictive Cloud Overlay
A dynamic band (Gaussian ± ATR) forecasts a near-term “value zone.” Pullback and reversal entries can occur as price re-enters or breaks out of this cloud.
Confidence Scoring
Starts at 0 and adds:
+30 for EMA trend alignment (bull or bear)
+20 for volume spike (>20-bar SMA)
+20 for non-zero TRIX slope
+20 for ATR expansion (volatility ramping)
+10 if price is above or below VWAP mid (if VWAP filter is enabled)
Only fires signals when confidence ≥ 60% (configurable), ensuring multi-factor confluence.
Entry Type Differentiation
Breakout: Price pierces prior 10-bar high/low on volume and ATR expansion.
Pullback: Trend bias plus a crossover of price with EMA9.
Reversal: Price crosses back into the Predictive Cloud from outside, confirmed by VWAP cross.
Automated Trade Visualization
On each signal, clears previous objects, plots a “BUY (xx%) – ” or “SELL (xx%) – ” label, four tiered ATR-based targets (1×, 1.5×, 2×, 3.5×), and a stop-loss (ATR × 1.5).
Inputs & Customization
Input Description Default
Fast EMA Length for short-term trend EMA 9
Slow EMA Length for medium-term trend EMA 21
TRIX Length Period for triple-smoothed momentum oscillator 15
Stop Multiplier ATR multiple for stop-loss distance 1.5
Target Multiplier ATR multiple for first profit target 1.5
Enable VWAP Filter Require price alignment above/below VWAP mid On
Minimum Confidence Confidence % threshold to trigger a signal 60
Show Predictive Cloud Toggle the Gaussian ± ATR cloud on/off On
How to Use
Apply to Chart: Suitable on 5 m–1 h timeframes for swing entries.
Adjust Confidence & Filters: Raise the Minimum Confidence to tighten setups; disable VWAP filter for pure price/momentum plays.
Read Signals:
“BUY (75%) – Breakout” label means 75% confluence across filters, triggered by a breakout entry type.
Four colored horizontal lines mark TP1–TP4; a red line marks your stop.
Manage the Trade:
Use the plotted stop-loss line; scale out at targets or trail behind the Predictive Cloud.
Unique Value
VOID OCULUS MACHINE V8 stands out by quantifying multi-dimensional market context into a single confidence score and providing automated trade object plotting—no more manual target calculations or cluttered charts. Its “Assassin Mode” ensures only the most compelling setups trigger, saving traders time and reducing noise.
Disclaimer
This indicator is for educational purposes. Past performance does not guarantee future results. Always backtest across symbols/timeframes, combine with personal discretion, and apply strict risk management before trading live.
FEDFUNDS Rate Divergence Oscillator [BackQuant]FEDFUNDS Rate Divergence Oscillator
1. Concept and Rationale
The United States Federal Funds Rate is the anchor around which global dollar liquidity and risk-free yield expectations revolve. When the Fed hikes, borrowing costs rise, liquidity tightens and most risk assets encounter head-winds. When it cuts, liquidity expands, speculative appetite often recovers. Bitcoin, a 24-hour permissionless asset sometimes described as “digital gold with venture-capital-like convexity,” is particularly sensitive to macro-liquidity swings.
The FED Divergence Oscillator quantifies the behavioural gap between short-term monetary policy (proxied by the effective Fed Funds Rate) and Bitcoin’s own percentage price change. By converting each series into identical rate-of-change units, subtracting them, then optionally smoothing the result, the script produces a single bounded-yet-dynamic line that tells you, at a glance, whether Bitcoin is outperforming or underperforming the policy backdrop—and by how much.
2. Data Pipeline
• Fed Funds Rate – Pulled directly from the FRED database via the ticker “FRED:FEDFUNDS,” sampled at daily frequency to synchronise with crypto closes.
• Bitcoin Price – By default the script forces a daily timeframe so that both series share time alignment, although you can disable that and plot the oscillator on intraday charts if you prefer.
• User Source Flexibility – The BTC series is not hard-wired; you can select any exchange-specific symbol or even swap BTC for another crypto or risk asset whose interaction with the Fed rate you wish to study.
3. Math under the Hood
(1) Rate of Change (ROC) – Both the Fed rate and BTC close are converted to percent return over a user-chosen lookback (default 30 bars). This means a cut from 5.25 percent to 5.00 percent feeds in as –4.76 percent, while a climb from 25 000 to 30 000 USD in BTC over the same window converts to +20 percent.
(2) Divergence Construction – The script subtracts the Fed ROC from the BTC ROC. Positive values show BTC appreciating faster than policy is tightening (or falling slower than the rate is cutting); negative values show the opposite.
(3) Optional Smoothing – Macro series are noisy. Toggle “Apply Smoothing” to calm the line with your preferred moving-average flavour: SMA, EMA, DEMA, TEMA, RMA, WMA or Hull. The default EMA-25 removes day-to-day whips while keeping turning points alive.
(4) Dynamic Colour Mapping – Rather than using a single hue, the oscillator line employs a gradient where deep greens represent strong bullish divergence and dark reds flag sharp bearish divergence. This heat-map approach lets you gauge intensity without squinting at numbers.
(5) Threshold Grid – Five horizontal guides create a structured regime map:
• Lower Extreme (–50 pct) and Upper Extreme (+50 pct) identify panic capitulations and euphoria blow-offs.
• Oversold (–20 pct) and Overbought (+20 pct) act as early warning alarms.
• Zero Line demarcates neutral alignment.
4. Chart Furniture and User Interface
• Oscillator fill with a secondary DEMA-30 “shader” offers depth perception: fat ribbons often precede high-volatility macro shifts.
• Optional bar-colouring paints candles green when the oscillator is above zero and red below, handy for visual correlation.
• Background tints when the line breaches extreme zones, making macro inflection weeks pop out in the replay bar.
• Everything—line width, thresholds, colours—can be customised so the indicator blends into any template.
5. Interpretation Guide
Macro Liquidity Pulse
• When the oscillator spends weeks above +20 while the Fed is still raising rates, Bitcoin is signalling liquidity tolerance or an anticipatory pivot view. That condition often marks the embryonic phase of major bull cycles (e.g., March 2020 rebound).
• Sustained prints below –20 while the Fed is already dovish indicate risk aversion or idiosyncratic crypto stress—think exchange scandals or broad flight to safety.
Regime Transition Signals
• Bullish cross through zero after a long sub-zero stint shows Bitcoin regaining upward escape velocity versus policy.
• Bearish cross under zero during a hiking cycle tells you monetary tightening has finally started to bite.
Momentum Exhaustion and Mean-Reversion
• Touches of +50 (or –50) come rarely; they are statistically stretched events. Fade strategies either taking profits or hedging have historically enjoyed positive expectancy.
• Inside-bar candlestick patterns or lower-timeframe bearish engulfings simultaneously with an extreme overbought print make high-probability short scalp setups, especially near weekly resistance. The same logic mirrors for oversold.
Pair Trading / Relative Value
• Combine the oscillator with spreads like BTC versus Nasdaq 100. When both the FED Divergence oscillator and the BTC–NDQ relative-strength line roll south together, the cross-asset confirmation amplifies conviction in a mean-reversion short.
• Swap BTC for miners, altcoins or high-beta equities to test who is the divergence leader.
Event-Driven Tactics
• FOMC days: plot the oscillator on an hourly chart (disable ‘Force Daily TF’). Watch for micro-structural spikes that resolve in the first hour after the statement; rapid flips across zero can front-run post-FOMC swings.
• CPI and NFP prints: extremes reached into the release often mean positioning is one-sided. A reversion toward neutral in the first 24 hours is common.
6. Alerts Suite
Pre-bundled conditions let you automate workflows:
• Bullish / Bearish zero crosses – queue spot or futures entries.
• Standard OB / OS – notify for first contact with actionable zones.
• Extreme OB / OS – prime time to review hedges, take profits or build contrarian swing positions.
7. Parameter Playground
• Shorten ROC Lookback to 14 for tactical traders; lengthen to 90 for macro investors.
• Raise extreme thresholds (for example ±80) when plotting on altcoins that exhibit higher volatility than BTC.
• Try HMA smoothing for responsive yet smooth curves on intraday charts.
• Colour-blind users can easily swap bull and bear palette selections for preferred contrasts.
8. Limitations and Best Practices
• The Fed Funds series is step-wise; it only changes on meeting days. Rapid BTC oscillations in between may dominate the calculation. Keep that perspective when interpreting very high-frequency signals.
• Divergence does not equal causation. Crypto-native catalysts (ETF approvals, hack headlines) can overwhelm macro links temporarily.
• Use in conjunction with classical confirmation tools—order-flow footprints, market-profile ledges, or simple price action to avoid “pure-indicator” traps.
9. Final Thoughts
The FEDFUNDS Rate Divergence Oscillator distills an entire macro narrative monetary policy versus risk sentiment into a single colourful heartbeat. It will not magically predict every pivot, yet it excels at framing market context, spotting stretches and timing regime changes. Treat it as a strategic compass rather than a tactical sniper scope, combine it with sound risk management and multi-factor confirmation, and you will possess a robust edge anchored in the world’s most influential interest-rate benchmark.
Trade consciously, stay adaptive, and let the policy-price tension guide your roadmap.

OB/OS adaptative v1.1# OB/OS Adaptative v1.1 - Multi-Timeframe Adaptive Overbought/Oversold Indicator
## Overview
The `tradingview_indicator_emas.pine` script is a sophisticated multi-timeframe indicator designed to identify dynamic overbought and oversold levels in financial markets. It combines EMA (Exponential Moving Average) crossovers and Bollinger Bands across monthly, weekly, and daily timeframes to create adaptive support and resistance levels that adjust to changing market conditions.
## Core Functionality
### Multi-Timeframe Analysis
The indicator analyzes three timeframes simultaneously:
- **Monthly (M)**: Long-term trend identification
- **Weekly (W)**: Intermediate-term trend identification
- **Daily (D)**: Short-term volatility measurement
### Technical Indicators Used
- **EMA 9 and EMA 20**: For trend identification and momentum assessment
- **Bollinger Bands (20-period)**: For volatility measurement and extreme level identification
- **Price action**: For confirmation of level validity and signal generation
## Key Features
### Adaptive Level Calculation
The indicator dynamically determines overbought and oversold levels based on market structure and trend bias:
#### Monthly Level Logic
- **Bullish Bias** (when monthly open > EMA20):
- Oversold = lower of EMA9 or EMA20
- Overbought = upper of EMA9 or Bollinger Upper Band
- **Bearish/Neutral Bias** (when monthly open ≤ EMA20):
- Oversold = Bollinger Lower Band
- Overbought = upper of EMA20 or EMA9
#### Weekly Level Logic
- **Bullish Bias** (when weekly open > EMA20):
- Oversold = lower of EMA9 or EMA20
- Overbought = Bollinger Upper Band
- **Bearish/Neutral Bias** (when weekly open ≤ EMA20):
- Oversold = Bollinger Lower Band
- Overbought = upper of EMA20 or EMA9
#### Daily Level Logic
- Simple Bollinger Bands:
- Oversold = Bollinger Lower Band
- Overbought = Bollinger Upper Band
### Final Level Determination
The indicator combines all three timeframes through a weighted averaging process:
1. Calculates initial values as the average of monthly, weekly, and daily levels
2. Ensures mathematical consistency by enforcing overbought_final ≥ oversold_final using min/max functions
3. Calculates a midpoint average level as the center of the range
### Visual Elements
- **Dynamic Lines**: Draws horizontal lines for current and previous period overbought, oversold, and average levels
- **Labels**: Places clear textual labels at the start of each period
- **Color Coding**:
- Red for overbought levels (resistance)
- Green for oversold levels (support)
- Blue for average levels (pivot point)
- **Transparency**: Previous period lines use semi-transparent colors to distinguish between current and historical levels
### Update Mechanism
- **Calculation Day**: User-defined day of the week (default: Monday)
- On the specified calculation day, the indicator:
- Updates all levels based on previous bar's data
- Draws new lines extending forward for a user-defined number of days
- Maintains previous period lines for comparison and trend analysis
- Automatically deletes and recreates lines to ensure clean visualization
### Proximity Detection
- Alerts when price approaches overbought/oversold levels (configurable distance in percentage)
- Helps identify potential reversal zones before actual crossovers occur
- Distance thresholds are user-configurable for both overbought and oversold conditions
### Alert Conditions
The indicator provides four distinct alert types:
1. **Cross below oversold**: Triggered when price crosses below the oversold level
2. **Cross above overbought**: Triggered when price crosses above the overbought level
3. **Near oversold**: Triggered when price approaches the oversold level within the configured distance
4. **Near overbought**: Triggered when price approaches the overbought level within the configured distance
### Debug Mode
When enabled, displays comprehensive debug information including:
- Current values for all levels (oversold, overbought, average)
- Timeframe-specific calculations and raw data points
- System status information (current day, calculation day, etc.)
- Lines existence and timing information
- Organized in multiple labels at different price levels to avoid overlap
## Configuration Parameters
| Parameter | Default Value | Description |
|---------|---------------|-------------|
| Short EMA (9) | 9 | Length for short-term EMA calculation |
| Long EMA (20) | 20 | Length for long-term EMA calculation |
| BB Length | 20 | Period for Bollinger Bands calculation |
| Std Dev | 2.0 | Standard deviation multiplier for Bollinger Bands |
| Distance to overbought (%) | 0.5 | Percentage threshold for "near overbought" alerts |
| Distance to oversold (%) | 0.5 | Percentage threshold for "near oversold" alerts |
| Calculation day | Monday | Day of week when levels are recalculated |
| Lookback days | 7 | Number of days to extend previous period lines backward |
| Forward days | 7 | Number of days to extend current period lines forward |
| Show Debug Labels | false | Toggle for comprehensive debug information display |
## Trading Applications
### Primary Use Cases
1. **Reversal Trading**: Identify potential reversal zones when price approaches overbought/oversold levels
2. **Trend Confirmation**: Use the adaptive nature of levels to confirm trend strength and direction
3. **Position Sizing**: Adjust position size based on distance from key levels
4. **Stop Placement**: Use opposite levels as dynamic stop-loss references
### Strategic Advantages
- **Adaptive Nature**: Levels adjust to changing market volatility and trend structure
- **Multi-Timeframe Confirmation**: Signals are validated across multiple timeframes
- **Visual Clarity**: Clear color-coded lines and labels enhance decision-making
- **Proactive Alerts**: "Near" conditions provide early warnings before crossovers
## Implementation Details
### Data Security
Uses `request.security()` function to fetch data from higher timeframes (monthly, weekly) while maintaining proper bar indexing with ` ` offset for open prices.
### Performance Optimization
- Uses `var` keyword to declare persistent variables that maintain state across bars
- Efficient line and label management with proper deletion before recreation
- Conditional execution of debug code to minimize performance impact
### Error Handling
- Comprehensive NA (not available) checks throughout the code
- Graceful degradation when data is unavailable for higher timeframes
- Mathematical safeguards to prevent invalid level calculations
## Conclusion
The OB/OS Adaptative v1.1 indicator represents a sophisticated approach to identifying market extremes by combining multiple technical analysis concepts. Its adaptive nature makes it particularly useful in trending markets where static levels may be less effective. The multi-timeframe approach provides a comprehensive view of market structure, while the visual elements and alert system enhance its practical utility for active traders.

Overheat Oscillator with DivergenceIndicator Description
The Overheat Oscillator with Divergence is an advanced technical indicator designed for the TradingView platform, assisting traders in identifying potential market reversal points by analyzing price momentum and volume, as well as detecting divergences. The indicator combines trend strength assessment with signal smoothing to provide clear indications of market overheat or oversold conditions. An optional divergence detection feature allows for the identification of discrepancies between price movement and the oscillator's value, which may signal upcoming trend changes.
The indicator is displayed in a separate panel below the price chart and offers visual cues through a color gradient, horizontal reference lines, and a dynamic market sentiment table. Users can customize numerous parameters, such as calculation periods, sentiment thresholds, line colors, and visualization styles, making the indicator a versatile tool for various trading strategies.
How the Indicator Works
The indicator is based on the following key components:
Oscillator Calculations
The indicator analyzes price candles, assigning a score based on their nature. A bullish candle (when the closing price is higher than the opening price) receives a score of +1.0, while a bearish candle (when the closing price is lower than the opening price) receives a score of -1.0. This scoring reflects the strength of price movement over a given period.
The score is modified by a volume multiplier (default: 2.0) if the candle's volume exceeds the volume's simple moving average (SMA, default: calculated over 20 candles). This ensures that candles with higher volume have a greater impact on the oscillator's value, better capturing significant market movements driven by increased trading activity. For example, a bullish candle with high volume may receive a score of +2.0 instead of +1.0, amplifying the bullish signal.
The scores are summed over a specified number of candles (default: 20), normalized to a 0–100 range, and then smoothed using a simple moving average (SMA, default: 5 periods) to reduce noise and improve signal clarity.
Color Gradient
The oscillator's values are visualized using a color gradient that changes based on the oscillator's level:
Green: Market cooldown (values below the Gradient Min threshold).
Yellow: Neutral sentiment (values between Gradient Min and Gradient Yellow).
Orange: Elevated activity (values between Gradient Yellow and Gradient Orange).
Red: Market overheat (values above Gradient Orange).
The color gradient is applied as the background in the oscillator panel, facilitating quick assessment of market sentiment.
Reference Levels
The indicator displays customizable horizontal lines for key thresholds (e.g., Overheat Threshold, Oversold Threshold, Gradient Min, Yellow, Orange, Max). These lines are visible only at the height of the last few oscillator candles, preventing chart clutter and helping users focus on current values.
Users can also define three custom horizontal lines with selectable styles (solid, dotted, dashed) and colors. These lines serve as auxiliary tools, e.g., for marking personal support/resistance levels, but do not affect the oscillator's signals or background colors.
Market Sentiment
The indicator displays sentiment labels in a table located in the top-right corner of the panel, dynamically updating based on the oscillator's value:
Cooled: Values below Gradient Yellow (default: 35).
Neutral: Values between Gradient Yellow and Gradient Orange (default: 60).
Excited: Values between Gradient Orange and Overheat Threshold (default: 70).
Overheated: Values above Overheat Threshold (default: 70).
The Overheat Threshold and Oversold Threshold are critical for displaying the "Overheated" and "Cooled" labels in the sentiment table, enabling users to quickly identify extreme market conditions. The labels update when key thresholds are crossed, and their colors match the oscillator's gradient.
Divergence Detection
The indicator offers optional detection of regular bullish and bearish divergences:
Bullish Divergence: Occurs when the price forms a lower low, but the oscillator forms a higher low, suggesting a weakening downtrend.
Bearish Divergence: Occurs when the price forms a higher high, but the oscillator forms a lower high, suggesting a weakening uptrend.
Divergences are marked on the chart with labels ("Bull" for bullish, "Bear" for bearish) and lines indicating pivot points. They are calculated with a delay equal to the Lookback Right setting (default: 5 candles), meaning signals appear after pivot confirmation in the specified lookback period. The indicator also generates alerts for users when a divergence is detected.
Indicator Settings
Main Settings (SETTINGS)
Period Length: Specifies the number of candles used for oscillator calculations (default: 20).
Volume SMA Period: The period for the volume's simple moving average (default: 20).
Volume Multiplier: Multiplier applied to candle scores when volume exceeds the average (default: 2.0).
SMA Length: The period for smoothing the oscillator with a simple moving average (default: 5).
Thresholds (THRESHOLDS)
Overheat Threshold: Level indicating market overheat (default: 70). This value determines when the sentiment table displays the "Overheated" label, signaling a potential peak in an uptrend.
Oversold Threshold: Level indicating market cooldown (default: 30). This value determines when the sentiment table displays the "Cooled" label, signaling a potential bottom in a downtrend.
Gradient Min (Green): Lower threshold for the green gradient (default: 20).
Gradient Yellow Threshold: Threshold for the yellow gradient (default: 35).
Gradient Orange Threshold: Threshold for the orange gradient (default: 60).
Gradient Max (Red): Upper threshold for the red gradient (default: 70).
Visualization (VISUALIZATION)
Signal Line Color: Color of the oscillator line (default: dark red, RGB(5, 0, 0)).
Show Reference Lines: Enables/disables the display of threshold lines (default: enabled).
Divergence Settings (DIVERGENCE SETTINGS)
Calculate Divergence: Enables/disables divergence detection (default: disabled).
Lookback Right: Number of candles back for pivot analysis (default: 5).
Lookback Left: Number of candles to the left for pivot analysis (default: 5).
Line Style (STYLE)
Custom Line 1, 2, 3 Value: Levels for custom horizontal lines (default: 70, 50, 30).
Custom Line 1, 2, 3 Color: Colors for custom lines (default: black, RGB(0, 0, 0)).
Custom Line 1, 2, 3 Style: Line styles (solid, dotted, dashed; default: dashed, dotted, dashed).
How to Use the Indicator
Adding to the Chart
Add the indicator to your TradingView chart by searching for "Overheat Oscillator with Divergence."
Configure the settings according to your trading strategy.
Signal Interpretation
Overheated: Values above the Overheat Threshold (default: 70) in the sentiment table may indicate a potential uptrend peak.
Cooled: Values below the Oversold Threshold (default: 30) in the sentiment table may suggest a potential downtrend bottom.
Divergences:
Bullish: Look for "Bull" labels on the chart, indicating potential upward reversals (calculated with a Lookback Right delay).
Bearish: Look for "Bear" labels, indicating potential downward reversals (calculated with a Lookback Right delay).
Customization
Experiment with settings such as period length, volume multiplier, or gradient thresholds to tailor the indicator to your trading style (e.g., scalping, medium-term trading).
Usage Examples
Scalping: Set a shorter period (e.g., Period Length = 10, SMA Length = 3) and monitor rapid sentiment changes and divergences on lower timeframes (e.g., 5-minute charts).
Medium-Term Trading: Use default settings or increase Period Length (e.g., 30) and SMA Length (e.g., 7) for more stable signals on hourly or daily charts.
Reversal Detection: Enable divergence detection and observe "Bull" or "Bear" labels in conjunction with overheat/cooled levels in the sentiment table.
Notes
The indicator performs best when used in conjunction with other technical analysis tools, such as support/resistance lines, moving averages, or Fibonacci levels.
Divergences may serve as early signals but do not always guarantee immediate trend reversals—confirmation with other indicators is recommended.
Test different settings on historical data to find the optimal configuration for your chosen market and timeframe.

Canuck Trading Projection IndicatorCanuck Trading Projection Indicator
Overview
The Canuck Trading Projection Indicator is a powerful PineScript v6 tool designed for TradingView to project potential bullish and bearish price trajectories based on historical price and volume movements. It provides traders with actionable insights by estimating future price targets and assigning confidence levels to each outlook, helping to identify probable market directions across any timeframe. Ideal for both short-term and long-term traders, this indicator combines momentum analysis, RSI filtering, support/resistance detection, and time-weighted trend analysis to deliver robust projections.
Features
Bullish and Bearish Projections: Forecasts price targets for upward (bullish) and downward (bearish) movements over a user-defined projection period (default 20 bars).
Confidence Levels: Assigns percentage confidence scores to each outlook, reflecting the likelihood of the projected price based on historical trends, volatility, and volume.
RSI Filter: Incorporates a 14-period Relative Strength Index (RSI) to validate trends, requiring RSI > 50 for bullish and RSI < 50 for bearish signals.
Support/Resistance Detection: Adjusts confidence levels when projections are near key swing highs/lows (within 2% of average price), boosting confidence by 5% for alignments.
Time-Based Weighting: Prioritizes recent price movements in trend analysis, giving more weight to newer bars for improved relevance.
Customizable Inputs: Allows users to tailor lookback period, projection bars, RSI period, confidence threshold, colors, and label positioning.
Forced Label Spacing: Prevents overlap of bullish and bearish text labels, even for tight projections, using fixed vertical slots when price differences are small (<2% of average price).
Timeframe Flexibility: Works seamlessly across all TradingView timeframes (e.g., 30-minute, hourly, daily, weekly, monthly), adapting projections to the chart’s resolution.
Clean Visualization: Displays projections as green (bullish) and red (bearish) dashed lines, with non-overlapping text labels at the projection endpoints showing price targets and confidence levels.
How It Works
The indicator analyzes historical price and volume data over a user-defined lookback period (default 50 bars) to calculate:
Momentum: Combines price changes and volume to assess trend strength, using a weighted moving average (WMA) for directional bias.
Trend Analysis: Counts bullish (price up, volume above average, RSI > 50) and bearish (price down, volume above average, RSI < 50) trends, weighting recent bars more heavily.
Projections:
Bullish Slope: Positive or flat when momentum is upward, scaled by price change and momentum intensity.
Bearish Slope: Negative or flat when momentum is downward, amplified by bearish confidence for stronger projections.
Projects prices forward by 20 bars (default) using current close plus slope times projection bars.
Confidence Levels:
Base confidence derived from the proportion of bullish/bearish trends, with a 5% minimum to avoid zero confidence.
Adjusted by volatility (lower volatility increases confidence), volume trends, and proximity to support/resistance levels.
Visualization:
Draws projection lines from the current close to the 20-bar future target.
Places text labels at line endpoints, showing price targets and confidence percentages, with forced spacing for readability.
Input Parameters
Lookback Period (default: 50): Number of bars for historical analysis (minimum 10).
Projection Bars (default: 20): Number of bars to project forward (minimum 5).
Confidence Threshold (default: 0.6): Minimum confidence for strong trend indication (0.1 to 1.0).
Bullish Projection Line Color (default: Green): Color for bullish projection line and label.
Bearish Projection Line Color (default: Red): Color for bearish projection line and label.
RSI Period (default: 14): Period for RSI momentum filter (minimum 5).
Label Vertical Offset (%) (default: 1.0): Base offset for labels as a percentage of price range (0.1% to 5.0%).
Minimum Label Spacing (%) (default: 2.0): Minimum vertical spacing between labels for tight projections (0.5% to 10.0%).
Usage Instructions
Add to Chart: Copy the script into TradingView’s Pine Editor, save, and add the indicator to your chart.
Select Timeframe: Apply to any timeframe (e.g., 30-minute, hourly, daily, weekly, monthly) to match your trading strategy.
Interpret Outputs:
Green Line/Label: Bullish price target and confidence (e.g., "Bullish: 414.37, Confidence: 35%").
Red Line/Label: Bearish price target and confidence (e.g., "Bearish: 279.08, Confidence: 41.3%").
Higher confidence indicates a stronger likelihood of the projected outcome.
Adjust Inputs:
Modify Lookback Period to focus on shorter/longer historical trends (e.g., 20 for short-term, 100 for long-term).
Change Projection Bars to adjust forecast horizon (e.g., 10 for shorter, 50 for longer).
Tweak RSI Period or Confidence Threshold for sensitivity to momentum or trend strength.
Customize Colors for visual preference.
Increase Minimum Label Spacing if labels overlap in volatile markets.
Combine with Analysis: Use alongside other indicators (e.g., moving averages, Bollinger Bands) or fundamental analysis to confirm signals, as projections are probabilistic.
Example: TSLA Across Timeframes
Using live TSLA data (close ~346.46 USD, May 31, 2025), the indicator produces:
30-Minute: Bullish 341.93 (13.3%), Bearish 327.96 (86.7%) – Strong bearish sentiment due to intraday volatility.
1-Hour: Bullish 342.00 (33.9%), Bearish 327.50 (62.3%) – Bearish but less intense, reflecting hourly swings.
4-Hour: Bullish 345.52 (73.4%), Bearish 344.44 (19.0%) – Flat outlook, indicating consolidation.
Daily: Bullish 391.26 (68.8%), Bearish 302.22 (31.2%) – Bullish bias from recent uptrend, bearish tempered by longer lookback.
Weekly: Bullish 414.37 (35.0%), Bearish 279.08 (41.3%) – Wide range, reflecting annual volatility.
Monthly: Bullish 396.70 (54.9%), Bearish 296.93 (10.2%) – Long-term bullish optimism.
These results align with market dynamics: short-term intervals capture volatility, while longer intervals smooth trends, providing balanced outlooks.
Notes
Accuracy: Projections are estimates based on historical data and should be used with other analysis tools. Confidence levels indicate likelihood, not certainty.
Timeframe Sensitivity: Short-term intervals (e.g., 30-minute) show larger price swings and higher confidence due to volatility, while longer intervals (e.g., monthly) are more stable.
Customization: Adjust inputs to match your trading style (e.g., shorter lookback for day trading, longer for swing trading).
Performance: Tested on volatile stocks like TSLA, NVIDIA, and others, ensuring robust performance across markets.
Limitations: May produce conservative bearish projections in strong uptrends due to momentum weighting. Adjust lookback or projection_bars for sensitivity.
Feedback
If you encounter issues (e.g., label overlap, projection mismatches), please share your timeframe, settings, or a screenshot. Suggestions for enhancements (e.g., additional filters, visual tweaks) are welcome!
Disclaimer
The Canuck Trading Projection Indicator is provided for educational and informational purposes only. It is not financial advice. Trading involves significant risks, and past performance is not indicative of future results. Always perform your own due diligence and consult a qualified financial advisor before making trading decisions.

Supertrend with Volume Filter AlertSupertrend with Volume Filter Alert - Indicator Overview
What is the Supertrend Indicator?
The Supertrend indicator is a popular trend-following tool used by traders to identify the direction of the market and potential entry/exit points. It is based on the Average True Range (ATR), which measures volatility, and plots a line on the chart that acts as a dynamic support or resistance level. When the price is above the Supertrend line, it signals an uptrend (bullish), and when the price is below, it indicates a downtrend (bearish). The indicator is particularly effective in trending markets but can generate false signals during choppy or sideways conditions.
How This Script Works
The "Supertrend with Volume Filter Alert" enhances the classic Supertrend indicator by adding a customizable volume filter to improve signal reliability.
Here's how it functions:
Supertrend Calculation:The Supertrend is calculated using the ATR over a user-defined period (default: 55) and a multiplier (default: 1.85). These parameters control the sensitivity of the indicator:A higher ATR period smooths out volatility, making the indicator less reactive to short-term price fluctuations.The multiplier determines the distance of the Supertrend line from the price, affecting how quickly it responds to trend changes.The script plots the Supertrend line in cyan for uptrends and red for downtrends, making it easy to visualize the market direction.
Volume Filter:A key feature of this script is the volume filter, which helps filter out false signals in choppy markets. The filter compares the current volume to the average volume over a lookback period (default: 20) and only triggers signals if the volume exceeds the average by a specified multiplier (default: 2.0).This ensures that trend changes are accompanied by significant market participation, increasing the likelihood of a genuine trend shift.
Signals and Alerts:
Buy signals (cyan triangle below the bar) are generated when the price crosses above the Supertrend line (indicating an uptrend) and the volume condition is met.Sell signals (red triangle above the bar) are generated when the price crosses below the Supertrend line (indicating a downtrend) and the volume condition is met.Alerts are set up for both buy and sell signals, notifying traders only when the volume filter confirms the trend change.
Customizable Settings for Multiple Markets
The default settings in this script (ATR Period: 55, ATR Multiplier: 1.85, Volume Lookback Period: 20, Volume Multiplier: 2.0) were carefully chosen to provide a balance of sensitivity and reliability across various markets, including stocks, indices (like the S&P 500), forex, and cryptocurrencies.
Here's why these settings work well:
ATR Period (55): A longer ATR period smooths out volatility, making the indicator less prone to whipsaws in volatile markets like crypto or forex, while still being responsive enough for trending markets like indices.
ATR Multiplier (1.85): This multiplier strikes a balance between capturing early trend changes and avoiding noise. A smaller multiplier would make the indicator too sensitive, while a larger one might miss early opportunities.
Volume Lookback Period (20): A 20-bar lookback for volume averaging provides a robust baseline for identifying significant volume spikes, adaptable to both short-term (e.g., daily charts) and longer-term (e.g., weekly charts) timeframes.
Volume Multiplier (2.0): Requiring volume to be at least 2x the average ensures that only high-conviction moves trigger signals, which is crucial for markets with varying liquidity levels.
These parameters are fully customizable, allowing traders to adjust the indicator to their specific market, timeframe, or trading style. For example, you might reduce the ATR period for faster-moving markets or increase the volume multiplier for more conservative signal filtering.
How the Volume Filter Reduces Bad Trades in Choppy Markets
One of the main drawbacks of the Supertrend indicator is its tendency to generate false signals during choppy or ranging markets, where price fluctuates without a clear trend. The volume filter in this script addresses this issue by ensuring that trend changes are backed by significant market activity:
In choppy markets, price movements often lack strong volume, leading to false breakouts or reversals. By requiring volume to be a multiple (default: 2x) of the average volume over the lookback period, the script filters out these low-volume, low-conviction moves.This reduces the likelihood of taking bad trades during sideways markets, as only trend changes with strong volume confirmation will trigger signals. For example, on a daily chart of the S&P 500, a buy signal will only fire if the price crosses above the Supertrend line and the volume on that day is at least twice the 20-day average, indicating genuine buying pressure.
Usage Tips
Markets and Timeframes: This indicator is versatile and can be used on various assets (stocks, indices, forex, crypto) and timeframes (1-minute, 1-hour, daily, etc.). Adjust the settings based on the market's volatility and your trading strategy.
Combine with Other Indicators: While the volume filter improves reliability, consider using additional indicators like RSI or MACD to confirm trends, especially in ranging markets.
Backtesting: Test the indicator on historical data for your chosen market to optimize the settings and ensure they align with your trading goals.
Alerts: Set up alerts for buy and sell signals to stay informed of high-probability trend changes without constantly monitoring the chart.
ConclusionThe "Supertrend with Volume Filter Alert" is a powerful tool for trend-following traders, combining the simplicity of the Supertrend indicator with a volume-based filter to enhance signal accuracy. Its customizable settings make it adaptable to multiple markets, while the volume filter helps reduce false signals in choppy conditions, allowing traders to focus on high-probability trades. Whether you're trading stocks, indices, forex, or crypto, this indicator can help you identify trends with greater confidence.
