Rounded Forex Levels: Big-Figure, Mid-Figure, 80-20 levels, BFRNSimple indicator to show Rounded levels in typical Forex pairs: Big figure, Mid-figure, 80-20 Insitutional Levels, 10pip levels, 5pip levels
Wrote this indicator because other ones out there seem to clutter the chart. This is simple, low-clutter and can be set by user to have arbitrary start and end points for the lines.
I wanted the ability for lines to plot discreetly to the right hand side of price as in the chart above, since in my opinion, these are only of secondary consideration to a trader, an extra confirmation/confluence to an existing idea.
//Purpose & Usage:
-Big-figure levels (100pips) & Mid-figure levels (50pips) will have a senstitivity to price, that can be an additional tool when looking for confluence for a target or an entry.
-As well as BF levels and MF levels; Institutional levels (20pips below and 20 pips above a Big Figure level) and standard 10pip or 5pip levels, can be useful in the right context (i.e added confirmation that of a minor sweep target; added conviction in an idea if the level aligns with another seperately derived level).
//User inputs:
-Toggle on/off each of the types of level.
-Line spacing: choose pip spacing of lines .
-Number of lines above/below (i.e. setting of 5 will be 11 lines. One central, 5 above, 5 below).
-Formatting: for each class of lines, code by color, style and width (as per the example chart below).
-Line start offset and line end offset: bars forward/back for each of start point and end point. So lines could be spread right across chart; or neatly pushed to the far right or left of the chart.
//Notes:
-Designed for typical Forex pairs with units close to 1.0 (like Eur/Usd, Usd/Cad, Aud/Usd, Gbp/Usd, Eur/Gbp, Nzd/Usd).
-Lines are based from the rounded close of the previous bar, Updating (if applicable) on each new bar.
Demo Plotting levels in the past; Dialog box example display:
Cari dalam skrip untuk "20蒙古币兑换人民币"

Breakout in 20 daysbreakout condition
1. current close price must be higher than all close prices in 20 days
2. close prices change in 20 days must be less than 20%
3. current volume must be greater than previous volume by 10%
ブレイクアウト条件
1. 最新の終値が直近20日のすべての終値より高い
2. 直近X日の終値の変動率が20%以下
3. 最新の出来高が前日の出来高より10%大きい

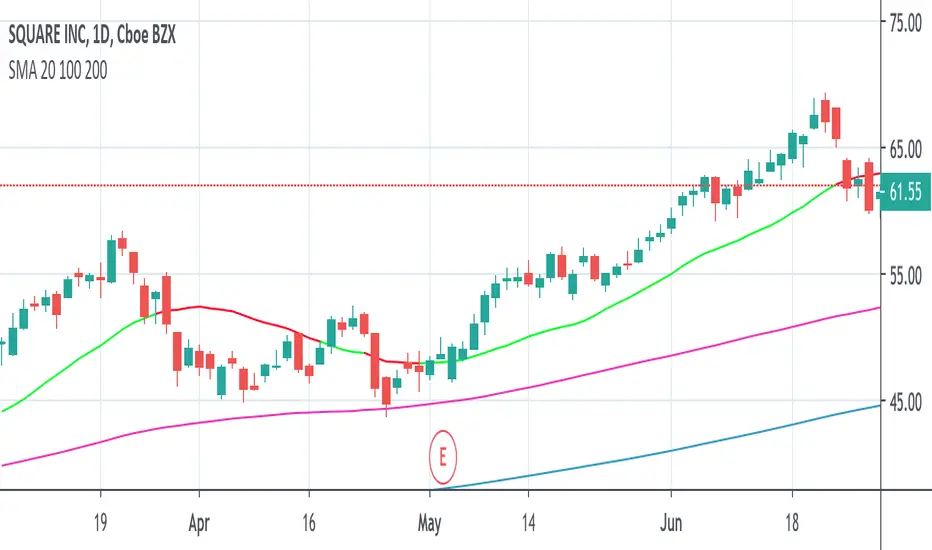
Simple Moving Average 20,50,100This SMA Script is modified and is based on 3 bands which are of 20 days, 50 days, 100 days average line.
This is a very appropriate for Indian Markets.
**How to Use :**
***BUY***
When the chart pattern is as follows :-
- SMA 200 (Black)
- SMA 50 (Red)
- SMA 20 (Green)
- "Last Traded Price"
***SELL***
When the chart pattern is as follows :-
- "Last Traded Price"
- SMA 20 (Green)
- SMA 50 (Red)
- SMA 200 (Black)
And Book Good Profits!!!

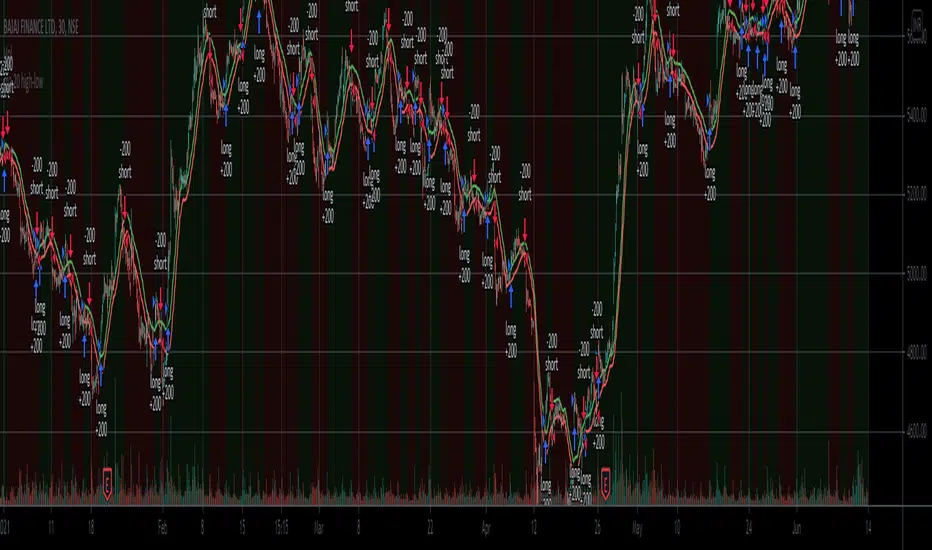
ma 20 high-lowThis is a simple 20-period high and low SMA strategy. We buy the stock when it closes above the 20 period SMA of high prices and sell when it closes below it. We sell when the price closes below 20 period SMA of low prices. This strategy works phenomenally well for a few stocks examples are bajaj finance and bajaj finserv. I want to see if it makes a good return in future. It works well for 30 mins and a daily time frame.
SMA price-based 20 SMA 100 SMA 200Three Simple Moving Averages to detect changes in short time frame direction as well longer time frame swing movements.
sma 20 based on price - Two colors. Green if closing price is above the 20 sma. Red if closing price is below 20 sma.
sma 100
sma 200
SMA 20, 50, 200This Script provides the 50 and 200 day moving average to provide a way to keep track of the classic Death Cross and Golden Cross. The 20 day moving average is just used as an early prediction of what the 50 day may do so you can keep and eye on it. If you are the kind of person that freaks out at sudden changes in the graphs it is probably best to just turn the 20 day off.
A Golden Cross is when the 50 day MA raises above the 200 day MA. This indicates the start of a Bull Market. This is the best time to buy as the market commonly will increase over the next few months or even years.
A Death Cross is when the 50 day MA drops below the 200 day MA. This indicates the start of a Bear Market. This is the best time to sell as the market will commonly decrease at least 20 percent or more over the next couple months or more.
I am not a financial advisor and this is just a tool to help you make your own decisions with your investments. My information is just based on common knowledge.

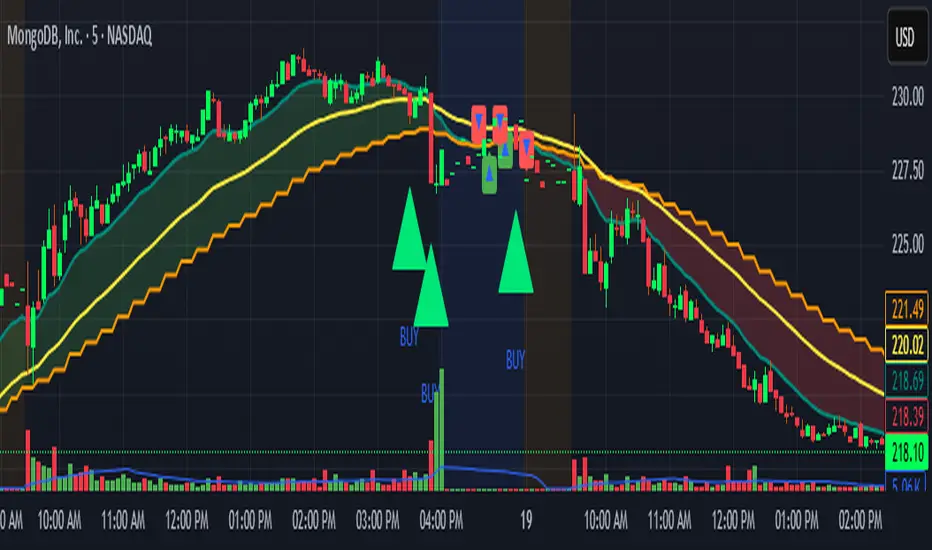
Locked 5m 13 EMA & 15m 20 EMA with Mid EMA & SignalsThis indicator overlays the 5-minute 13 EMA and the 15-minute 20 EMA on any chart timeframe up to 15 minutes, along with a mid EMA (5-minute 36-period) for reference.
Features include:
EMA Cross Detection: Shows bullish and bearish cross arrows when the 5m 13 EMA crosses the 15m 20 EMA.
EMA Fill: Highlights the area between the EMAs in green (bullish) or red (bearish).
Mid EMA Buy/Sell Signals: Generates buy signals when price touches the mid EMA in a bullish stack and sell signals in a bearish stack.
Custom Alerts: Alerts for EMA crosses, EMA stack direction, and mid EMA buy/sell triggers.
Timeframe Safety Warning: Alerts if applied on timeframes higher than 15 minutes.
Ideal For:
Traders who want a locked, non-repainting EMA setup for multi-timeframe analysis and clear entry/exit signals based on mid-range EMA interaction.
Inputs:
Show/Hide arrows for EMA crosses
Show/Hide fill between EMAs
Show/Hide mid EMA line
Show/Hide buy/sell signals
Fill transparency adjustment
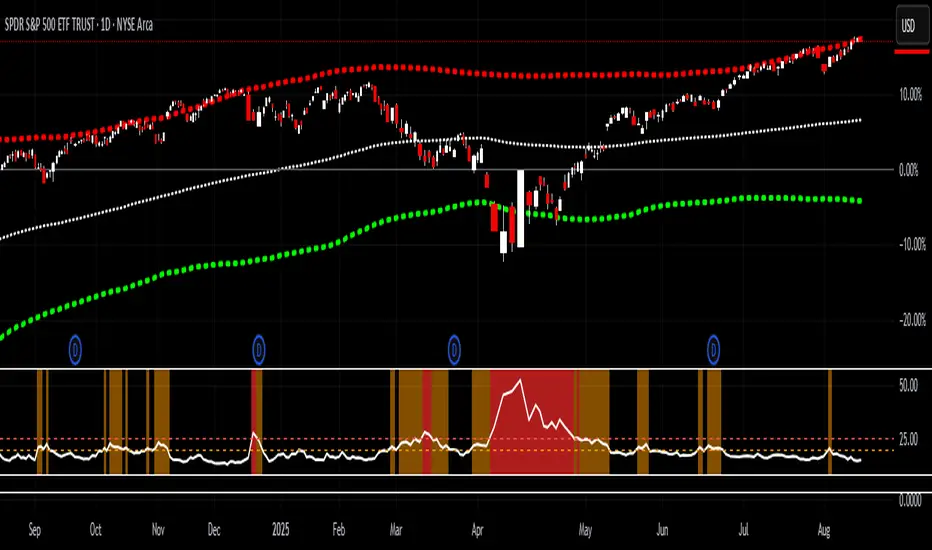
VIX > 20/25 HighlightThis indicator tracks the CBOE Volatility Index (VIX) and highlights when volatility exceeds critical thresholds.
Plots the VIX with dashed reference lines at 20 and 25.
Background turns orange when the VIX is above 20.
Background turns bright red when the VIX is above 25.
Includes alert conditions to notify you when the VIX crosses above 20 or 25.
Use this tool to quickly visualize periods of elevated market stress and manage risk accordingly.
Multi EMA (9, 20, 50, 100) Individual EMA Controls:
Show EMA 9 - Toggle checkbox to turn EMA 9 on/off
Show EMA 20 - Toggle checkbox to turn EMA 20 on/off
Show EMA 50 - Toggle checkbox to turn EMA 50 on/off
Show EMA 100 - Toggle checkbox to turn EMA 100 on/off
📋 Organized Settings:
EMA Display group - Contains all the on/off toggle switches
EMA Settings group - Contains period lengths and source settings
🔔 Smart Alerts:
Alerts only trigger when both EMAs involved in the crossover are enabled
Added EMA 50/100 crossover alerts

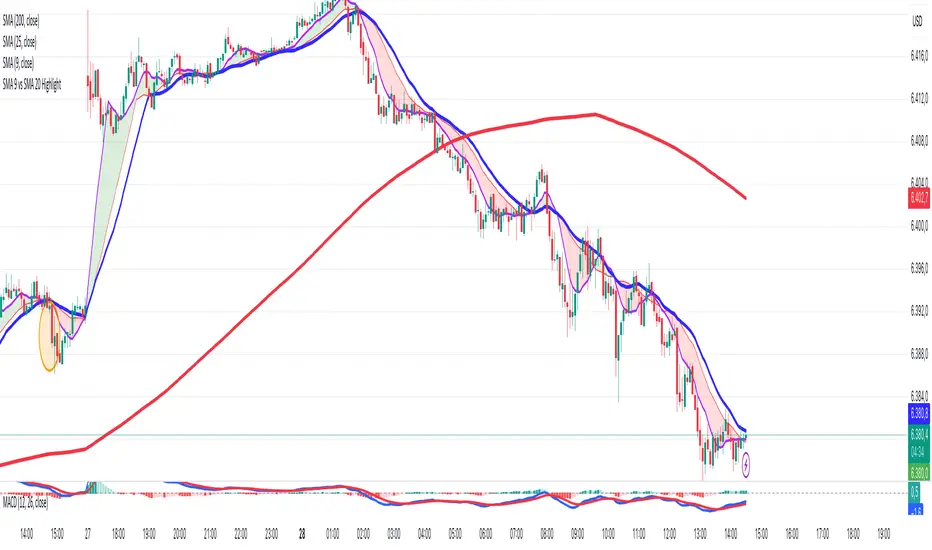
SMA 9 vs SMA 20 Highlight CrossoverHighlight in green the area in between the two SMA do that when the SMA cross above the SMA 20 periods the area is colored in green and when the SMA cross below the SMA 20 periods the area is colored in red
Hourly Markers 09:00 - 20:00 Adjusted for UTC+2A line for every hour from 0900 to 2200
Description:
This TradingView Pine Script plots small red markers (downward arrows) at the top of the chart for every full hour between 09:00 AM and 08:00 PM (20:00) based on UTC+2 time. The markers appear precisely at the opening minute of each hour within the defined range, helping traders visually track key time intervals during the day.
Features:
✔ Displays markers from 09:00 to 20:00 local time (UTC+2 adjustment)
✔ Only plots markers at the first minute of each hour
✔ Uses clear, unobtrusive triangle-down symbols above the bars
✔ Works on any chart timeframe that captures hourly intervals
Use Case:
Ideal for traders who want a quick visual reference of hourly intervals during the main trading hours, especially when working with charts set to UTC or different time zones.

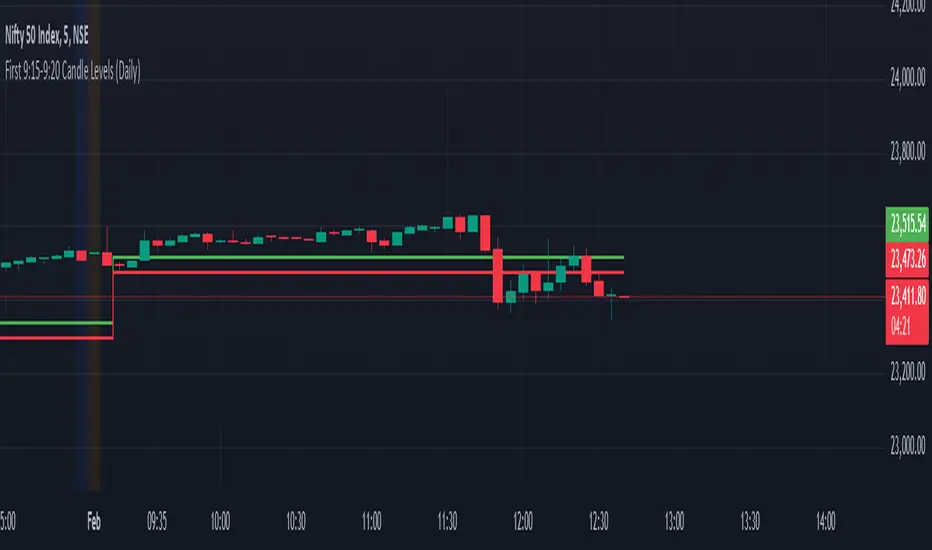
First 9:15-9:20 Candle Levels (Daily)This indicator captures the closing price of the first 5-minute candle (9:15 - 9:20 AM) every trading day. It then calculates 0.09% above and below this closing price and plots horizontal lines. The indicator resets daily at 9:15 AM, ensuring it always tracks the latest market open. After 9:20 AM, the calculated levels remain visible throughout the day. The upper level is displayed in green, while the lower level is in red. This tool helps traders identify key price levels early in the session, useful for setting stop-losses, take-profit zones, or identifying potential breakout points.
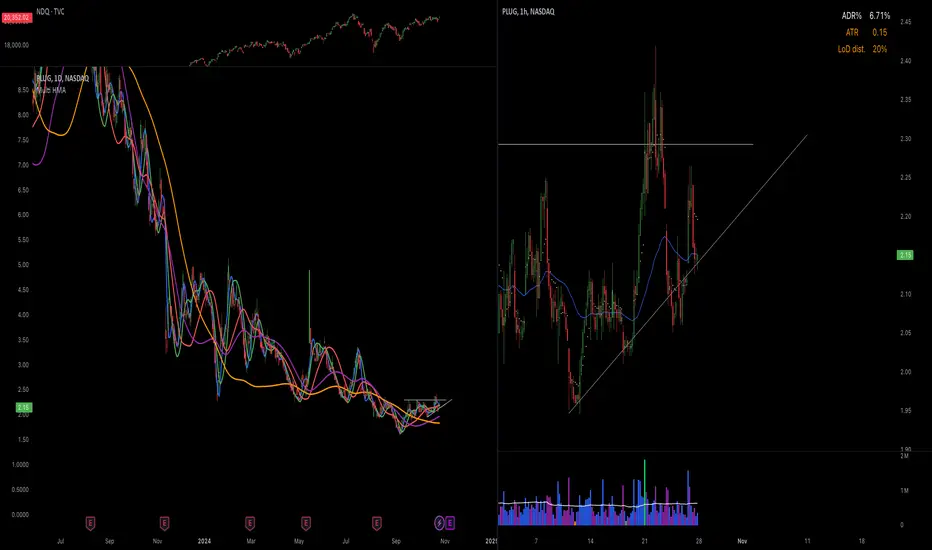
Hull Moving Averages 10, 20, 50, 100, 200This script generates multiple Hull Moving Averages (HMAs) on a trading chart, allowing for comprehensive trend analysis across different timeframes. Five HMAs with lengths of 10, 20, 50, 100, and 200 periods are plotted on the chart, providing insights into short, medium, and long-term market trends.
Each HMA can be customized with individual colors to easily distinguish between the different timeframes, helping traders visually track momentum changes and trend strength across these intervals. The Hull Moving Average is known for reducing lag compared to other moving averages, which makes it particularly useful for identifying turning points more accurately.
With this script:
You can adjust the colors of each HMA line individually, ensuring optimal visual differentiation.
You can analyze short-term trends with HMA 10 and HMA 20, medium-term trends with HMA 50, and long-term trends with HMA 100 and HMA 200.
The chart provides an at-a-glance view of multi-timeframe trends, making it useful for trading strategies that rely on crossovers or divergence patterns.
This tool is ideal for traders who want to identify trend direction, strength, and possible reversal points with minimal lag.
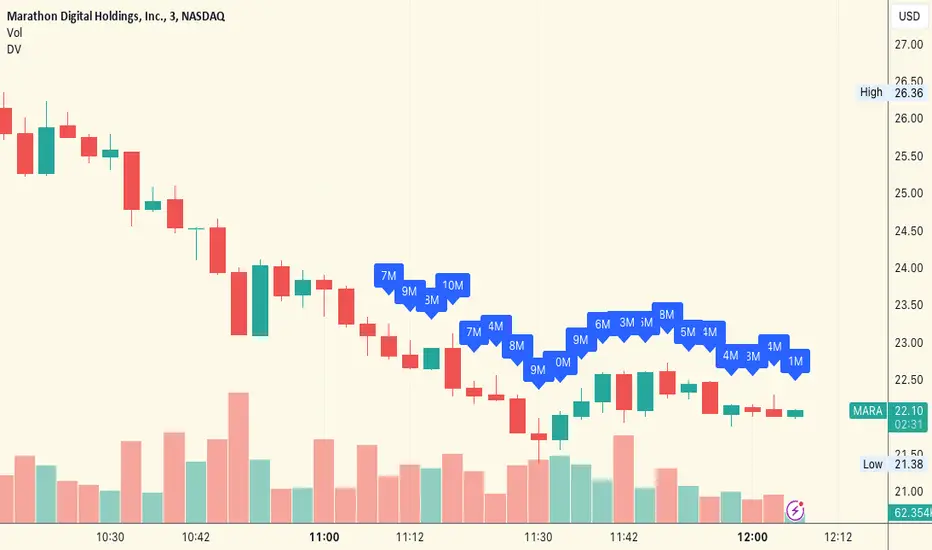
Dollar Volume Last 20 CandlesThe "Dollar Volume Last 20 Candles" indicator, abbreviated as "DV", is a practical and insightful tool for traders and analysts.
This indicator focuses on enhancing the visualization of trading data by calculating and displaying the dollar volume for each of the last 20 bars on a financial chart. It achieves this by multiplying the closing price of each bar with its trading volume, providing a clear dollar value of the trading activity.
The script also features an intuitive formatting system that simplifies large numbers into 'k' (thousands) and 'M' (millions), making the data easily digestible.
The dollar volume data is displayed directly above each bar, adjusted for visibility using the Average True Range (ATR), ensuring that it is both unobtrusive and readily accessible. This overlay feature integrates seamlessly with the existing chart, offering traders a quick and efficient way to assess monetary trading volume at a glance, which is particularly useful for identifying trends and market strength.
Volume with EMA 20 and 2 BB SALEM_ALSALEM1The highest candle amounts in trading volume exceed
average 20
Bollinger Band 1-15
Bollinger Band 20-2
Identified in dark blue

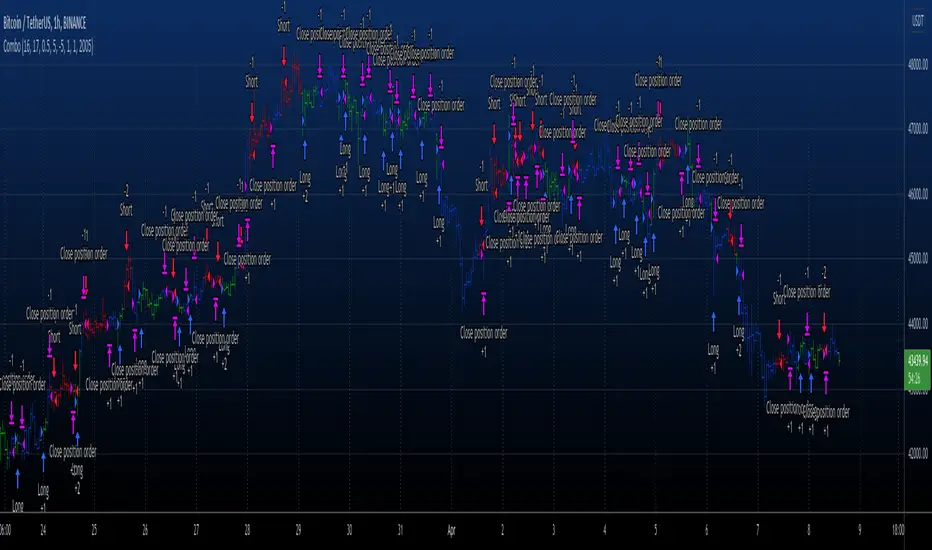
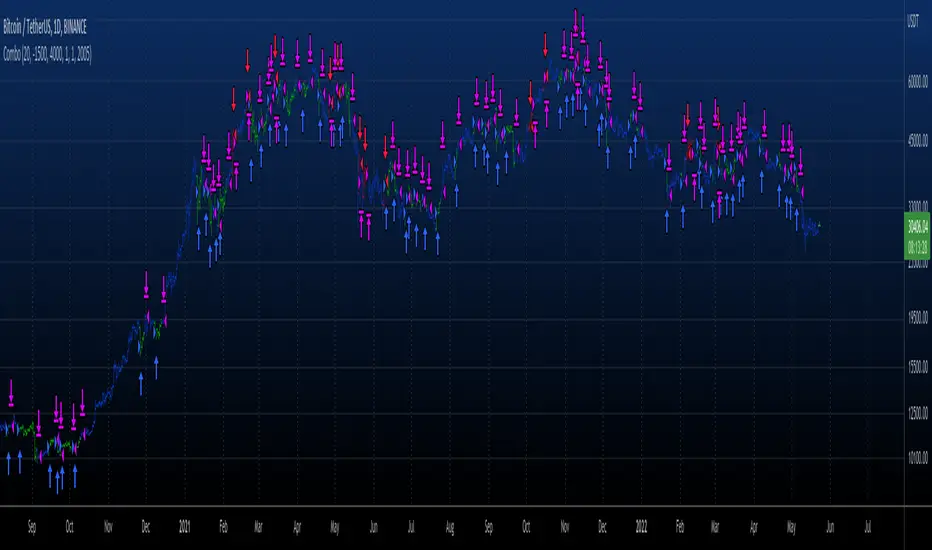
Combo 2/20 EMA & Bull PowerThis is combo strategies for get a cumulative signal.
First strategy
This indicator plots 2/20 exponential moving average. For the Mov
Avg X 2/20 Indicator, the EMA bar will be painted when the Alert criteria is met.
Second strategy
Bull Power Indicator
To get more information please see "Bull And Bear Balance Indicator"
by Vadim Gimelfarb.
WARNING:
- For purpose educate only
- This script to change bars colors.

Combo 2/20 EMA & Bull And Bear Balance This is combo strategies for get a cumulative signal.
First strategy
This indicator plots 2/20 exponential moving average. For the Mov
Avg X 2/20 Indicator, the EMA bar will be painted when the Alert criteria is met.
Second strategy
This new indicator analyzes the balance between bullish and
bearish sentiment.
One can cay that it is an improved analogue of Elder Ray indicator.
To get more information please see "Bull And Bear Balance Indicator"
by Vadim Gimelfarb.
WARNING:
- For purpose educate only
- This script to change bars colors.
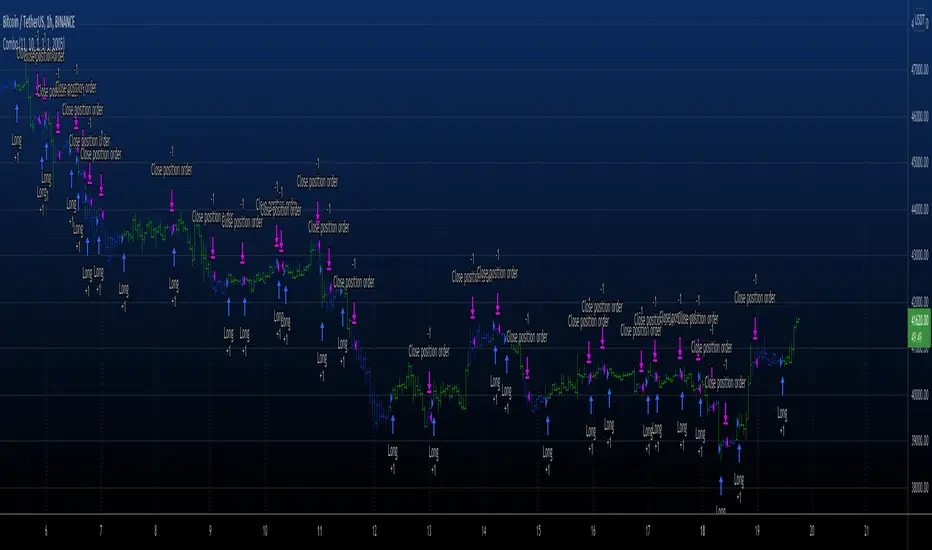
Combo 2/20 EMA & Bill Awesome Oscillator (AC) This is combo strategies for get a cumulative signal.
First strategy
This indicator plots 2/20 exponential moving average. For the Mov
Avg X 2/20 Indicator, the EMA bar will be painted when the Alert criteria is met.
Second strategy
This indicator plots the oscillator as a histogram where blue denotes
periods suited for buying and red . for selling. If the current value
of AO (Awesome Oscillator) is above previous, the period is considered
suited for buying and the period is marked blue. If the AO value is not
above previous, the period is considered suited for selling and the
indicator marks it as red.
WARNING:
- For purpose educate only
- This script to change bars colors.

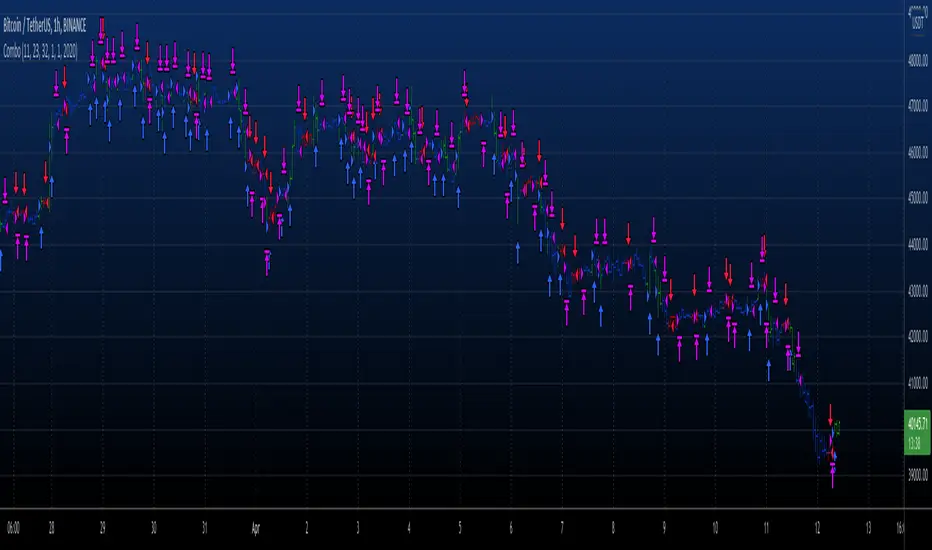
Combo 2/20 EMA & Bill Williams Averages. 3Lines This is combo strategies for get a cumulative signal.
First strategy
This indicator plots 2/20 exponential moving average. For the Mov
Avg X 2/20 Indicator, the EMA bar will be painted when the Alert criteria is met.
Second strategy
This indicator calculates 3 Moving Averages for default values of
13, 8 and 5 days, with displacement 8, 5 and 3 days: Median Price (High+Low/2).
The most popular method of interpreting a moving average is to compare
the relationship between a moving average of the security's price with
the security's price itself (or between several moving averages).
WARNING:
- For purpose educate only
- This script to change bars colors.

Moving Average Band Width ((((20/04/2022))))Todays Script uses 5 Moving Averages with the new function on V5 called fill, we can now colour fill between moving averages.
9ema
20ema
50ema
100ema
200ema
100-200ema which is labelled in Redis where the big impulse moves will fall into if the pressure is so strong on the opposite of the trend.
50-100ema which is labelled in Blue is where price could be heading in a healthy trend
20-50ema which is labelled in Purple, price will enter this area when price is in a strong impulse move/trend
9-20ema which is labelled in Green is a super strong trend/ impulse move, price will most likely break this stream and enter the 20-50ema
(the colour of EMAS can be changed in the settings)
I would use this to either gauge the strength of a trend//impulse leg or buy/sell opportunities.
This works best in trending environments, LTF and liquid markets

Combo 2/20 EMA & Bear Power This is combo strategies for get a cumulative signal.
First strategy
This indicator plots 2/20 exponential moving average. For the Mov
Avg X 2/20 Indicator, the EMA bar will be painted when the Alert criteria is met.
Second strategy
Bear Power Indicator
To get more information please see "Bull And Bear Balance Indicator"
by Vadim Gimelfarb.
WARNING:
- For purpose educate only
- This script to change bars colors.
Combo 2/20 EMA & (H-L)/C Histogram This is combo strategies for get a cumulative signal.
First strategy
This indicator plots 2/20 exponential moving average. For the Mov
Avg X 2/20 Indicator, the EMA bar will be painted when the Alert criteria is met.
Second strategy
This histogram displays (high-low)/close
Can be applied to any time frame.
WARNING:
- For purpose educate only
- This script to change bars colors.
Combo 2/20 EMA & Bandpass Filter This is combo strategies for get a cumulative signal.
First strategy
This indicator plots 2/20 exponential moving average. For the Mov
Avg X 2/20 Indicator, the EMA bar will be painted when the Alert criteria is met.
Second strategy
The related article is copyrighted material from
Stocks & Commodities Mar 2010
WARNING:
- For purpose educate only
- This script to change bars colors.