Blue Ocean BOATS 24/5 US Market DataThis script utilizes Blue Ocean's ATS (Alternative Trading System) and U.S. exchange market data to create a continuous candlestick chart. The continuous data has the option to be used as an indicator or strategy source.
Requirements
The main chart symbol (which can be unrelated to the user-input Ticker Symbol) needs to be a 24/7 chart. An example symbol is CRYPTO:BTCUSD. CME_MINI:ES1! and FX:SPX500 work too, but are not truly 24/5 and will miss ~4 hours of the total trading week from the extended U.S. session.
The main chart's timeframe needs to be intraday. Because the script's output is currently inconsistent on daily or higher timeframes, it will disable itself.
The Ticker Symbol chosen should be a ticker that is traded on U.S. exchanges. This will provide both U.S. extended session data and a BOATS equivalent.
Usage & configuration
This script visualizes the 24-hour Monday-Friday chart of a U.S. exchange ticker. Going a step further, it can be used to compare the performance indices or cryptocurrencies to stock constituents of indices, cryptocurrency treasury stocks or holding ETFs.
The script's output, candlesticks, can be overlaid on the main chart or used as is. A "Price Source" plot is used for indicators or strategies.
Ticker Symbol: The U.S. ticker you'd like to view extended session and Blue Ocean ATS session data for.
Price Source: Price source that can be used for indicators or strategies.
Highlight Sessions: Highlight the different trading sessions.
Last Price Line: Show a horizontal line at the last traded price.
Ticker Symbol Check: Plots a label that will display only if the selected Ticker Symbol is not detected as a U.S. exchange traded ticker.
Earnings Label: Creates a label at the time of past earnings of the chosen Ticker Symbol. The time that the earnings are plotted is approximate. Because of this, the label is meant as an explanation for price action.
What this script does and how it works
It creates OHLC candlesticks by merging Blue Ocean's ATS market data and U.S. exchange data. From the OHLC data of both, a single output can be used for indicators or strategies.
References and further information
www.tradingview.com
The Blue Ocean ATS allows trading from 20:00 to 4:00 Eastern Time, Sunday through Thursday. This critical timeframe bridges the eight-hour overnight gap when major U.S. exchanges are closed.
blueocean-tech.io
Blue Ocean ATS, LLC is a US broker dealer which operates the alternative trading system BOATS. Our trading platform offers electronic access, price discovery, compliant regulatory reporting requirements, and standard clearing and settlement processes.
www.nyse.com
Hours mentioned are in Eastern Time.
Overnight trading remains far less active than extended hours trading. The hour with the highest overnight volume is 9:00PM, which averages 2.94 million shares per day and coincides with several Asian market opens. This volume is a fraction of the last hour of extended hours trading, which averages 43.22 million shares. The first hour of pre-core reported volume averages 113.30 million shares per day.
Overnight executions, in addition to the peak in the 9:00PM hour, also exhibits a smaller peak at 3:00AM, of 2.35 million shares. This coincides with several Asian bourses’ end of their regular trading day.
Example of using the script in the main chart window and the difference in how RSI may be calculated.
Note: ATS is not the name of the 20:00 to 4:00 ET session itself, and the term refers to a broader definition of trading systems that include dark pools, which can be different.
24/5 Monday-Friday really means NY time Sunday night to Friday afternoon.
Cari dalam skrip untuk "20蒙古币兑换人民币"

BTC 5M Scalper: 3EMA Reversal v1.6 Lite by AIOBest Timeframe: 5 minutes!!
Optimal Asset: BTC/USDT (Bitcoin)
Stop Placement: Below the signal candle's low (for long) / Above the signal candle's high (for short)
Risk/Reward: Minimum 1:2 ratio recommended
Description:
This 3EMA Reversal strategy identifies trend continuation signals using:
Fast EMA (20) and Slow EMA (50) crossover
Volume confirmation (above 20-period average)
Engulfing candle pattern
Built-in stop loss and take profit levels
Usage Instructions:
Apply to BTC/USDT 5-minute chart
Enter long when green triangle appears (stop below signal candle)
Enter short when red triangle appears (stop above signal candle)
TP levels are automatically calculated based on your RR setting
Pro Tip: Combine with 1-hour trend analysis for better results. The strategy works best in trending markets with above-average volume.

Hunting Bollinger Bands for scalping📌 Bollinger Band Reversal BUY/SELL Indicator
Name: Hunting Bollinger Bands for scalping
Purpose: Displays reversal signals for short-term scalping in range-bound markets.
Target Users: Scalpers and day traders, especially for trading Gold (XAU/USD).
Recommended Target: Works well for scalping approximately $3 price movements on Gold.
Core Logic:
Detects excessive price deviation using Bollinger Bands (±2σ).
Filters out excessive signals with a bar interval limiter.
Displays clear and simple BUY/SELL labels for entry timing.
📌 Signal Conditions
BUY
Price closes below the Lower Bollinger Band.
At least the specified number of bars has passed since the previous signal.
Displays a “BUY” label below the bar.
SELL
Price closes above the Upper Bollinger Band.
At least the specified number of bars has passed since the previous signal.
Displays a “SELL” label above the bar.
📌 Parameters
Parameter Description Default
Bollinger Band Length (bbLength) Period for Bollinger Band calculation 20
Standard Deviation (bbStdDev) Standard deviation multiplier for band width 2.0
Signal Interval (barLimit) Minimum bar interval to avoid repeated signals 10
📌 How to Use
Add the indicator to your chart; Bollinger Bands and BUY/SELL labels will appear.
When a signal appears, confirm price reaction and enter a scalp trade (around $3 for Gold is recommended).
Adjust the “Signal Interval (barLimit)” to control signal frequency.
Avoid using it during high-impact news events or strong trending markets.
📌 Best Market Conditions
Range-bound markets
Scalping small price movements (~$3)
Low-volatility sessions (e.g. Asian session for Gold)
📌 Notes
May generate frequent signals during strong trends, leading to potential losses.
Can be combined with other indicators (e.g. 200 MA, RSI, VWAP) for higher accuracy.
Signals are for reference only and should not be used as the sole trading decision factor.
📌 ボリンジャーバンド逆張りBUY/SELL インジケーター解説
名前:Hunting Bollinger Bands for scalping
目的:レンジ相場での短期的な反発を狙った逆張りシグナルを表示
対象ユーザー:スキャルピングやデイトレードで、特にゴールド(XAU/USD)での小幅な値動きを狙うトレーダー
推奨利幅:ゴールドでおよそ 3ドル前後 を目安にスキャルピングを行うと有効
メインロジック:
ボリンジャーバンド(±2σ)で過剰な価格乖離を検出
バー間隔フィルターで過剰シグナルを制御
BUY/SELLラベルで視覚的にシンプルなエントリーポイントを表示
📌 シグナル条件
BUY(買いシグナル)
現在価格が ボリンジャーバンド下限(Lower Band)を下回った時
前回シグナルから指定したバー数以上経過
この条件を満たした場合、ローソク足下に「BUY」ラベルを表示します。
SELL(売りシグナル)
現在価格が ボリンジャーバンド上限(Upper Band)を上回った時
前回シグナルから指定したバー数以上経過
この条件を満たした場合、ローソク足上に「SELL」ラベルを表示します。
📌 パラメータ
項目 説明 初期値
ボリンジャーバンド期間 (bbLength) ボリンジャーバンド計算の期間 20
標準偏差 (bbStdDev) バンド幅を決める標準偏差 2.0
シグナル間隔 (barLimit) シグナルの連続表示を防止する最小バー間隔 10
📌 使い方
インジケーターをチャートに追加すると、ボリンジャーバンドとBUY/SELLラベルが表示されます
シグナルが出たら、反発確認後にスキャルピングエントリー(ゴールドなら約3ドルを目安に)
「シグナル間隔(barLimit)」を調整して、シグナルの過剰表示を防ぐ
経済指標発表や強いトレンド発生時は使用を控える
📌 このインジケーターが向いている相場
レンジ相場
小さな値幅(約3ドル前後)を狙うスキャルピング
トレンドが弱い横ばいの時間帯(例:アジア時間のゴールドなど)
📌 注意点
強いトレンド相場では、逆張りシグナルが連続的に発生し、損切りが増える可能性あり
200MAやRSI、VWAPなど他の指標と組み合わせることで精度を高められる
シグナルは参考用であり、単独での売買判断は推奨されない

Patrón Mecha ProfundaThis pattern must be combined with a 20-period moving average. It is used to know the direction of the price. When the pattern appears and the price is above the 20-period moving average, it is a bullish signal and vice versa.
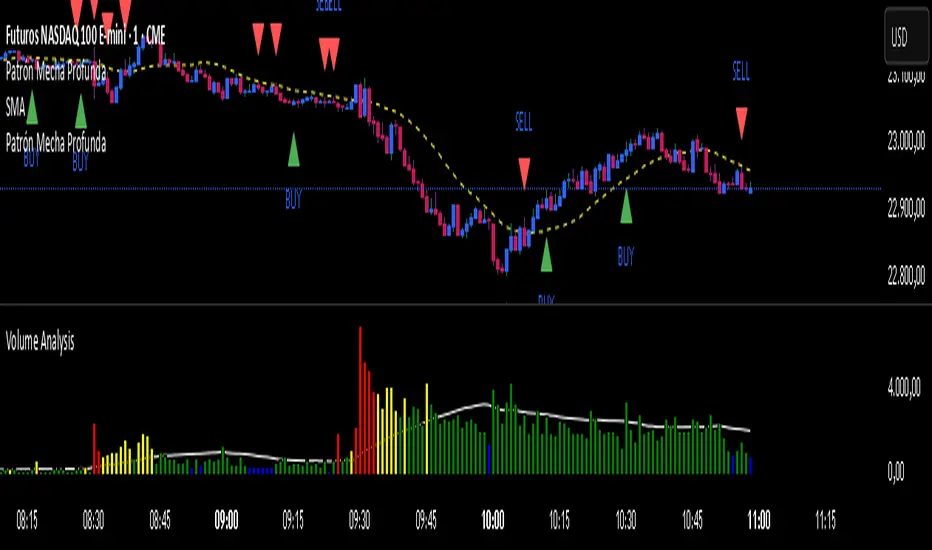
Patrón Mecha Profunda
This pattern must be combined with a 20-period moving average. It is used to know the direction of the price. When the pattern appears and the price is above the 20-period moving average, it is a bullish signal and vice versa.

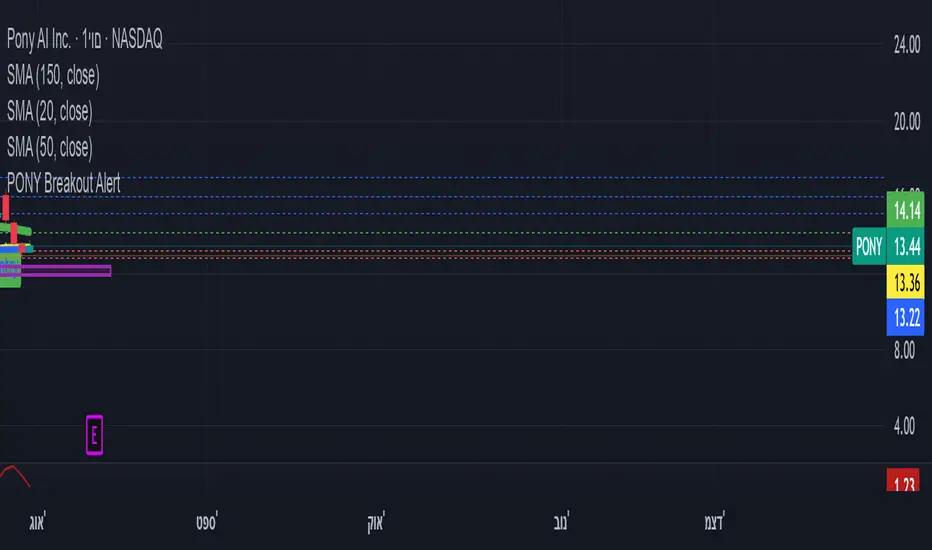
ombs- PONY Breakout Alert
🧠 תקציר הסקריפט: **PONY Breakout Alert 📈
🔍 **מטרה**:
לזהות **פריצה מעלה של רמת 14.15** תוך כדי **מחזור מסחר גבוה מהממוצע**, כדי לאתר **הזדמנות מסחר שורית**.
---
⚙️ רכיבי הסקריפט:
* 📌 **רמת כניסה**:
`entryLevel = 14.15`
* 📊 **תנאי כניסה**:
* סגירת מחיר **מעל 14.15**
* נפח מסחר **גבוה ב־20% מהממוצע ל־20 הימים האחרונים**
* 🔔 **התראה ויזואלית**:
* סמל ירוק "Entry" מופיע מתחת לנר על הגרף
* קווים קבועים לרמות יעד וסטופלוס
* 🎯 **יעדי רווח**:
* Target 1 – 15.15
* Target 2 – 16.00
* Target 3 – 17.00
* 🛑 **סטופלוס**:
* שמרני: 13.20
* אגרסיבי: 12.80
* 🔔 **התראה אוטומטית** (`alertcondition`):
תשלח הודעה:
*"PONY פרצה מעל 14.15 עם מחזור גבוה – שקול כניסה לעסקה."*
---
📝 מתאים עבור:
* סוחרי ניתוח טכני 🧮
* מי שמחפש כניסה מבוססת על פריצה + נפח 📊
* שימוש על גרף יומי בלבד 📅
---
🧠 Script Summary: PONY Breakout Alert 📈
🔍 Objective:
Detect a breakout above the 14.15 level accompanied by high trading volume, in order to identify a bullish trading opportunity.
⚙️ Script Components:
📌 Entry Level:
entryLevel = 14.15
📊 Entry Conditions:
Price closes above 14.15
Volume is 20% higher than the 20-day average
🔔 Visual Alert:
A green "Entry" label appears below the bar on the chart
Static horizontal lines mark targets and stop-loss levels
🎯 Profit Targets:
Target 1 – 15.15
Target 2 – 16.00
Target 3 – 17.00
🛑 Stop Loss:
Conservative: 13.20
Aggressive: 12.80
🔔 Automated Alert (alertcondition):
Sends a message:
"PONY has broken above 14.15 with high volume – consider a long position."
📝 Ideal For:
Technical traders 🧮
Those seeking breakouts confirmed by volume 📊
Daily chart setups only 📅
MA Crossover Detector
The Moving Average Crossover Detector is a custom indicator that visually shows buy and sell signals clearly on the chart. based on the crossing of two moving averages — a popular and beginner-friendly tool in technical analysis.
It plots two moving averages — One fast (short period) and one slow (long period) — and highlights crossover points:
✅ Buy Signal (Golden Cross) – When the fast MA crosses above the slow MA.
❌ Sell Signal (Death Cross) – When the fast MA crosses below the slow MA.
✅ Features
Visual: Clearly shows crossovers on the chart.
Customizable: Choose periods, types, styles, etc.
Alert-ready: You can set alerts for crossovers.
The Moving Average (MA) Crossover Strategy is one of the simplest and most widely used strategies in technical analysis for trading stocks, forex, crypto, and other markets. It relies on the interaction between two moving averages to generate buy and sell signals.
Core Components
Short-Term Moving Average (Fast MA) : Reacts quickly to price changes (e.g., 9-period or 20-period).
Long-Term Moving Average (Slow MA) : Reacts more slowly to price changes (e.g., 21-period or 200-period).
How the Strategy Works
Bullish Crossover (Golden Cross):
Occurs when the fast MA crosses above the slow MA. Interpreted as a buy signal, indicating a potential uptrend.
Bearish Crossover (Death Cross):
Occurs when the fast MA crosses below the slow MA. Interpreted as a sell signal, indicating a potential downtrend.
Common Variants
Short-term trading
9 EMA
21 EMA
Swing trading
20 SMA
50 SMA
Long-term investing
50 SMA
200 SMA
Pros
Easy to understand and implement
Works well in trending markets
Can be automated for backtesting and execution
Cons
Lagging indicator: MAs are based on past prices, so signals come after the move has started.
Choppy markets = whipsaws: Generates false signals in sideways/range-bound conditions.
May underperform in volatile or mean-reverting environments
Tips for Improvement
Use confirmation tools : e.g., RSI, MACD, volume analysis, price action
Add filters : Trend filter (ADX), volatility filter (ATR), or time filter (session-based)
Combine with price structure : Support/resistance, breakouts, pullbacks

Candle Size Calculator# Candle Size Calculator
**A powerful position sizing tool that calculates optimal position sizes based on risk management and stop loss levels from historical candles.**
## 🎯 What it does
This indicator helps traders determine the exact position size for their trades by calculating the risk-to-reward ratio between the current price and stop loss levels from previous candles. Perfect for consistent risk management across all your trades.
## 📊 Key Features
- **Smart Position Sizing**: Automatically calculates position size based on your risk amount and distance to stop loss
- **Multiple Candle Analysis**: Analyze up to 20 previous candles to find optimal stop loss levels
- **Direction Support**: Works for both Long and Short positions
- **Clean Table Display**: Shows all calculations in an easy-to-read table format
## ⚙️ Settings
- **Number of Candles**: Choose how many previous candles to analyze (1-20)
- **Risk Amount**: Set your maximum risk per trade in dollars
- **Direction**: Select Long or Short trading direction
- **Table Position**: Choose from 6 different table positions (top/bottom + left/center/right)
- **Font Size**: Select from 5 font sizes (tiny to huge)
## 🎨 Visual Design
- Modern dark theme that matches TradingView's interface
- Color-coded text: Green for Long positions, Red for Short positions
- Clean, borderless design for minimal chart clutter
- Customizable positioning to fit your chart layout
## 📈 How it works
1. **Entry Price**: Always uses the current market price
2. **Stop Loss**:
- For Long positions: Uses the low of selected candles
- For Short positions: Uses the high of selected candles
3. **Position Size**: Calculated as Risk Amount ÷ |Current Price - Stop Price|
## 💡 Use Cases
- **Risk Management**: Maintain consistent risk across all trades
- **Position Sizing**: Never risk more than your predetermined amount
- **Stop Loss Planning**: Identify optimal stop loss levels from recent price action
- **Quick Analysis**: Instantly see position sizes for multiple stop loss scenarios
## 🚀 Perfect for
- Day traders who need quick position size calculations
- Swing traders planning entries with historical support/resistance
- Anyone practicing proper risk management
- Traders who want to automate position sizing calculations
---
*Clean, efficient, and essential for serious traders who prioritize risk management.*

4H Bollinger Breakout StrategyThis strategy leverages Bollinger Bands on the 4-hour timeframe for long and short trades in trending or ranging markets. Entries trigger on BB breakouts with optional filters for volume, trend, and RSI. Exits occur on opposite BB crosses. Customizable for long-only, short-only, or indicator mode via code comments. Supports forex, stocks, or crypto with full equity allocation and 0.1% commission.
Length (Default: 20): Period for BB basis and std dev; shorter for sensitivity, longer for smoothing.
Basis MA Type (Default: SMA): Selects MA for middle band (SMA, EMA, etc.); EMA for faster response.
Source (Default: Close): Price input for calculations; use close for standard accuracy.
StdDev Multiplier (Default: 1.8): Band width control; higher for fewer signals, lower for more.
Offset (Default: 0): Shifts BB plots; typically unchanged.
Use Filters (Default: True): Applies volume, trend, RSI checks to filter signals.
Volume MA Length (Default: 20): For volume filter (long: >105% avg, short: >120%).
Trend MA Length (Default: 80): SMA for trend filter (long: above MA, short: below).
RSI Length (Default: 14): For short filter (entry if RSI <85).
Use Long/Short Signals (Defaults: True): Toggles directions; long entry on lower BB crossover, short on upper crossunder.
Visuals: BB plots (blue basis, red upper, green lower), orange trend MA, filled background.
Labels/Alerts: Green/red for long entry/exit, yellow/purple for short; alert conditions included.

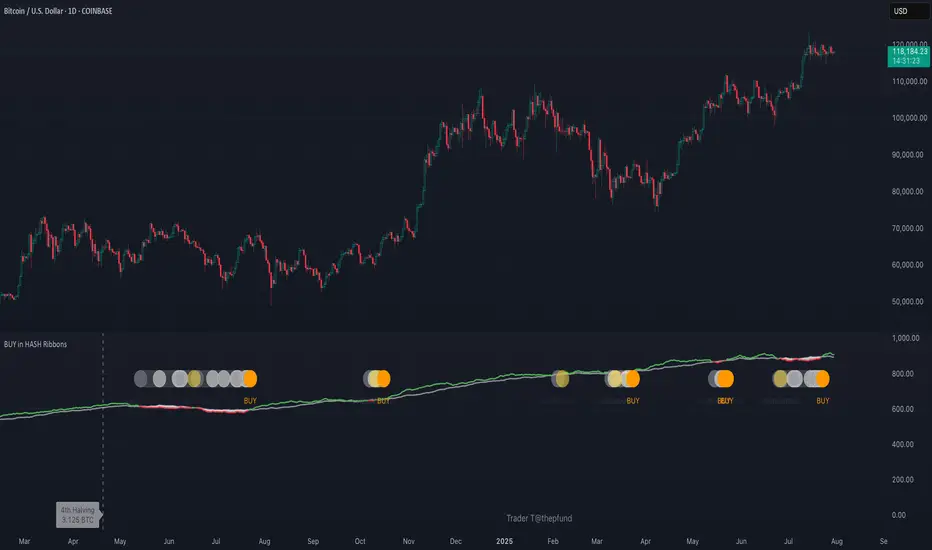
BUY in HASH RibbonsHash Ribbons Indicator (BUY Signal)
A TradingView Pine Script v6 implementation for identifying Bitcoin miner capitulation (“Springs”) and recovery phases based on hash rate data. It marks potential low-risk buying opportunities by tracking short- and long-term moving averages of the network hash rate.
⸻
Key Features
• Hash Rate SMAs
• Short-term SMA (default: 30 days)
• Long-term SMA (default: 60 days)
• Phase Markers
• Gray circle: Short SMA crosses below long SMA (start of capitulation)
• White circles: Ongoing capitulation, with brighter white when the short SMA turns upward
• Yellow circle: Short SMA crosses back above long SMA (end of capitulation)
• Orange circle: Buy signal once hash rate recovery aligns with bullish price momentum (10-day price SMA crosses above 20-day price SMA)
• Display Modes
• Ribbons: Plots the two SMAs as colored bands—red for capitulation, green for recovery
• Oscillator: Shows the percentage difference between SMAs as a histogram (red for negative, blue for positive)
• Optional Overlays
• Bitcoin halving dates (2012, 2016, 2020, 2024) with dashed lines and labels
• Raw hash rate data in EH/s
• Alerts
• Configurable alerts for capitulation start, recovery, and buy signals
⸻
How It Works
1. Data Source: Fetches daily hash rate values from a selected provider (e.g., IntoTheBlock, Quandl).
2. Capitulation Detection: When the 30-day SMA falls below the 60-day SMA, miners are likely capitulating.
3. Recovery Identification: A rising 30-day SMA during capitulation signals miner recovery.
4. Buy Signal: Confirmed when the hash rate recovery coincides with a bullish shift in price momentum (10-day price SMA > 20-day price SMA).
⸻
Inputs
Hash Rate Short SMA: 30 days
Hash Rate Long SMA: 60 days
Plot Signals: On
Plot Halvings: Off
Plot Raw Hash Rate: Off
⸻
Considerations
• Timeframe: Best applied on daily charts to capture meaningful miner behavior.
• Data Reliability: Ensure the chosen hash rate source provides consistent, gap-free data.
• Risk Management: Use alongside other technical indicators (e.g., RSI, MACD) and fundamental analysis.
• Backtesting: Evaluate performance over different market cycles before live deployment.
Smart Volatility Squeeze + Trend Filter📌 Purpose
This indicator detects volatility squeeze conditions when Bollinger Bands contract inside Keltner Channels and signals potential breakout opportunities.
It also includes an optional EMA-based trend filter to align signals with the dominant market direction.
🧠 How It Works
1. Squeeze Condition
Bollinger Bands (BB): Length = 20, StdDev = 2.0 (default)
Keltner Channels (KC): EMA Length = 20, ATR Multiplier = 1.5 (default)
Squeeze ON: Occurs when BB Upper < KC Upper and BB Lower > KC Lower (low volatility zone).
2. Breakout Signals
Long Breakout: Price crosses above BB Upper after squeeze.
Short Breakout: Price crosses below BB Lower after squeeze.
3. Trend Filter (optional)
EMA(50) used to confirm breakout direction:
Long signals allowed only if price > EMA(50)
Short signals allowed only if price < EMA(50)
Toggle Use Trend Filter to enable/disable.
4. Visual & Alerts
Green circle at chart bottom indicates Squeeze ON.
Green/Red triangles mark breakouts.
Background gradually brightens during squeeze buildup.
Alerts available for long and short breakouts.
📈 How to Use
Look for Squeeze ON → then wait for breakout arrows.
Trade in breakout direction, preferably with trend filter ON.
Works best on higher timeframes (1h, 4h, D) and trending markets.
Markets: Crypto, Forex, Stocks — effective in volatile assets.
⚙️ Inputs
BB Length / StdDev
KC EMA Length / ATR Multiplier
Use Trend Filter
Trend EMA Length
⚠️ Disclaimer
This script is for educational purposes only. It does not constitute financial advice.
Always test thoroughly before live trading.

Price Exhaustion Envelope [BackQuant]Price Exhaustion Envelope
Visual preview of the bands:
What it is
The Price Exhaustion Envelope (PEE) is a multi‑factor overextension detector wrapped inside a dynamic envelope framework. It measures how “tired” a move is by blending price stretch, volume surges, momentum and acceleration, plus optional RSI divergence. The result is a composite exhaustion score that drives both on‑chart signals and the adaptive width of three optional envelope bands around a smoothed baseline. When the score spikes above or below your chosen threshold, the script can flag exhaustion, paint candles, tint the background and fire alerts.
How it works under the hood
Exhaustion score
Price component: distance of close from its mean in standard deviation units.
Volume component: normalized volume pressure that highlights unusual participation.
Momentum component: rate of change and acceleration of price, scaled by their own volatility.
RSI divergence (optional): bullish and bearish divergences gently push the score lower or higher.
Mode control: choose Price, Volume, Momentum or Composite. Composite averages the main pieces for a balanced view.
Energy scale (0 to 100)
The composite score is pushed through a logistic transform to create an “energy” value. High energy (above 70 to 80) signals a move that may be running hot, while very low energy (below 20 to 30) points to exhaustion on the downside.
Envelope engine
Baseline: EMA of price over the main lookback length.
Width: base width is standard deviation times a multiplier.
Type selector:
• Static keeps the width fixed.
• Dynamic expands width in proportion to the absolute exhaustion score.
• Adaptive links width to the energy reading so bands breathe with market “heat.”
Smoothing: a short EMA on the width reduces jitter and keeps bands pleasant to trade around.
Band architecture
You can toggle up to three symmetric bands on each side of the baseline. They default to 1.0, 1.6 and 2.2 multiples of the smoothed width. Soft transparent fills create a layered thermograph of extension. The outermost band often maps to true blow‑off extremes.
On‑chart elements
Baseline line that flips color in real time depending on where price sits.
Up to three upper and lower bands with progressive opacity.
Triangle markers at fresh exhaustion triggers.
Tiny warning glyphs at extreme upper or lower breaches.
Optional bar coloring to visually tag exhausted candles.
Background halo when energy > 80 or < 20 for instant context.
A compact info table showing State, Score, Energy, Momentum score and where price sits inside the envelope (percent).
How to use it in trading
Mean reversion plays
When price pierces the outer band and an exhaustion marker prints, look for reversal candles or lower‑timeframe confirmation to fade the move back toward the baseline.
For conservative entries, wait for the composite score to roll back under the threshold or for energy to drop from extreme to neutral.
Set stops just beyond the extreme levels (use extreme_upper and extreme_lower as natural invalidation points). Targets can be the baseline or the opposite inner band.
Trend continuation with smart pullbacks
In strong trends, the first tag of Band 1 or Band 2 against the dominant direction often offers low‑risk continuation entries. Use energy readings: if energy is low on a pullback during an uptrend, a bounce is more likely.
Combine with RSI divergence: hidden bullish divergence near a lower band in an uptrend can be a powerful confirmation.
Breakout filtering
A breakout that occurs while the composite score is still moderate (not exhausted) has a higher chance of follow‑through. Skip signals when energy is already above 80 and price is punching the outer band, as the move may be late.
Watch env_position (Envelope %) in the table. Breakouts near 40 to 60 percent of the envelope are “healthy,” while those at 95 percent are stretched.
Scaling out and risk control
Use exhaustion alerts to trim positions into strength or weakness.
Trail stops just outside Band 2 or Band 3 to stay in trends while letting the envelope expand in volatile phases.
Multi‑timeframe confluence
Run the script on a higher timeframe to locate exhaustion context, then drill down to a lower timeframe for entries.
Opposite signals across timeframes (daily exhaustion vs. 5‑minute breakout) warn you to reduce size or tighten management.
Key inputs to experiment with
Lookback Period: larger values smooth the score and envelope, ideal for swing trading. Shorter values make it reactive for scalps.
Exhaustion Threshold: raise above 2.0 in choppy assets to cut noise, drop to 1.5 for smooth FX pairs.
Envelope Type: Dynamic is great for crypto spikes, Adaptive shines in stocks where volume and volatility wave together.
RSI Divergence: turn off if you prefer a pure price/volume model or if divergence floods the score in your asset.
Alert set included
Fresh upper exhaustion
Fresh lower exhaustion
Extreme upper breach
Extreme lower breach
RSI bearish divergence
RSI bullish divergence
Hook these to TradingView notifications so you get pinged the moment a move hits exhaustion.
Best practices
Always pair exhaustion signals with structure. Support and resistance, liquidity pools and session opens matter.
Avoid blindly shorting every upper signal in a roaring bull market. Let the envelope type help you filter.
Use the table to sanity‑check: a very high score but mid‑range env_position means the band may still be wide enough to absorb more movement.
Backtest threshold combinations on your instrument. Different tickers carry different volatility fingerprints.
Final note
Price Exhaustion Envelope is a flexible framework, not a turnkey system. It excels as a context layer that tells you when the crowd is pressing too hard or when a move still has fuel. Combine it with sound execution tactics, risk limits and market awareness. Trade safe and let the envelope breathe with the market.

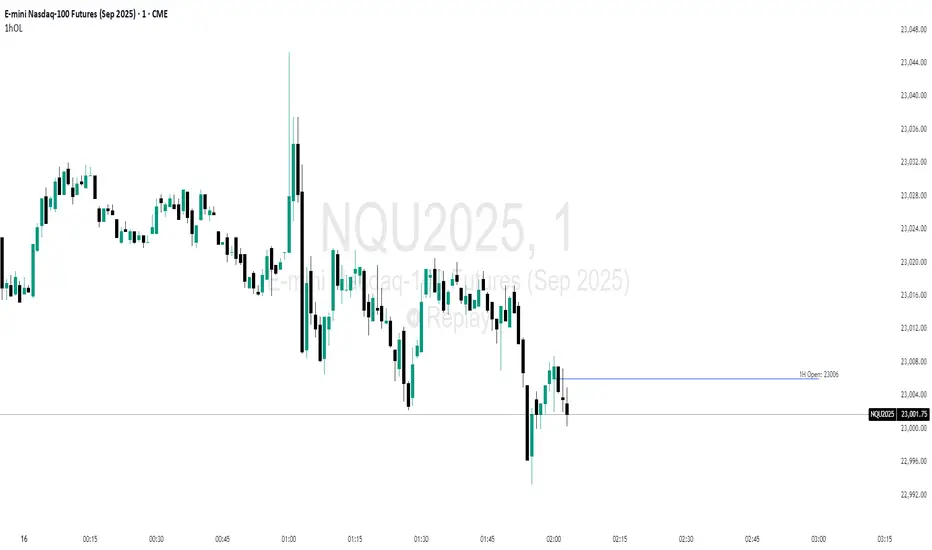
Current Hourly Open Liquidity with Sweep DetectionStatistics indicate that if the current hourly candle reaches the high or low of the previous hourly candle, there is a strong likelihood that the price will return to the current hour's open, depending on how quickly the previous hour's high or low was swept. If the sweep occurs within the first 20 minutes, there is a 75% chance the current hour's open will be reached; if it takes between 21 and 40 minutes, the probability decreases to 50%; and if it takes longer than 41 minutes, the chance drops to 25%.
These statistics can help identify manipulation on the hourly timeframe and guide trade decisions accordingly. For instance, if the previous hourly high is taken within the first 20 minutes but the current hour's open is not reached, it may be wise to avoid long positions until it happens or consider short positions in the direction of the open liquidity, using your existing entry rules and risk management.
The indicator highlights the current hour's open with a line and label to visually represent that liquidity pool, adjusting the line's color based on whether and when the previous hour's high or low was tapped. Once the open is reached, the indicator can, depending on settings, remove the line and label from the chart (this is enabled by default) since the liquidity pool is no longer relevant, preventing chart clutter.
All colors, line widths, label text sizes, and colors can be customized.
Momentum Reversal StrategyBEST USE IN 15MIN TIME FRAME EURUSD / XAUSUD
1. Strategy Overview
This strategy hunts short-term momentum reversals at key levels during high-liquidity sessions.
Timeframes: 5-minute for entries; 15-minute for trend context
Sessions: London for EUR/USD & GBP/USD; New York for XAU/USD
Pairs: EUR/USD, GBP/USD, XAU/USD
Indicators (3 max):
EMA(20) and EMA(50) (close)
MACD (12, 26, 9) histogram
Optional: RSI(14) (for divergence filter)
2. Entry Rules
Trend Filter (15 min):
Long only if EMA20 > EMA50; short only if EMA20 < EMA50.
Price-Action Zone (5 min):
Identify recent swing high/low within past 20 bars.
Draw horizontal support (for longs) or resistance (for shorts).
Indicator Alignment (5 min):
MACD histogram crossing from negative to positive for longs, positive to negative for shorts.
Candle close beyond EMA20 in direction of trade.
Candle Confirmation:
Bullish engulfing or hammer at support for longs; bearish engulfing or shooting star at resistance for shorts.
Entry Execution:
Place market order on candle close that meets all above.
3. Exit Rules
Stop-Loss (SL):
Long: 1.5× ATR(14) below entry candle low.
Short: 1.5× ATR(14) above entry candle high.
Take-Profit (TP):
Set at 2× SL distance (RR 1:2).
Trailing SL:
After price moves 1× SL in profit, trail SL to breakeven.
Partial Booking:
Close 50% at 1× SL (50% of TP), move SL to entry.
Close remaining at full TP.
4. Trade Management
False Signal Filter: Skip trades when RSI(14) > 70 for longs or < 30 for shorts (avoids overbought/oversold extremes).
One Trade at a Time: No multiple positions on same pair.
Session Cutoff: Close any open trade 15 minutes before session end.
5. Risk Parameters
Risk per Trade: 1% of account equity.
Reward Target: ≥2% (1:2 RR) per trade.
Win-Rate Expectancy: ≥75% based on indicator confluence and price-action confirmation.

WT + Stoch RSI Reversal Combo📊MR.Z RSI : WT + Stochastic RSI Reversal Combo
This custom indicator combines WaveTrend oscillator and Stochastic RSI to detect high-confidence market reversal points, filtering signals so they only appear when both indicators align.
🔍 Core Components:
✅ WaveTrend Oscillator
Based on smoothed deviation from EMA (similar to TCI logic)
Plots:
WT1 (main line)
WT2 (signal line = SMA of WT1)
Uses overbought/oversold thresholds (default: ±53) to filter signals
✅ Stochastic RSI
Momentum oscillator based on RSI's stochastic value
Plots:
%K: smoothed Stoch of RSI
%D: smoothed version of %K
Adjustable oversold/overbought thresholds (default: 20/80)
🔁 Combined Reversal Signal Logic:
🔼 Buy Signal
WT1 crosses above WT2 below WT oversold level (e.g., -53)
%K crosses above %D below Stoch RSI oversold level (e.g., 20)
🔽 Sell Signal
WT1 crosses below WT2 above WT overbought level (e.g., 53)
%K crosses below %D above Stoch RSI overbought level (e.g., 80)
🔔 Signals are only plotted and alerted if both conditions are true.
📌 Features:
Toggle on/off:
WaveTrend lines and histogram
Stochastic RSI
Combined Buy/Sell signals
Horizontal reference lines (±100, OB/OS)
Fully customizable smoothing lengths and thresholds
Signal plots:
✅ Green up-triangle = Combo Buy
✅ Red down-triangle = Combo Sell
Optional: Circle/cross markers for WT-only and Stoch-only signals
🔔 Built-in alerts for Buy/Sell signals
📈 Use Cases:
Reversal Trading: Wait for both indicators to confirm momentum shift
Entry Filter: Use in combination with trend indicators (like EMA)
Scalping or Swing: Works on intraday and higher timeframes

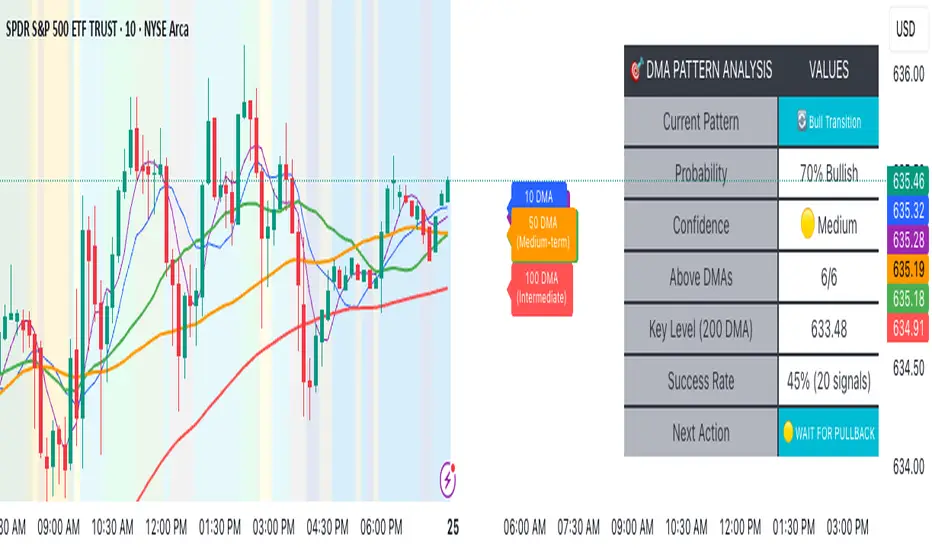
Advanced DMA Pattern Detection SystemAdvanced DMA Pattern Detection System with Smart Intelligence
Professional-grade moving average indicator that combines traditional DMA analysis with advanced pattern recognition and probabilistic forecasting.
Core Features:
6 Key DMAs (5, 10, 20, 50, 100, 200) with descriptive labels showing trading purpose
Advanced Pattern Recognition - Detects Institutional Accumulation, Distribution Phases, Bull/Bear Transitions, and Choppy Markets
Probability Engine - Assigns confidence scores (0-100%) with Low/Medium/High classifications
Historical Validation - Tracks success rate of last 20 pattern signals for real performance data
Smart Alert System - Only triggers on significant pattern changes (20%+ probability shifts)
Dual Display System:
Movable Information Table - Shows current pattern, probability, confidence level, success rate, and recommended action
Chart Alerts & Background Colors - Visual confirmation of high-confidence setups (80%+ patterns)
Traditional DMA Labels - Clear identification of each average's trading significance
Complete Customization:
Master on/off controls for entire system
Individual toggles for all components (DMAs, table, alerts, colors)
Adjustable alert sensitivity (Conservative/Medium/Aggressive)
6 table positions to fit any chart layout
Perfect For: Swing traders, position traders, and anyone wanting systematic trend analysis with quantified probability scores rather than subjective interpretation.
Bottom Line: Transforms basic moving averages into an intelligent trading system that tells you exactly what the market structure means and what to do about it.
MA Table [RanaAlgo]The "MA Table " indicator is a comprehensive and visually appealing tool for tracking moving average signals in TradingView. Here's a short summary of its usefulness:
Key Features:
Dual MA Support:
Tracks both EMA (Exponential Moving Average) and SMA (Simple Moving Average) signals (10, 20, 30, 50, 100 periods).
Users can toggle visibility for EMA/SMA separately.
Clear Signal Visualization:
Displays Buy (▲) or Sell (▼) signals based on price position relative to each MA.
Color-coded (green for buy, red for sell) for quick interpretation.
Customizable Table Design:
Adjustable position (9 placement options), colors, text size, and border styling.
Alternating row colors improve readability.
Optional MA Plots:
Can display the actual MA lines on the chart for visual confirmation (with distinct colors/styles).
Usefulness:
Quick Overview: The table consolidates multiple MA signals in one place, saving time compared to checking each MA individually.
Trend Confirmation: Helps confirm trend strength when multiple MAs align (e.g., price above all MAs → strong uptrend).
Flexible: Suitable for both short-term (10-20 period) and long-term (50-100 period) traders.
Aesthetic: Professional design enhances chart clarity without clutter.
Ideal For:
Traders who rely on moving average crossovers or price-MA relationships.
Multi-timeframe analysis when combined with other tools.
Beginners learning MA strategies (clear visual feedback).

🌊 Reinhart-Rogoff Financial Instability Index (RR-FII)Overview
The Reinhart-Rogoff Financial Instability Index (RR-FII) is a multi-factor indicator that consolidates historical crisis patterns into a single risk score ranging from 0 to 100. Drawing from the extensive research in "This Time is Different: Eight Centuries of Financial Crises" by Carmen M. Reinhart and Kenneth S. Rogoff, the RR-FII translates nearly a millennium of crisis data into practical insights for financial markets.
What It Does
The RR-FII acts like a real-time financial weather forecast by tracking four key stress indicators that historically signal the build-up to major financial crises. Unlike traditional indicators based only on price, it takes a broader view, examining the global market's interconnected conditions to provide a holistic assessment of systemic risk.
The Four Crisis Components
- Capital Flow Stress (Default weight: 25%)
- Data analyzed: Volatility (ATR) and price movements of the selected asset.
- Detects abrupt volatility surges or sharp price falls, which often precede debt defaults due to sudden stops in capital inflow.
- Commodity Cycle (Default weight: 20%)
- Data analyzed: US crude oil prices (customizable).
- Watches for significant declines from recent highs, since commodity price troughs often signal looming crises in emerging markets.
- Currency Crisis (Default weight: 30%)
- Data analyzed: US Dollar Index (DXY, customizable).
- Flags if the currency depreciates by more than 15% in a year, aligning with historical criteria for currency crashes linked to defaults.
- Banking Sector Health (Default weight: 25%)
- Data analyzed: Performance of financial sector ETFs (e.g., XLF) relative to broad market benchmarks (SPY).
- Monitors for underperformance in the financial sector, a strong indicator of broader financial instability.
Risk Scale Interpretation
- 0-20: Safe – Low systemic risk, normal conditions.
- 20-40: Moderate – Some signs of stress, increased caution advised.
- 40-60: Elevated – Multiple risk factors, consider adjusting positions.
- 60-80: High – Significant probability of crisis, implement strong risk controls.
- 80-100: Critical – Several crisis indicators active, exercise maximum caution.
Visual Features
- The main risk line changes color with increasing risk.
- Background colors show different risk zones for quick reference.
- Option to view individual component scores.
- A real-time status table summarizes all component readings.
- Crisis event markers appear when thresholds are breached.
- Customizable alerts notify users of changing risk levels.
How to Use
- Apply as an overlay for broad risk management at the portfolio level.
- Adjust position sizes inversely to the crisis index score.
- Use high index readings as a warning to increase vigilance or reduce exposure.
- Set up alerts for changes in risk levels.
- Analyze using various timeframes; daily and weekly charts yield the best macro insights.
Customizable Settings
- Change the weighting of each crisis factor.
- Switch commodity, currency, banking sector, and benchmark symbols for customized views or regional focus.
- Adjust thresholds and visual settings to match individual risk preferences.
Academic Foundation
Rooted in rigorous analysis of 66 countries and 800 years of data, the RR-FII uses empirically validated relationships and thresholds to assess systemic risk. The indicator embodies key findings: financial crises often follow established patterns, different types of crises frequently coincide, and clear quantitative signals often precede major events.
Best Practices
- Use RR-FII as part of a comprehensive risk management strategy, not as a standalone trading signal.
- Combine with fundamental analysis for complete market insight.
- Monitor for differences between component readings and the overall index.
- Favor higher timeframes for a broader macro view.
- Adjust component importance to suit specific market interests.
Important Disclaimers
- RR-FII assesses risk using patterns from past crises but does not predict future events.
- Historical performance is not a guarantee of future results.
- Always employ proper risk management.
- Consider this tool as one element in a broader analytical toolkit.
- Even with high risk readings, markets may not react immediately.
Technical Requirements
- Compatible with Pine Script v6, suitable for all timeframes and symbols.
- Pulls data automatically for USOIL, DXY, XLF, and SPY.
- Operates without repainting, using only confirmed data.
The RR-FII condenses centuries of financial crisis knowledge into a modern risk management tool, equipping investors and traders with a deeper understanding of when systemic risks are most pronounced.

Fibonacci Sequence Moving Average [BackQuant]Fibonacci Sequence Moving Average with Adaptive Oscillator
1. Overview
The Fibonacci Sequence Moving Average indicator is a two‑part trading framework that combines a custom moving average built from the famous Fibonacci number set with a fully featured oscillator, normalisation engine and divergence suite. The moving average half delivers an adaptive trend line that respects natural market rhythms, while the oscillator half translates that trend information into a bounded momentum stream that is easy to read, easy to compare across assets and rich in confluence signals. Everything from weighting logic to colour palettes can be customised, so the tool comfortably fits scalpers zooming into one‑minute candles as well as position traders running multi‑month trend following campaigns.
2. Core Calculation
Fibonacci periods – The default length array is 5, 8, 13, 21, 34. A single multiplier input lets you scale the whole family up or down without breaking the golden‑ratio spacing. For example a multiplier of 3 yields 15, 24, 39, 63, 102.
Component averages – Each period is passed through Simple Moving Average logic to produce five baseline curves (ma1 through ma5).
Weighting methods – You decide how those five values are blended:
• Equal weighting treats every curve the same.
• Linear weighting applies factors 1‑to‑5 so the slowest curve counts five times as much as the fastest.
• Exponential weighting doubles each step for a fast‑reacting yet still smooth line.
• Fibonacci weighting multiplies each curve by its own period value, honouring the spirit of ratio mathematics.
Smoothing engine – The blended average is then smoothed a second time with your choice of SMA, EMA, DEMA, TEMA, RMA, WMA or HMA. A short smoothing length keeps the result lively, while longer lengths create institution‑grade glide paths that act like dynamic support and resistance.
3. Oscillator Construction
Once the smoothed Fib MA is in place, the script generates a raw oscillator value in one of three flavours:
• Distance – Percentage distance between price and the average. Great for mean‑reversion.
• Momentum – Percentage change of the average itself. Ideal for trend acceleration studies.
• Relative – Distance divided by Average True Range for volatility‑aware scaling.
That raw series is pushed through a look‑back normaliser that rescales every reading into a fixed −100 to +100 window. The normalisation window defaults to 100 bars but can be tightened for fast markets or expanded to capture long regimes.
4. Visual Layer
The oscillator line is gradient‑coloured from deep red through sky blue into bright green, so you can spot subtle momentum shifts with peripheral vision alone. There are four horizontal guide lines: Extreme Bear at −50, Bear Threshold at −20, Bull Threshold at +20 and Extreme Bull at +50. Soft fills above and below the thresholds reinforce the zones without cluttering the chart.
The smoothed Fib MA can be plotted directly on price for immediate trend context, and each of the five component averages can be revealed for educational or research purposes. Optional bar‑painting mirrors oscillator polarity, tinting candles green when momentum is bullish and red when momentum is bearish.
5. Divergence Detection
The script automatically looks for four classes of divergences between price pivots and oscillator pivots:
Regular Bullish, signalling a possible bottom when price prints a lower low but the oscillator prints a higher low.
Hidden Bullish, often a trend‑continuation cue when price makes a higher low while the oscillator slips to a lower low.
Regular Bearish, marking potential tops when price carves a higher high yet the oscillator steps down.
Hidden Bearish, hinting at ongoing downside when price posts a lower high while the oscillator pushes to a higher high.
Each event is tagged with an ℝ or ℍ label at the oscillator pivot, colour‑coded for clarity. Look‑back distances for left and right pivots are fully adjustable so you can fine‑tune sensitivity.
6. Alerts
Five ready‑to‑use alert conditions are included:
• Bullish when the oscillator crosses above +20.
• Bearish when it crosses below −20.
• Extreme Bullish when it pops above +50.
• Extreme Bearish when it dives below −50.
• Zero Cross for momentum inflection.
Attach any of these to TradingView notifications and stay updated without staring at charts.
7. Practical Applications
Swing trading trend filter – Plot the smoothed Fib MA on daily candles and only trade in its direction. Enter on oscillator retracements to the 0 line.
Intraday reversal scouting – On short‑term charts let Distance mode highlight overshoots beyond ±40, then fade those moves back to mean.
Volatility breakout timing – Use Relative mode during earnings season or crypto news cycles to spot momentum surges that adjust for changing ATR.
Divergence confirmation – Layer the oscillator beneath price structure to validate double bottoms, double tops and head‑and‑shoulders patterns.
8. Input Summary
• Source, Fibonacci multiplier, weighting method, smoothing length and type
• Oscillator calculation mode and normalisation look‑back
• Divergence look‑back settings and signal length
• Show or hide options for every visual element
• Full colour and line width customisation
9. Best Practices
Avoid using tiny multipliers on illiquid assets where the shortest Fibonacci window may drop under three bars. In strong trends reduce divergence sensitivity or you may see false counter‑trend flags. For portfolio scanning set oscillator to Momentum mode, hide thresholds and colour bars only, which turns the indicator into a heat‑map that quickly highlights leaders and laggards.
10. Final Notes
The Fibonacci Sequence Moving Average indicator seeks to fuse the mathematical elegance of the golden ratio with modern signal‑processing techniques. It is not a standalone trading system, rather a multi‑purpose information layer that shines when combined with market structure, volume analysis and disciplined risk management. Always test parameters on historical data, be mindful of slippage and remember that past performance is never a guarantee of future results. Trade wisely and enjoy the harmony of Fibonacci mathematics in your technical toolkit.

THF Crossover and Trend Signals Golden & Death Cross with VolumeScript Overview:
This Pine Script is designed to assist traders in identifying key buy/sell signals and major trend changes on the chart using Exponential Moving Averages (EMA) and Simple Moving Averages (SMA), as well as visualizing Golden Cross and Death Cross events. The script also includes a volume indicator to highlight the volume trading activity in relation to the price movements.
Key Features:
1. Moving Averages:
EMA 21: Exponential Moving Average over a 21-period, shown in green.
EMA 50: Exponential Moving Average over a 50-period, shown in yellow.
SMA 50: Simple Moving Average over a 50-period, shown in red.
SMA 200: Simple Moving Average over a 200-period, shown in blue.
2. Signals:
Buy Signal: Generated when EMA 21 crosses above SMA 50, indicating a potential upward trend. Displayed with a green label below the price bar.
Sell Signal: Generated when EMA 21 crosses below SMA 50, indicating a potential downward trend. Displayed with a red label above the price bar.
3. Golden Cross (Bullish Trend):
A Golden Cross occurs when EMA 50 crosses above SMA 200, which often signals the start of a long-term upward trend. The signal is displayed with a yellow label below the price bar.
4. Death Cross (Bearish Trend):
A Death Cross occurs when EMA 50 crosses below SMA 200, which often signals the start of a long-term downward trend. The signal is displayed with a blue label above the price bar.
5. Volume Indicator:
The volume is plotted as colored columns. Green indicates higher volume than the 20-period moving average, and red indicates lower volume.
A Volume Moving Average (SMA 20) is also plotted to compare volume changes over time.
How the Script Works:
1. The EMA and SMA lines are plotted on the chart, providing a visual representation of the short- and long-term trends.
2. Buy/Sell signals are triggered based on the crossover between EMA 21 and SMA 50, helping to identify potential entry and exit points.
3. The Golden Cross and Death Cross indicators highlight major trend reversals based on the crossover between EMA 50 and SMA 200, providing clear visual cues for long-term trend changes.
4. Volume is displayed alongside price movements, offering insight into the strength or weakness of a trend.
Key Customizations:
Moving Average Periods: Users can modify the lengths of the EMAs and SMAs for customized analysis.
Volume Moving Average Period: The script allows for adjustment of the volume moving average period to suit different market conditions.
Signal Visibility: The size and color of the buy, sell, Golden Cross, and Death Cross signals can be easily customized to make them more prominent on the chart.
Conclusion:
This script is ideal for traders looking to combine price action with volume analysis, using key technical indicators such as EMA, SMA, Golden Cross, and Death Cross to make informed decisions in trending markets.
---
This explanation covers all aspects of the script and provides a clear understanding of its functionality, which is helpful for sharing the script or using it as an educational resource.

Weighted Multi-Mode Oscillator [BackQuant]Weighted Multi‑Mode Oscillator
1. What Is It?
The Weighted Multi‑Mode Oscillator (WMMO) is a next‑generation momentum tool that turns a dynamically‑weighted moving average into a 0‑100 bounded oscillator.
It lets you decide how each bar is weighted (by volume, volatility, momentum or a hybrid blend) and how the result is normalised (Percentile, Z‑Score or Min‑Max).
The outcome is a self‑adapting gauge that delivers crystal‑clear overbought / oversold zones, divergence clues and regime shifts on any market or timeframe.
2. How It Works
• Dynamic Weight Engine
▪ Volume – emphasises bars with exceptional participation.
▪ Volatility – inverse ATR weighting filters noisy spikes.
▪ Momentum – amplifies strong directional ROC bursts.
▪ Hybrid – equal‑weight blend of the three dimensions.
• Multi‑Mode Smoothing
Choose from 8 MA types (EMA, DEMA, HMA, LINREG, TEMA, RMA, SMA, WMA) plus a secondary smoothing factor to fine‑tune lag vs. responsiveness.
• Normalization Suite
▪ Percentile – rank vs. recent history (context aware).
▪ Z‑Score – standard deviations from mean (statistical extremes).
▪ Min‑Max – scale between rolling high/low (trend friendly).
3. Reading the Oscillator
Zone Default Level Interpretation
Bull > 80 Acceleration; momentum buyers in control
Neutral 20 – 80 Consolidation / no edge
Bear < 20 Exhaustion; sellers dominate
Gradient line/area automatically shades from bright green (strong bull) to deep red (strong bear).
Optional bar‑painting colours price bars the same way for rapid chart scanning.
4. Typical Use‑Cases
Trend Confirmation – Set Weight = Hybrid, Smoothing = EMA. Enter pullbacks only when WMMO > 50 and rising.
Mean Reversion – Weight = Volatility, reduce upper / lower bands to 70 / 30 and fade extremes.
Volume Pulse – Intraday futures: Weight = Volume to catch participation surges before breakout candles.
Divergence Spotting – Compare price highs/lows to WMMO peaks for early reversal clues.
5. Inputs & Styling
Calculation: Source, MA Length, MA Type, Smoothing
Weighting: Volume period & factor, Volatility length, Momentum period
Normalisation: Method, Look‑back, Upper / Lower thresholds
Display: Gradient fills, Threshold lines, Bar‑colouring toggle, Line width & colours
All thresholds, colours and fills are fully customisable inside the settings panel.
6. Built‑In Alerts
WMMO Long – oscillator crosses up through upper threshold.
WMMO Short – oscillator crosses down through lower threshold.
Attach them once and receive push / e‑mail notifications the moment momentum flips.
7. Best Practices
Percentile mode is self‑adaptive and works well across assets; Z‑Score excels in ranges; Min‑Max shines in persistent trends.
Very short MA lengths (< 10) may produce jitter; compensate with higher “Smoothing” or longer look‑backs.
Pair WMMO with structure‑based tools (S/R, trend lines) for higher‑probability trade confluence.
Disclaimer
This script is provided for educational purposes only. It is not financial advice. Always back‑test thoroughly and manage risk before trading live capital.

Big Trade % Heatmap### Big Trade % Heatmap
**Quick overview**
This indicator highlights where “whale” activity is clustered by showing what fraction of the recent candles contained *large‑value trades*. A candle is considered “big” when its notional volume (`volume × close`) exceeds your chosen USD threshold. You instantly see:
* **Percent of big candles** in the last *N* bars, refreshed at the cadence you pick.
* **On‑chart labels & markers** every refresh, so the chart stays clean.
* **Optional heat‑map background** that turns orange (>20 %) or green (>50 %) when big‑trade concentration spikes.
* **Ready‑made alert** when big‑trade dominance crosses 50 %.
---
#### How it works
1. **Trade size per candle** – Calculates `close × volume` to estimate dollars traded.
2. **Threshold filter** – Flags candles whose value is above *Big Trade Threshold (\$)*.
3. **Look‑back window** – Counts what percentage of the last *Lookback Window (X Candles)* were “big.”
4. **Refresh interval** – Repeats the measurement only every *Refresh Interval (Every X Candles)* to avoid label spam.
5. **Visuals** –
* A small blue ▼ above the bar + a text label such as `35.00 % > $25 000`.
* Background shading (green/orange) for quick, at‑a‑glance sentiment.
---
#### Inputs
| Input | Purpose | Default |
| -------------------------------------- | ----------------------------------------------------- | ------- |
| **Lookback Window (X Candles)** | How many recent bars to sample for the % calculation. | 20 |
| **Refresh Interval (Every X Candles)** | How often to display a new label/marker. | 5 |
| **Big Trade Threshold (\$)** | Minimum USD value for a candle to count as “big.” | 10 000 |
Tune these to the symbol and timeframe you trade (e.g., raise the threshold for BTC‑USDT 1‑h, lower it for micro‑caps).
---
#### Alerts
Enable **“High Big Trade %”** to get notified the moment more than half of the last *N* candles qualify as big trades—handy for spotting sudden accumulation or distribution.
---
#### Typical use cases
* **Breakout confirmation** – A surge in big‑trade % just before price escapes a range can validate the move.
* **Whale spotting** – Detect hidden accumulation on pullbacks or aggressive selling into rallies.
* **Filter noise** – Combine with your favorite trend indicator; only act when both align.
---
> *Built with Pine Script v6. Always back‑test before trading live; this tool is for educational purposes and not financial advice.*

Bollinger Bottom + Middle Lines with Inline TextThis script visualizes key Bollinger Band levels based on two different SMAs (20 & 50 periods), with clear labeling and a smart price table.
🔸 Features:
Draws lower and middle Bollinger Band lines for both SMA(20) and SMA(50)
Inline text at the end of each line instead of default labels (cleaner view)
A dynamic table in the top-right corner, sorted from highest to lowest level
Color-coded rows:
▪️ Orange → BB20 Mid & BB20 Lower
▪️ Green → BB50 Mid & BB50 Lower
Auto-updates each bar without cluttering the chart
✅ Ideal for identifying technical accumulation zones
✅ Suitable for investors using scaling-in strategies or mean-reversion logic
