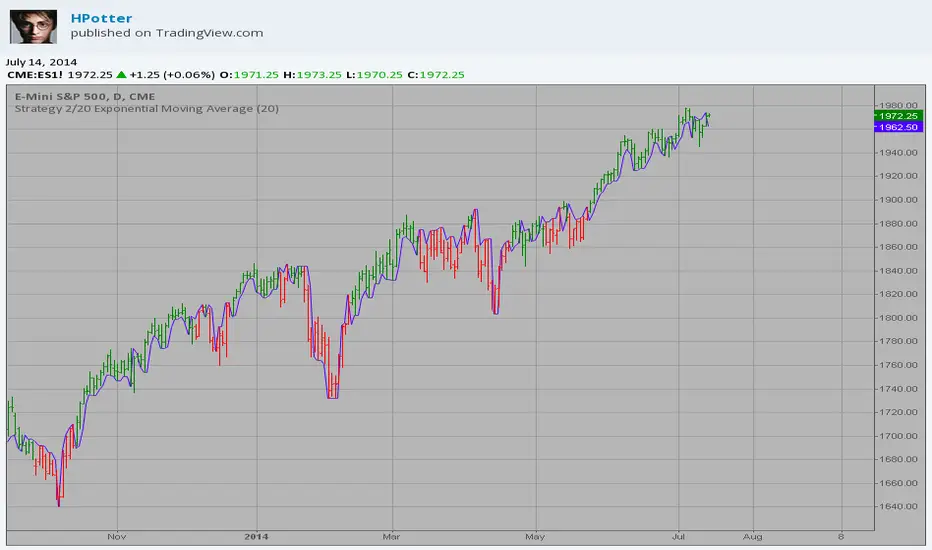
2/20 Exponential Moving Average StrategyThis indicator plots 2/20 exponential moving average. For the Mov
Avg X 2/20 Indicator, the EMA bar will be painted when the Alert criteria is met.
Please, use it only for learning or paper trading. Do not for real trading.
Cari dalam skrip untuk "20蒙古币兑换人民币"
Trend MA 20Simple to use for anyone trading a 20 length moving average.
Crossover is signaled once 20 MA crosses 1 MA at close of selected time interval.

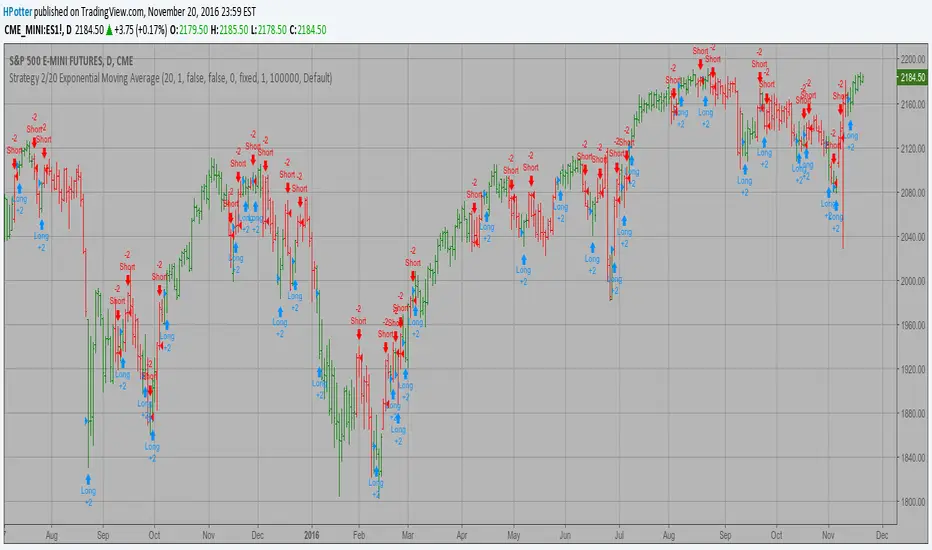
Strategy 2/20 Exponential Moving Average Strategy.
This indicator plots 2/20 exponential moving average. For the Mov
Avg X 2/20 Indicator, the EMA bar will be painted when the Alert criteria is met.
You can use in the xPrice any series: Open, High, Low, Close, HL2, HLC3, OHLC4 and ect...
2/20 Exponential Moving Average This indicator plots 2/20 exponential moving average. For the Mov
Avg X 2/20 Indicator, the EMA bar will be painted when the Alert criteria is met.
You can use in the xPrice any series: Open, High, Low, Close, HL2, HLC3, OHLC4 and ect...


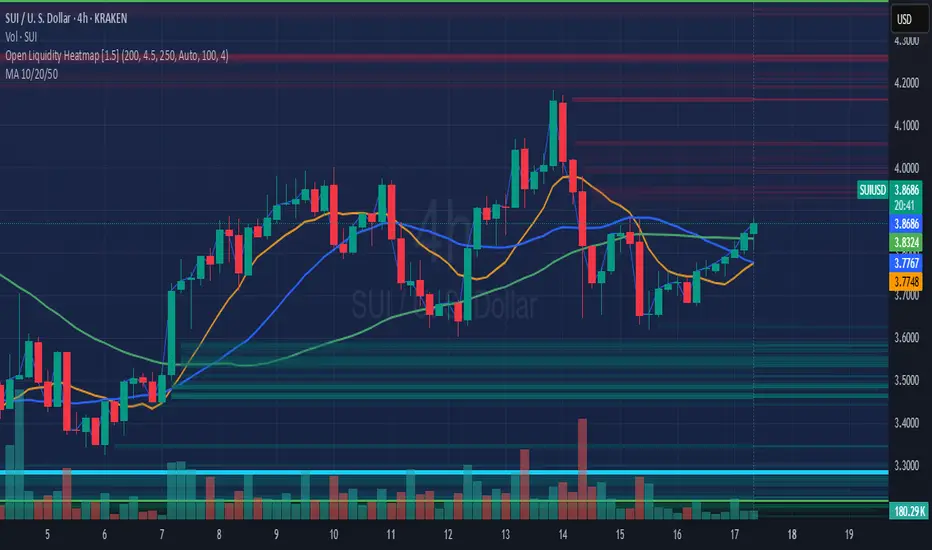
MA 10/20/50A Simple MA array including 10, 20, and 50 day.
Used primarily for determining crypto bullish or bearish technical trending primarily on the 1-day chart.
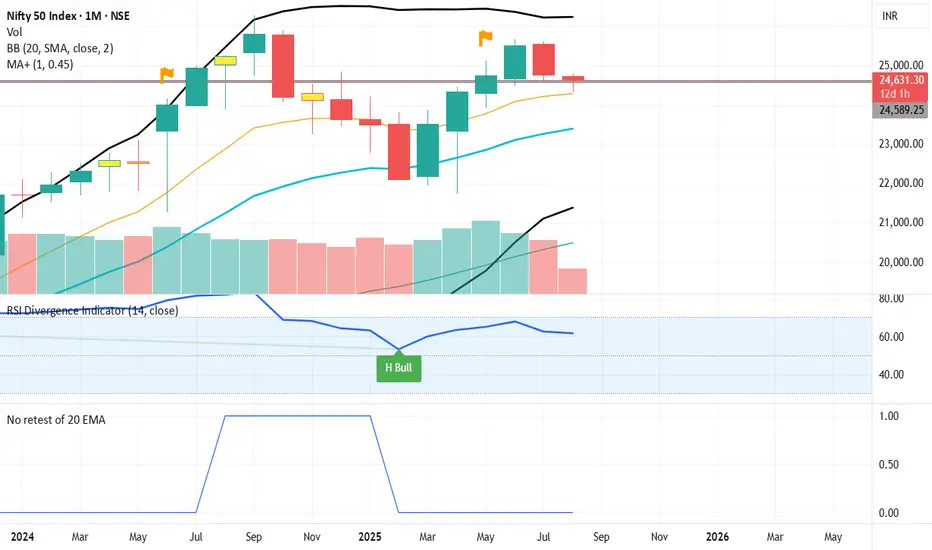
Noretest of 20 EMA since 50 dayits an indicator which represents that price is away from 20 EMA for very long interval of price movement

9 EMA & 20 EMA with Fill9 and 20 EMAs with fill to identify easily when in dynamic up trend, green when bullish, red when bearish
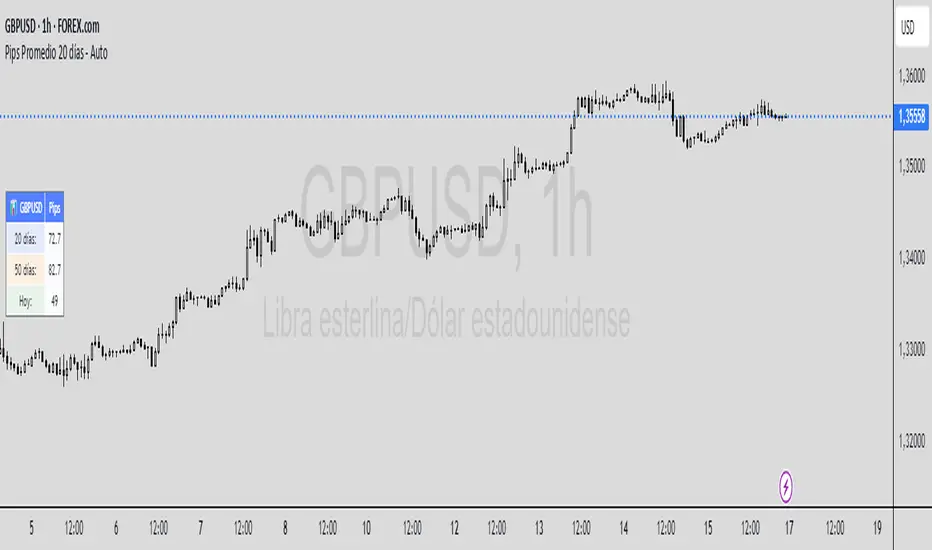
Pips Promedio 20 días - AutoEste indicador muestra la media diaria que mueve un par en pips en los ultimos 20 dias .
EMA 9, 20, 50Exponential Moving Averages of 9, 20, and 50. Used to gauge buy and sell opportunities in trending markets.
Moving Average Volume (20, 50)Shows two moving averages of volume, the 20 and 50 periods.
white bars in the background show volume, look for breaks of the target lines to confirm a breakout with volume
green shaded regions show how much higher the current volume is compared to historical volume
the greener the shade, the higher the multiple is (cap is 10x higher)
indicator is to be used with other breakout identifiers, or to help confirm the strength of a move out of an SAR level.

EMA 10/20/50/100/200plot 10, 20, 50,100,200 EMA on the chart. can be used to determine on any timeframe EMA
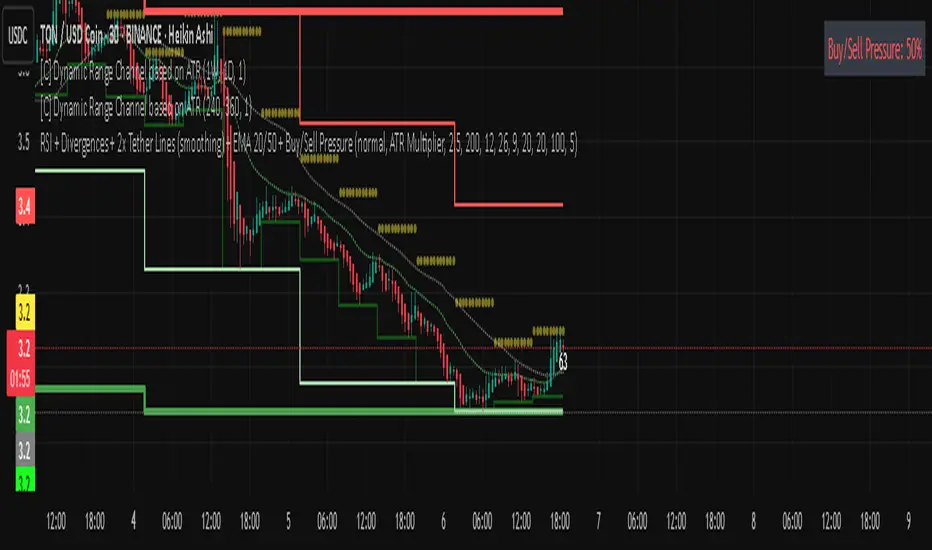
Rsi bar, divergences, tether line, ema 20,50 -Ema 20,50
-Tether Line dominance
-Buy/sell pressure
-Rsi last candle
-byu sell signal
-rsi divergence
-macd divergence
-Coloured candles 25,30 rsi and 70 rsi
Blended EMA (9 & 20)Shows EMA 9, EMA 20, and their blended average
Toggle to hide/show the original EMAs
Clean, easy to read — ideal for entry setups on lower timeframes
TOMOs EMA (9, 20, 200) & VWAPThis indicator includes the 9, 20, 200 EMAs and VWAP all in one chart. best to be used on 1m, 5m, 1D timelines.

EMA 10/20 Crossover BackgroundThis script works best on a weekly chart and it taints the background green if the EMA-10 is larger than EMA-20 (EMA lengths can be configured) and red otherwise. I use this script to immediately determine if a market is trending upwards or downwards.

EMA 10/20/60/120// This script plots four Exponential Moving Averages (10, 20, 60, 120)
// for trend-following analysis. Crossovers and the order of the EMAs can
// help identify the strength and direction of the trend.

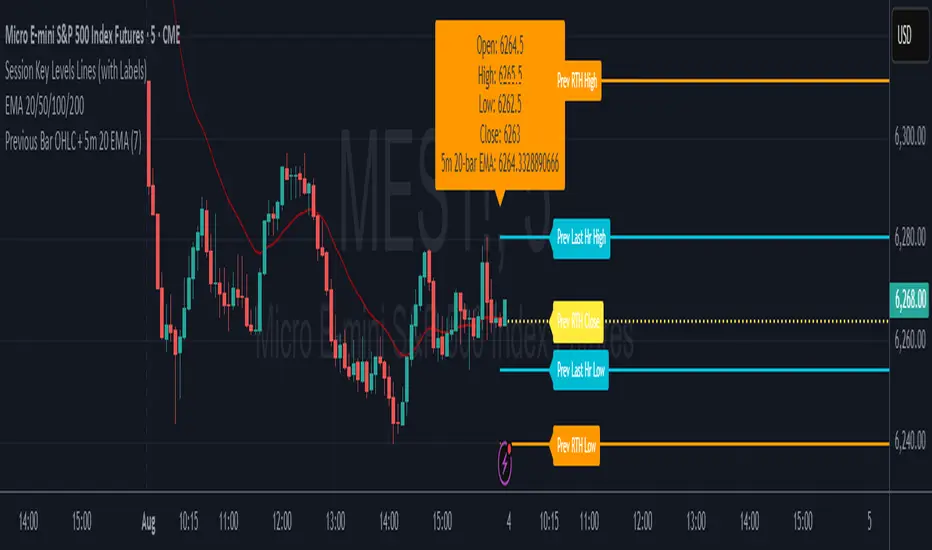
7* Previous Bar OHLC + 5m 20 EMAincreased label height for 7* Previous Bar OHLC + 5m 20 EMA. hope it helps :)
EMA 10,20 SMA 50, 200This indicator is very helpful for swing traders who plan their trades using EMAs and SMAs. It is used on the daily chart and displays the 10- and 20-EMA, as well as the 50- and 200-SMA.

EMA 20/50/200 - M3EDGE Clean Mode™The M3EDGE Clean Mode™ indicator is designed to spot the cleanest, most aligned market phases.
It filters out market noise and highlights only the high-probability trending zones where the odds are in your favor.
How it works:
• Tracks 3 key EMAs (20, 50, 200)
• Confirms directional alignment across short, medium, and long-term trends
• Colors optimal market phases to identify high-probability setups
• Optional display of the dynamic EMA50/EMA200 zone to visualize the trend’s core
Purpose:
🎯 Avoid choppy, sideways market conditions
🎯 Focus only on smooth, directional price moves
🎯 Reduce false signals and improve chart clarity
Best use cases:
• Ideal for scalping, day trading, and swing trading
• Works on all markets: indices, commodities, forex, crypto
• Perfect when combined with macro analysis and other M3EDGE™ setups
💡 Pro tip: The M3EDGE Clean Mode™ isn’t just another indicator — it’s a quality filter that keeps you out of messy conditions. When it lights up, you know the road ahead is clear.

Combo 2/20 EMA & Bandpass Filter by TamarokDescription:
This strategy combines a 2/20 exponential moving average (EMA) crossover with a custom bandpass filter to generate buy and sell signals.
Use the Fast EMA and Slow EMA inputs to adjust trend sensitivity, and the Bandpass Filter Length, Delta, and Zones to fine-tune momentum turns.
Signals occur when both EMA and BPF agree in direction, with optional reversal and time filters.
How to use:
1. Add the script to your chart in TradingView.
2. Adjust the EMA and BP Filter parameters to match your asset’s volatility.
3. Enable ‘Reverse Signals’ to trade counter-trend, or use the time filter to limit sessions.
4. Set alerts on Long Alert and Short Alert for automated notifications.
Inspiration:
Based on HPotter’s original combo strategy (Stocks & Commodities Mar 2010).
Updated to Pine Script v6 with streamlined code and alerts.
WARNING:
For purpose educate only

Previous Bar OHLC + 5m 20 EMAThis shows previous bar OHLC + 5m 20 EMA in one single text box, so you dont have to find it yourself. hope it helps :)
