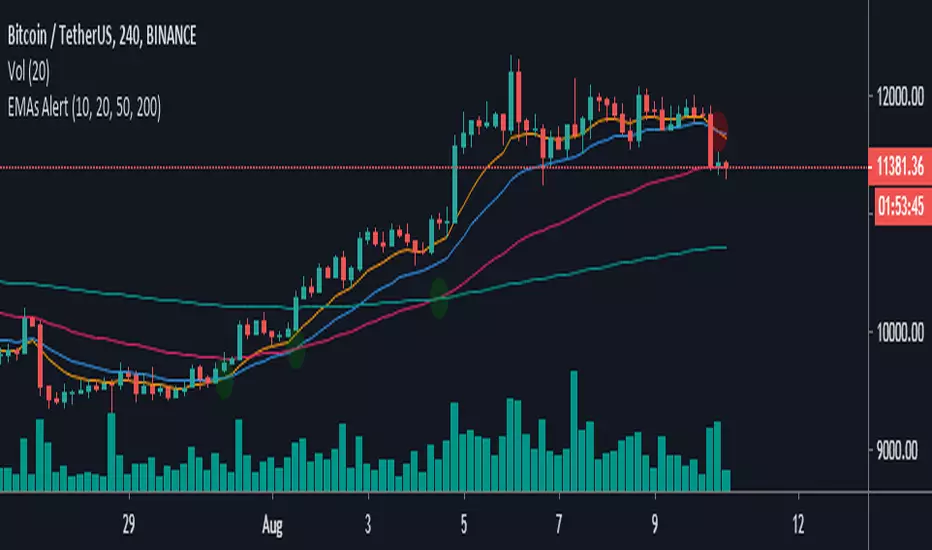
EMAs Alert-This script allows you to show the crossings of the most important emas such as 10, 20, 50 and 200
-You can modify the values of each ema you like
-Bring alerts of the crosses of each ema, which will allow you to activate this function to only the assets you want to track
Cari dalam skrip untuk "3 ema"
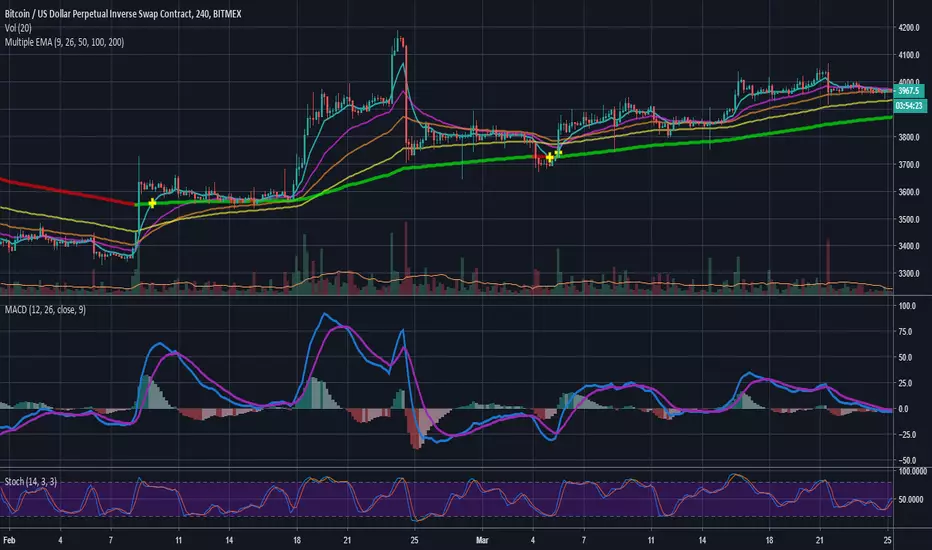
Multiple EMAMultiple EMA. Color switch of slowest EMA (def=200) when price close below or above. Trend marker when fastest EMA (def=9) cross slowest EMA (def=200).
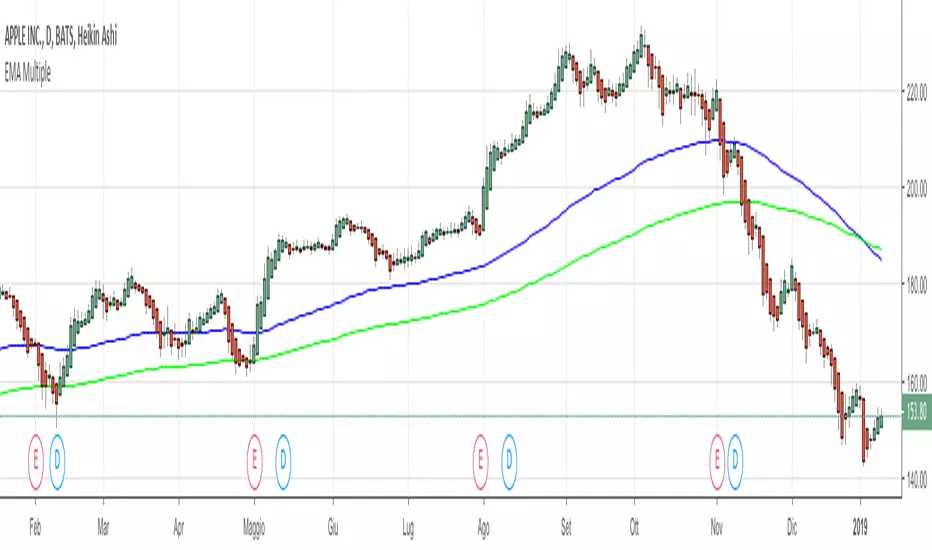
EMA MultipleUse this script to view EMA D in graph intraday or D.
You can set two different EMA (ex: 100,200) and view, for example, the values of EMA D on 5 min.
Enjoy!
6 EMA Crypto InvestidorExponential Moving Averages - 6 EMA Crypto Investidor
Indicator developed to facilitate the use of 6 EMAs in a single indicator.
EMAs: 9, 13, 21, 55, 100 and 200 Periods
Developed by Diego do Youtube Channel Crypto Investor

Simple Fibonacci EMA StrategyThis script gives a buy signal when the 21 EMA crosses above the 55 EMA and a sell signal when the 55 EMA crosses below the 21 EMA. This strategy works well for cryptocurrencies at all time frames. However, it does not work for stocks or forex. Sometimes, the simple strategies are the best strategies, especially in markets that have not been dominated by institutions.
When editing how much of your balance to trade, attach at least one decimal place. For instance, 12.0, 90.0, and 83.3 would work, but 100, 32, or 70 does not work.

Ranging EMA SpreadAn attempt at identifying ranging price behavior at EMA crossover points.
I noticed that when price consolidates that the spread between two EMAs at times will sort of fluctuate between a tight range before it breaks out.
Basically this just highlights the bars that are within a predefined EMA spread percentage range for X amount of bars.
Sometimes the crossovers just happen cleanly, but the above example sort of illustrates my idea.

Log-Space EMA Ribbon [Krypt]Similar to basic EMA Ribbon indicator except uses log-space transformation. Should be better on very long timeframes and for determining beginning of a bull market. The tradeoff is that it is slower than regular EMA near peaks (regular EMA will outperform this indicator when determining when to sell).


Multi EMA (10)Allows you to add and configure up to 10 EMAs to your chart with a single indicator. Enjoy.

50 EMA HLC Tejas50 EMA with All important sources. Made it with 50 EMA and Based on my understanding and observations.

EMA 20The EMA 20 (Exponential Moving Average 20) is a simple trend-following indicator designed to smooth price fluctuations and highlight short-term market direction.
This script plots a 20-period exponential moving average in red, allowing traders to quickly assess whether price is trading above or below the short-term trend.
When price remains above the EMA 20, it often suggests bullish strength; when price falls below it, it may indicate short-term weakness.
This indicator is minimal, clear, and useful as a foundational trend reference in any trading system.

BB Breakout + EMA Touch (50/100)Shows points only when BOTH happen on the same candle:
1️⃣ Price breaks through Bollinger Bands
2️⃣ Price touches (or crosses) EMA 50 or EMA 100

TNT TRADER EMA FANEMA fan of 8 20 50 200, very simple and straight forward with color change options.

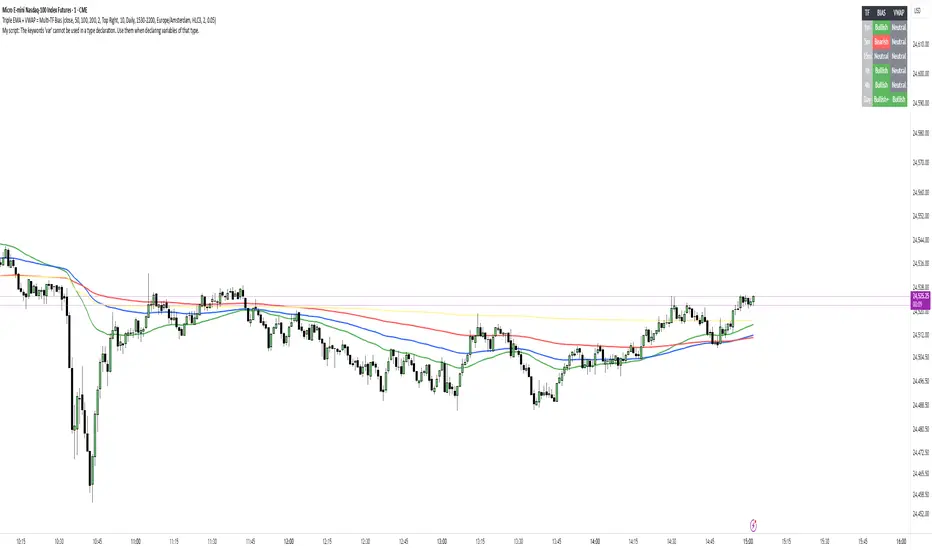
ORBs, EMAs, SMAs, AVWAPThis is an update to a previously published script. In short the difference is the added capability to adjust the length of EMAs. Also added 3 customizable SMAs. Enjoy! Let me know what you think of the script please. This is only second one I have ever done. Through practice and people like @LuxAlgo and other Pinescripters this isn't possible. Tedious hrs with ChatGPT to correct nuances, who doesnt seem to learn from (insert pronoun) mistakes
This all-in-one indicator combines key institutional tools into a unified framework for intraday and swing trading. Designed for traders who use multi-session analysis and dynamic levels, it automatically maps out global session breakouts, moving averages, and volume-weighted anchors with high clarity.
Features include:
🕓 Tokyo, London, and New York ORBs (Opening Range Breakouts) — 30-minute configurable range boxes that persist until the next New York open.
📈 Anchored VWAP with Standard Deviation Bands — dynamically anchorable to session, week, or month for institutional-grade price tracking.
📊 Exponential Moving Averages (9, 20, 113, 200) — for short-, mid-, and long-term momentum structure.
📉 Simple Moving Averages (20, 50, 100) — fully customizable lengths, colors, and visibility toggles for trend confirmation.
🏁 Prior High/Low Levels (PDH/PDL, PWH/PWL, PMH/PML) — automatically plotted from previous day, week, and month, with labels placed at each session’s midpoint.
🎛️ Session-Aligned Time Logic — all time calculations use New York session anchors with DST awareness.
💡 Clean Visualization Options — every component can be toggled on/off, recolored, or customized for your workflow.
Best used for:
ORB break-and-retest setups
VWAP and EMA rejections
Confluence-based trading around key session levels
Multi-session momentum tracking

RED RICHI EMA 34&55This indicator displays two exponential moving averages (EMA 34 & EMA 55) to identify mid-term trend direction.
It also marks crossover points with green and red circles for bullish and bearish trend shifts.

Multi-Timeframe Multi-EMA StatusMultiple changeable EMAs and Timeframes to tell you if the stock price is above or below them. Can be used on any ticker where EMAs can be used.

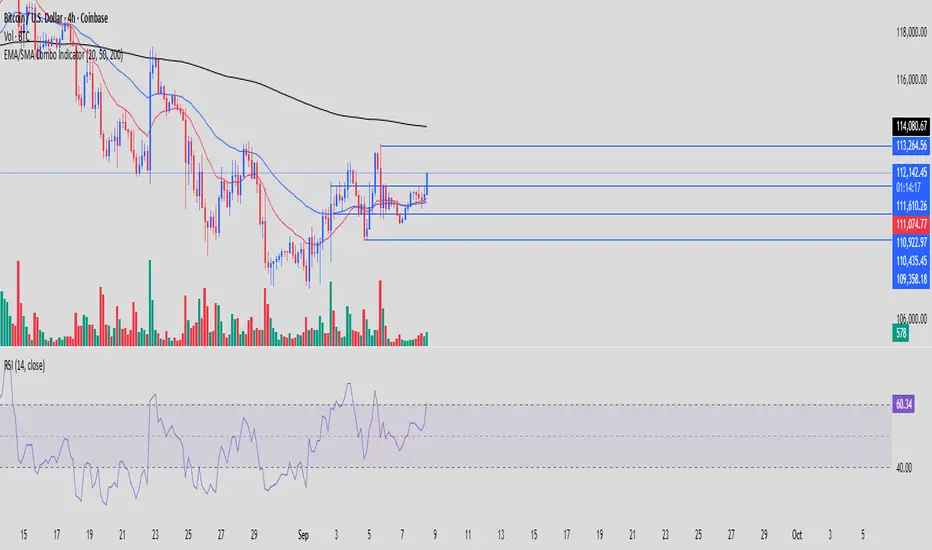
RTC EMA/SMA Combo IndicatorRTC Combo indicator with 20 EMA, 50 EMA and 200 SMA
Primarily used for Market Structure purpose
Customizable EMA 10/20/50/100Customizable EMA indicator. Fully adjustable with inputs so you can change EMA lengths and colors directly from the indicator settings panel.

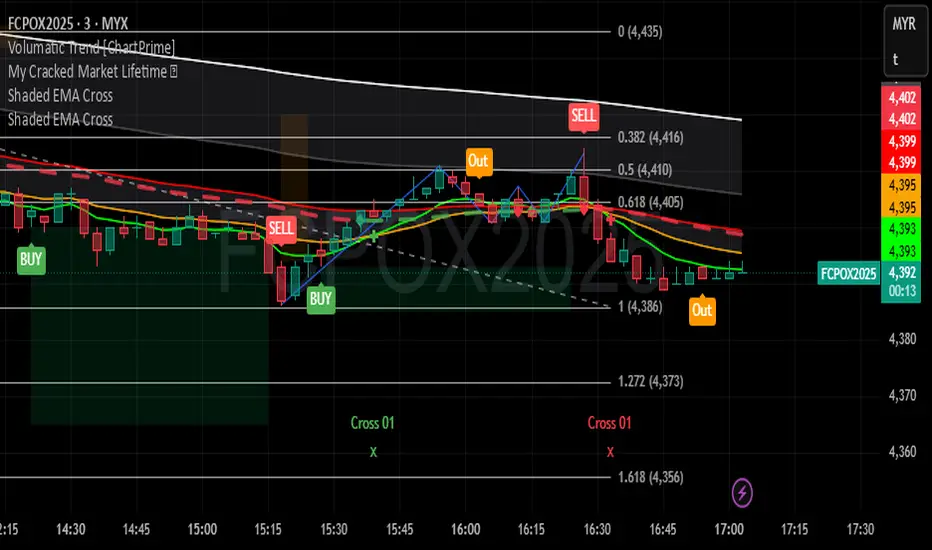
Shaded EMA CrossIndicator included 5 EMA's ( 9,20,50,100,200 ) with EMA cross marker
and shaded area between EMAs.
Shaded EMA100 and EMA200 to see market trend.
Shaded EMA20 and EMA50 to see market short trend.
Trend Filter (Higher Timeframe EMA)English (EN)
This indicator overlays the higher timeframe (default: 1H) EMA trend onto your current chart to serve as a directional filter for trading decisions.
- Fetches and plots EMA20 / EMA50 / EMA200 from a higher timeframe (user-configurable)
- Identifies LONG trend when EMA20 > EMA50 > EMA200, SHORT trend when EMA20 < EMA50 < EMA200
- Changes background color based on trend direction (Green = Long, Red = Short)
- Can trigger alerts when a new trend direction is detected
1. Apply this script to lower timeframes such as 5m or 15m charts to see the higher timeframe trend.
2. When the background is green, consider long setups; when red, consider short setups.
3. Use this as a filter in conjunction with your main entry signals, not as a standalone strategy.
- Default higher timeframe is 1 hour, but you can change it in the settings.
- This script does not provide financial advice. Use at your own risk.
日本語(JP)
このインジケーターは、現在のチャートに上位足(デフォルト:1時間足)のEMAトレンドを重ねて表示し、売買方向のフィルターとして利用できます。
【機能】
- 上位足(設定可能)のEMA20 / EMA50 / EMA200 を取得して表示
- EMA20 > EMA50 > EMA200 でロングトレンド、EMA20 < EMA50 < EMA200 でショートトレンド判定
- トレンド方向に応じて背景色を変化(緑=ロング、赤=ショート)
- トレンド発生時にアラートを送信可能
【使い方】
1. 5分足や15分足など短期足に適用し、背景色で上位足の流れを確認します。
2. 背景が緑の時は買い目線、赤の時は売り目線で短期エントリーを検討します。
3. 単独での売買判断ではなく、他のテクニカル指標と併用してご利用ください。
【注意】
- デフォルトは1時間足で計算していますが、設定から変更可能です。
- 本スクリプトは投資助言を行うものではありません。ご利用は自己責任でお願いします。

EMA Channel with ATR Offset + 2 Custom EMAsJust an alternative channel indicator to Bollinger Bands or Ketner channels that uses ATR offsets as the corridor of possible movements, which I recommend changing to fit various tickers.
Also thrown in is EMA, default is 100 and 50 periods for trend direction and potential confirmation

Custom EMAsNow the indicator includes 10 different types of EMAs, each with a changeable length and selectable type. You can use the input settings to adjust the type and length for each EMA. The plot shows all 10 EMAs on the chart.
