EMA Ribbon - low clutter, configurable [aspiers]This script improves on many of the existing EMA ribbon scripts out there:
Reduces visual clutter with shorter labels / titles, and thinner, transparent lines which don't obscure the actual price chart
Two beautiful color gradients for up and down trends
All colors and EMA periods are fully configurable, using the new input grouping / inline features
Uses Pine Script v4, which makes it more future-proof and allows new functionality, e.g.
It allow configurable period resolution, e.g. so user can fix at day resolution even when chart is being viewed at hour or minute resolution (this is the default)
Code clean-up: remove redundant ternary conditionals, improve variable names
Allow smoothing threshold for changes in trend direction to be configurable
Cari dalam skrip untuk "3 ema"

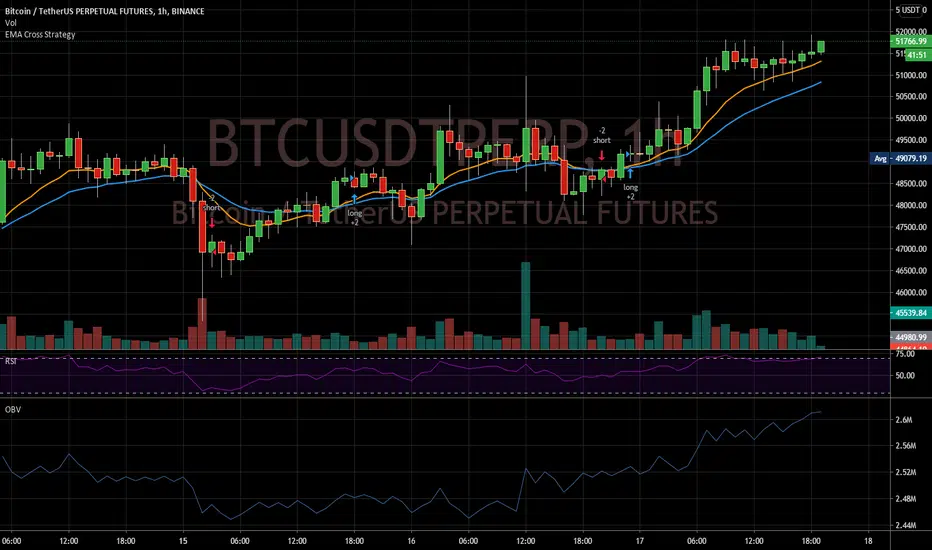
EMA Cross StrategyThis double EMA crossover strategy aims to illustrate a good strategy design.
It is currently the only published script that:
supports a proper date picker for the backtest period
is able to test in short and long mode only
EMA 20/100/200 alwaysThis script will always show the EMA 20/100/200 daily values across any time frame chart (e.g. showing daily 20 EMA while viewing the 5 minute chart)


EMAS X-FACTORindicador que nos simplifica la utilización de las EMAS 8,18 y 200 que utilizaremos para confirmar las entradas de las operaciones. Las EMAS o Medias Móviles Exponenciales nos muestra el valor medio del precio de un instrumento durante un determinado período de tiempo, es decir nos marcan la tendencia momentánea y la tendencia larga.

EMAs from higher TFPlot EMAs based on the higher timeframe.
Ex. If you're looking at 15 min chart, you'll see EMAs from H1 TF.


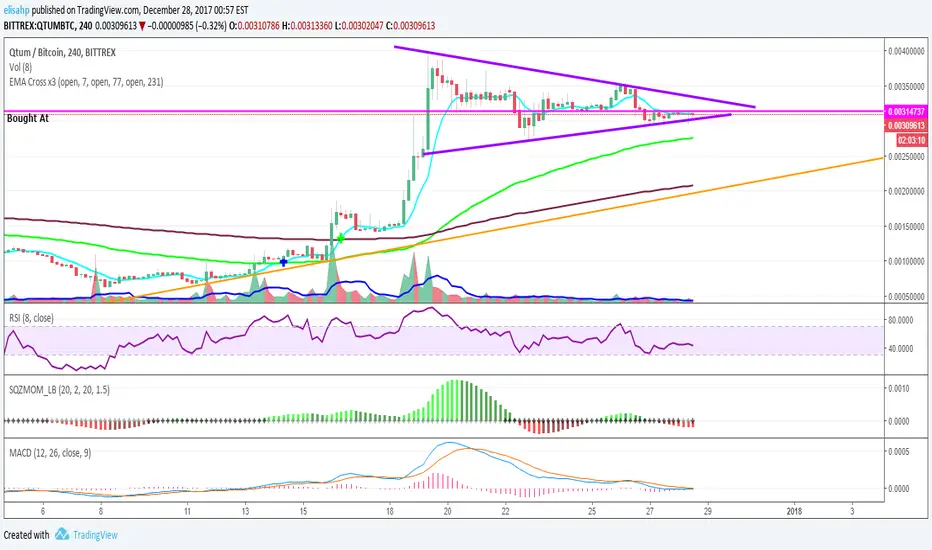
EMA Cross x3 (7, 77, 231)Exponential Moving Average at periods, 7, 77, 231. You will see a blue cross when the short EMA crosses the medium EMA, and a green cross when it crosses the long EMA.
EMA Envelope StepgainThis indicator shows a close approximation to what Gunbot would use in its GAIN and STEPGAIN strategies.
The middle two lines are the EMA(2h) and EMA(4h) lines. The inner two grey lines are BUYLVL2/SELLLVL2, the outer grey lines are just there to constrain the color bands. The green and red bands are indicators of where the candle has exceeded your setting and Gunbot would start considering buying or selling.

EMA Time-FrameThis EMA allows you to specify a time-frame for the price used to calculate the moving average. For example, you can create 1 hour EMAs on your 5 minute chart.
NOTE: This indicator only works on intraday charts. The time-frame specified for the indicator must be greater than or equal to the time-frame of the chart.


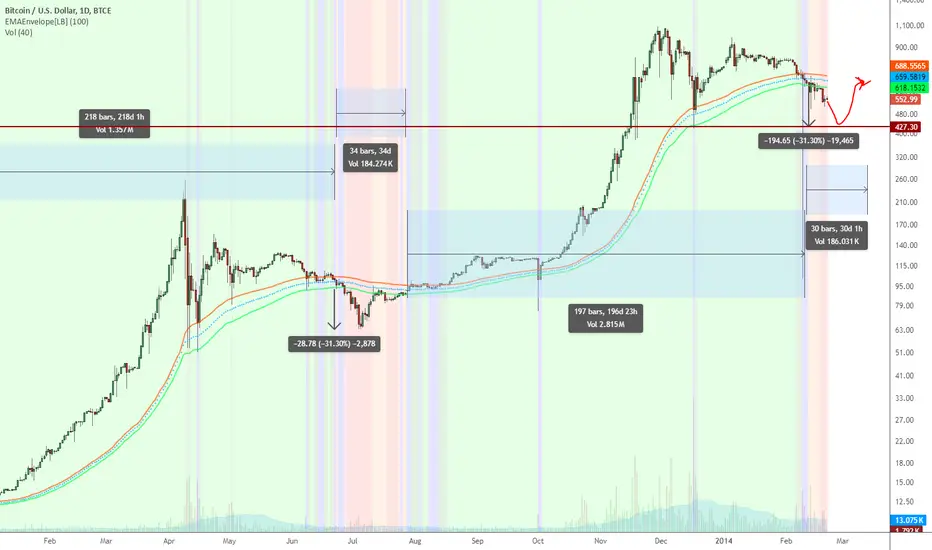
EMA Enveloper Indicator & a crazy predictionEMAEnvelope indicator does just that, draws a nice user-defined period EMA envelope (overlay).
It also can highlight the Bull/Bear breaks using different colors
- Green : High > EMA_HIGH
- Lime : (High > EMA_HIGH) and (Low > EMA_HIGH)
- Orange : Low < EMA_LOW
- Red : (Low < EMA_LOW) and (High < EMA_LOW)
Background highlighting is user-configurable.
Now to the (crazy) prediction: Based on a 100-period EMAEnvelope, we may have to go down to ~427.3 before starting turning Green. Look at the 2 Orange/Red areas highlighted.
EMA 200 tells us a different story, BTW.
EMA/SMA 350 & 111 (Day Settings) by JayEMA/SMA 350 & 111 (Day Settings) by J
Übergeordneter Trendwechsel erkennen auf High Time Frames

EMAS + SuperTrend+ Key Levels SpacemanBTC IDWMEma 200 800 supertrend and key levels.
Thanks to spaceman for making the code available.

EMA's Rainbow: 5/10/20/50/100/150/200/250All major EMA's color coded to look like a rainbow, and configurable
EMA 200 HIGH LOWS - BIRMANO - A Pine Script v6 indicator plotting a smoothed cloud between EMA 200 of high and close prices, with dynamic colors (green/soft red) based on price position. Includes RSI (14) in a subpanel for confluence, with an ATR filter to hide the cloud during high volatility.

EMA 9/21 Crossover Alert (BerryRight)This indicator gives entry signals through EMA crossover and the gives the opportunity to set up alerts. I will update this indicator with exits in the future. it's written in Pinesctipt v5

EMA SMA Ribbon IRB IndicatorUsing EMA and SMA to show support and resistance area instead of lines.
And Show Rob Hoffman's IRB indicator for choosing entry point.

EMA Slope AyEWe create our own indicator to calculate the slope of a 20 period EMA over the last candle.

EMA Slope AyEWe create our own indicator to calculate the slope of a 50 period EMA over the last 3 candles.

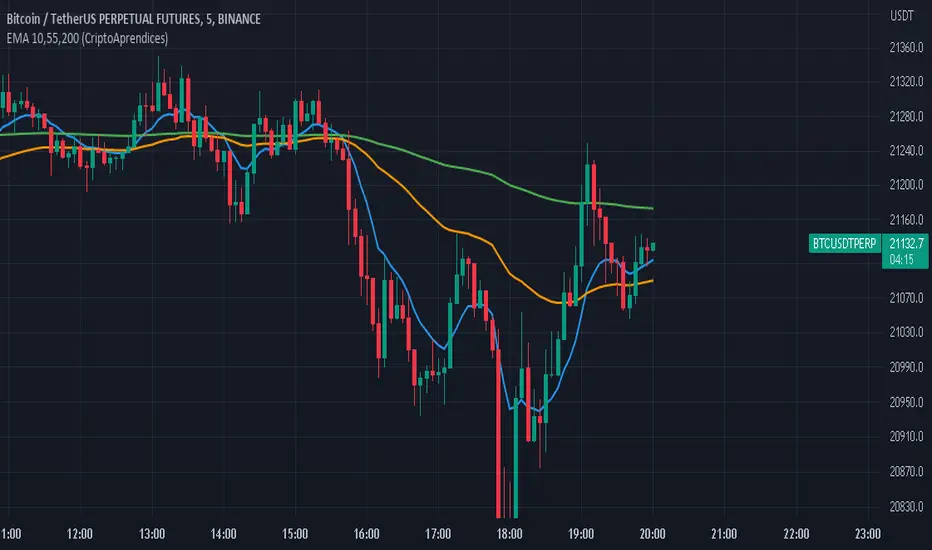
EMA 10,55,200 (CriptoAprendices) CriptoAprendices
Media Móvil Exponencial (EMA'S )de 10,55 Y 200 en Un Solo Indicador