Cari dalam skrip untuk "30年国债收益率"
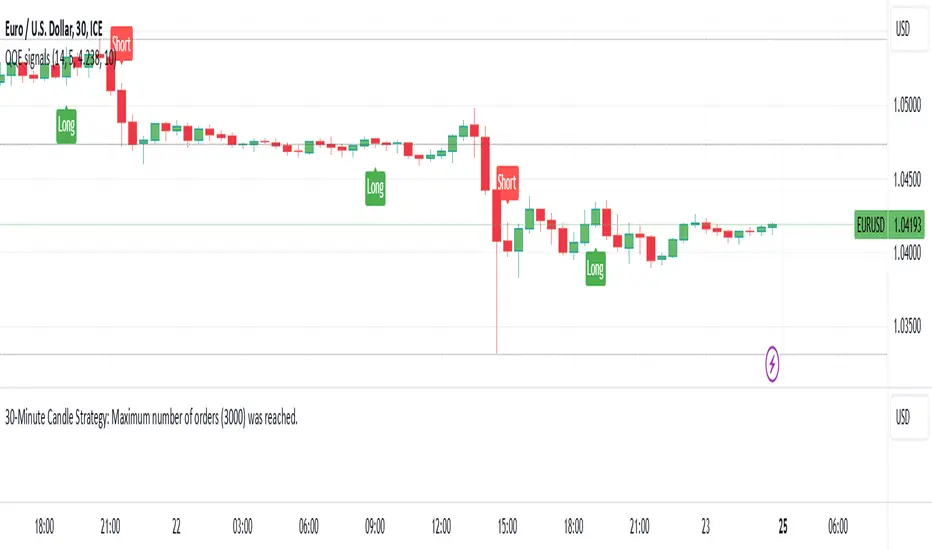
30-Minute Candle Strategy30-Minute Candle Trading Strategy
This strategy works on a 30-minute candle timeframe. When a new 30-minute candle opens, the following actions will take place based on the previous 30-minute candle's closing price:
Buy Trade Setup:
If the market opens above the previous 30-minute candle's closing price, a buy trade will be executed immediately at the market price.
The stop-loss will be set at the previous 30-minute candle's closing price.
There will be no fixed target.
The trade will be closed 1 minute before the current 30-minute candle closes, regardless of profit or loss.
Sell Trade Setup:
If a buy trade hits the stop-loss and the market moves below the previous 30-minute candle's closing price, a sell trade will be executed immediately at the market price.
The stop-loss for the sell trade will also be set at the previous 30-minute candle's closing price.
There will be no fixed target.
The trade will be closed 1 minute before the current 30-minute candle closes, regardless of profit or loss.
Procedure:
This process will repeat for every 30-minute candle.
If the market crosses the previous 30-minute candle's closing price to the upside, a buy trade will be executed, and the stop-loss will be set at the previous candle's closing price.
If the market crosses the previous 30-minute candle's closing price to the downside, a sell trade will be executed, and the stop-loss will also be set at the previous candle's closing price.
Each trade will be closed 1 minute before the current candle closes.
Key Points:
This strategy applies to every new 30-minute candle.
The stop-loss will always be based on the previous 30-minute candle's closing price.
If a stop-loss is hit, the strategy will automatically switch to the opposite trade (buy to sell or sell to buy) based on market movement crossing the previous candle's closing price.
This is a repetitive and systematic approach to trading, ensuring the rules are followed for every 30-minute candle.
30 Min Pivot Enhanced# 30 Min Pivot Enhanced
The **30 Min Pivot Enhanced** indicator detects pivot reversals and potential buy/sell signals on the 30-minute timeframe. It combines streak-based trend exhaustion with pivot breakouts and optional flush (capitulation) candle detection.
## Core Logic
- Trend streaks: pivots form after consecutive same-color candles (`trendLength`)
- Flush detection: oversized red candles (ATR based) flagged as potential exhaustion
- Pivot candidates:
- Bullish → after a red streak (or flush) followed by a green candle
- Bearish → after a green streak followed by a red candle
- Confirmation: price must break pivot high/low within `maxBarsAfterPivot`
## Inputs
- Consecutive Trend Candles → streak length required for pivot
- Maximum Bars After Pivot → confirmation window
- Show Pivot Lines → toggle pivot levels on chart
- Flush Detection → ATR-based capitulation detection
- Flush Lookback → how many bars to keep flush valid
- Enable Buy/Sell Alerts → toggle trade alerts
## Visuals
- Buy pivots → green "P Buy" labels under price
- Sell pivots → red pivot lines at lows (if enabled)
- Flush markers → optional debug labels showing capitulation bars
## Alerts
- Buy Alert → price breaks above pivot high
- Sell Alert → price breaks below pivot low
---
Best for traders watching **30-minute reversal plays**, especially where exhaustion or flush candles precede a breakout.

2:30 [LuciTech]this is a technical analysis tool designed to highlight key price levels and patterns during a specific trading window, based on UK time (Europe/London). It overlays visual elements on the chart, including a 12 PM reference line, Buy Side Liquidity (BSL) and Sell Side Liquidity (SSL) levels, a highlighted 2:30 PM candle, and Engulfing Fair Value Gaps (FVGs). This indicator is intended for traders who focus on intraday price action and liquidity zones.
Features
The 12 PM Line displays a vertical line at 12:00 PM (UK time) to mark the start of the session. It’s customizable, allowing you to enable or disable it and adjust its color.
BSL/SSL Lines track the highest high (BSL) and lowest low (SSL) from 12:00 PM to 2:00 PM (UK time). These lines extend horizontally until 3:30 PM, after which they remain static at their last recorded levels. You can customize them by enabling or disabling visibility, adjusting colors, choosing a line style (solid, dashed, or dotted), and setting the width.
The 2:30 PM Candle highlights the candle at 2:30 PM (UK time) with a distinct color. It’s customizable, with options to enable or disable it and change its color.
Engulfing FVG (Fair Value Gap) identifies bullish and bearish engulfing patterns with a gap from the prior candle’s range. It draws a shaded box over the FVG area, and you can customize it by enabling or disabling it and adjusting the box color.
How It Works
The indicator operates within a session starting at 12:00 PM (UK time). BSL/SSL levels update between 12:00 PM and 2:00 PM, with lines extending until 3:30 PM. After 3:30 PM, these lines freeze.
BSL/SSL lines show the highest price (BSL) and lowest price (SSL) reached during the 12:00 PM to 2:00 PM window. After 3:30 PM, they remain static, marking the final range boundaries.
The 2:30 PM candle emphasizes a key timestamp, often of interest to intraday traders.
Engulfing FVGs detect significant price gaps created by engulfing candles, which may indicate potential reversal or continuation zones.
Settings
12 PM Line Settings let you toggle visibility and set the line color.
BSL/SSL Line Settings allow you to toggle visibility, set BSL and SSL colors, choose a line style (Solid, Dashed, Dotted), and adjust width (1-4).
2:30 Candle Settings let you toggle visibility and set the candle color.
Engulfing FVG Settings allow you to toggle visibility and set the box color.
Interpretation
The 12 PM Line serves as a reference for the session start.
BSL/SSL Lines may act as potential support or resistance zones or highlight liquidity areas. After 3:30 PM, they remain static, showing the session’s final range.
The 2:30 PM Candle can be monitored for price action signals, such as reversals or breakouts.
Engulfing FVGs shaded areas may indicate imbalances in supply and demand, useful for identifying trade opportunities or stop-loss placement.
Notes
The timezone is set to Europe/London (UK time). Ensure your chart’s timezone aligns for accurate results.
This indicator is best used on intraday timeframes, such as 1-minute or 5-minute charts.
It provides visual aids for analysis and does not generate buy or sell signals on its own.

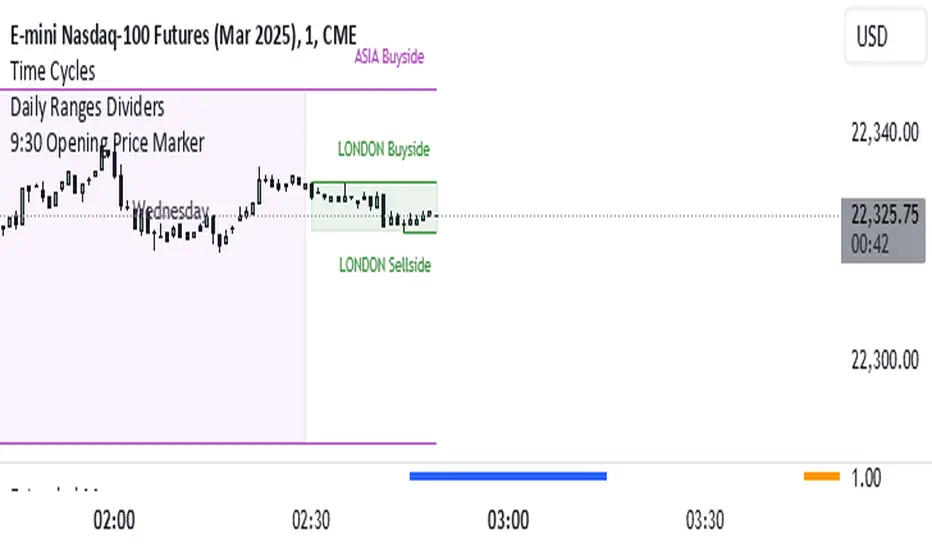
9:30 Opening Price MarkerIndicator Name: 9:30 Opening Price Marker
Description:
The "9:30 Opening Price Marker" is a custom indicator for TradingView that highlights the opening price at 9:30 AM in the UTC-4 time zone (Eastern Daylight Time) on the chart. It helps traders and analysts easily identify and track the price level at which the market opens each day.
Features:
Timezone Conversion: The indicator converts the current time to the UTC-4 timezone (Eastern Daylight Time) to accurately determine the 9:30 AM opening price.
Visual Marker: It visually marks the opening price with a dotted line on the chart, making it prominent for quick reference.
Label: Additionally, it includes a label next to the opening price line, indicating "9:30 Opening Price", enhancing clarity and usability.
Overlay: The indicator is designed to overlay on the price chart, ensuring it doesn't clutter other technical analysis tools or indicators.
Usage:
Day-to-Day Analysis: Traders can use this indicator to quickly gauge market sentiment at the daily opening, which can influence intraday trading strategies.
Reference Point: Acts as a reference point for identifying price movements and potential trading opportunities relative to the day's opening price.
Time-Specific Insights: Provides insights into price action immediately following the market open, aiding in decision-making based on early trading activity.
Installation: Copy the provided Pine Script code into TradingView's Pine Editor, save the script as an indicator, and apply it to your chart.
Disclaimer : This indicator is intended for informational purposes only and should not be solely relied upon for trading decisions. Always consider multiple sources of information and perform thorough analysis before executing trades.
9:30 AM MarkerThe 9:30 AM Market Open Marker (NYC) indicator automatically plots a vertical line at 9:30 AM New York time, marking the official U.S. stock market open for each trading day.
This visual reference helps traders quickly identify the start of the regular trading session, align intraday strategies, and analyze pre-market and post-market behavior relative to the official open.
Perfect for:
Day traders and scalpers tracking session openings.
Futures traders (e.g., ES, NQ) analyzing volatility around 9:30 AM.
Anyone studying liquidity shifts and structure transitions between pre-market and RTH (Regular Trading Hours).
Features:
Draws a clean vertical line at 9:30 AM NY time for every day.
Optional customizable color and style for clear visual separation.
Works on any timeframe and automatically adjusts for daylight-saving time.

30-Week SMA (Fixed)This indicator plots a true 30-week Simple Moving Average (SMA) on any chart, regardless of the selected timeframe.
It uses weekly candle data (via the request.security() function) to calculate the 30-week average and keeps it fixed — meaning the line remains accurate even when you switch to daily, 4-hour, or other timeframes.
The 30-week SMA is a cornerstone of Stan Weinstein’s Stage Analysis strategy, commonly used to identify major trend phases:
Above a rising SMA → bullish (Stage 2 uptrend)
Below a falling SMA → bearish (Stage 4 downtrend)
Use this indicator to maintain a consistent long-term trend filter on all timeframes

30 Second Futures Session Open RangeThis indicator displays 30 second opening ranges from Globex, Europe, and RTH sessions.
From the RTH session range, it also displays infinitely generating Price Targets based on a % of the opening range size.
I am retrieving the 30 second data using the new "request.security_lower_tf()" function.
The importance of these levels is based on the idea that when the market opens, algorithms establish their positions within the first 30 seconds.
These areas can also be seen as potential areas of support and resistance throughout the sessions.
Enjoy!

30-10-3 MAX,min dynamicsSupported timeframes: The script works only on timeframes of 1 minute or lower (including second-based timeframes).
Displayed levels: The highs and lows of the last closed candle are plotted for the 30-minute, 10-minute, and 3-minute timeframes.
Updates: The levels update only when a candle closes in the respective timeframe (e.g., every 30 minutes for the 30m levels).
Visualization: Dashed lines for highs and lows (blue for 30m, green for 10m, red for 3m).
Labels indicating "Max 30m", "Min 30m", etc., positioned above the highs and below the lows.

30-10-3 MAX,min dinamici Supported timeframes: The script works only on timeframes of 1 minute or lower (including second-based timeframes).
Displayed levels: The highs and lows of the last closed candle are plotted for the 30-minute, 10-minute, and 3-minute timeframes.
Updates: The levels update only when a candle closes in the respective timeframe (e.g., every 30 minutes for the 30m levels).
Visualization: Dashed lines for highs and lows (blue for 30m, green for 10m, red for 3m).
Labels indicating "Max 30m", "Min 30m", etc., positioned above the highs and below the lows.

5:30 AM IST Close + Offset Lines + TablesDescription:
This script captures the 5:30 AM IST close price and plots it on the chart along with dynamic offset levels above and below (±5, ±20, ±40, ±60, ±80 points). It also displays these levels in neatly organized tables at the top-right and bottom-right corners for quick reference.
🔹 Timezone: Asia/Kolkata (IST)
🔹 Useful for: Intraday traders who reference early morning levels
🔹 Visual aids:
Orange line for 5:30 AM close
Green lines for points above
Red lines for points below
Tables summarizing all levels
This tool helps identify key early-morning reference zones that can act as support/resistance or breakout targets.

30-70 RSI Strategy with Colored BarThis script colors price bars based on Relative Strength Index (RSI) levels, giving traders a quick and visual way to assess overbought or oversold market conditions directly on the chart.
📈 Key Features:
✅ RSI-Based Bar Coloring:
Green bars when RSI is above the upper threshold (default 70) – suggests bullish momentum.
Red bars when RSI is below the lower threshold (default 30) – indicates bearish pressure.
Bars remain uncolored when RSI is between thresholds – a neutral zone.
🔧 Customizable RSI Settings:
Adjustable RSI length (default: 14 periods)
Adjustable overbought/oversold levels (default: 70/30)
🧠 Helps traders:
Quickly spot potential reversals or trend continuations
Visually align price action with momentum
🛠️ Usage:
Ideal for trend-following, reversal, and momentum strategies.
Works across any timeframe (1m, 5m, 1h, daily, etc.).

30 Day HighDisplay the 30 day high on the chart, based on the highest high (as opposed to the highest close).


30s Opening Range with TargetsSimple 30 Second opening range with profit targets and adjustable fill transparency and profit targets

30, 50, 100 and 200 Day Simple Moving AveragesEasy to Use to see 30, 50, 100 and 200 Day Simple Moving Averages.

Umesh BC IST 3:30 AM Session Tracker + 4H Candles📌 IST 3:30 AM Session Tracker + 4H Candle Marker
This indicator is designed for traders who follow Indian Standard Time (IST) and want precise session tracking and 4H candle insights.
🔧 Features:
🕒 Daily Session Start at 3:30 AM IST
Automatically detects and marks the beginning of each new trading day based on 3:30 AM IST, not midnight.
Displays session Open, High, and Low lines.
Background shading for each session.
Customizable alert when a new day starts.
🟧 4H Candle Start Markers (IST Time)
Identifies every new 4-hour candle that starts at:
3:30, 7:30, 11:30, 3:30 PM, 7:30 PM, 11:30 PM IST
Adds a vertical line and label ("🟧 4H") above the candle.
Plots a dynamic line for the 4H candle's opening price.
Includes optional alert for new 4H candles.
🔔 Alerts Included:
"🕒 New IST Day Start": Triggers at 3:30 AM IST.
"🟧 New 4H Candle": Triggers at each 4H candle start (IST).
✅ Best for:
Intraday, swing, and institutional traders using IST-based analysis.
Those wanting more accurate daily sessions and clear candle structuring.

Breakout/Breakdown Indicator (30 Min Range) by InvestYourAsset👉The indicator provided here is a technical analysis indicator for TradingView users that identifies potential breakout and breakdown opportunities on the initial 30-minute range in every trading session.
👉The indicator high and low of the initial 30-minute period and plotting them as horizontal lines on the chart. The high is marked in green line and the low is marked in red line.
📈The indicator then generates buy and sell signals based on whether the current close price crosses above or below the previous 30-minute high and low, respectively.
📢The indicator also has two inputs:
👉 sessionStartHour : The hour at which the trading session begins. The default value is 9, However users can change the time according to their own trading style.
👉 sessionStartMinute : The minute at which the trading session begins. The default value is 0.
These inputs can be used to adjust the indicator to the specific trading session that you are interested in.
✅How to use the Indicator:
👉To use the 30 Minute Breakout/Breakdown Indicator, simply add it to your chart and configure the inputs to your liking. Once the indicator is added to the chart, it will plot the 30-minute high and low as horizontal lines, as well as generate buy and sell signals based on the current close price.
✅Here is a step-by-step guide:
📈Open TradingView and select the chart that you want to add the indicator to.
📈Click on the "Indicators" tab and search for "30 Minute Breakout/Breakdown Indicator by InvestYourAsset".
📈Click on the indicator to add it to your chart.
📈Configure the inputs to your liking. The default values are typically fine, but you can experiment with different values to see what works best for you.
📈Once you are satisfied with the settings, click on the "Apply" button.
📈The indicator will now be displayed on your chart. You will see two horizontal lines representing the previous 30-minute high and low, as well as triangles representing buy and sell signals.
✅How to interpret the signals:
📈Buy signal : A buy signal is generated when the current close price crosses above the previous 30-minute high. This suggests that the price is likely to continue moving higher in the short term.
📈Sell signal : A sell signal is generated when the current close price crosses below the previous 30-minute low. This suggests that the price is likely to continue moving lower in the short term.
👉Traders should remember that the present indicator is just one tool that can be used to identify potential trading opportunities. It is important to use other technical analysis tools and risk management techniques to confirm your trading signals before entering any trades.
✅Things to consider while using the indicator:
📈Look for buy signals in an uptrend and sell signals in a downtrend. This will increase the likelihood of your trades being successful.
📈Place your stop losses below the previous 30-minute low for buy signals and above the previous 30-minute high for sell signals. This will help to limit your losses if the trade goes against you.
📈Consider taking profits at key resistance and support levels. This will help you to lock in your profits and avoid giving them back to the market.
Follow us for timely updates regarding indicators that we may publish in future and give it a like if you appreciate the indicator.

ORB Breakout Traffic Signal (5/15/30)ORB Breakout Traffic Signal (5/15/30)
This indicator visualizes Opening Range Breakouts (ORB) for the first 5, 15, and 30 minutes of the US regular trading session (09:30–16:00 ET).
It provides a compact, easy-to-read traffic signal table on your chart to show whether price is breaking out, breaking down, or consolidating inside the range.
🔑 Features
Auto-anchors at 09:30 ET (converted to your local time automatically).
Tracks ORB High/Low for:
5-minute window (09:30–09:34)
15-minute window (09:30–09:44)
30-minute window (09:30–09:59)
Displays results in a compact table:
↑ (green) → price has broken above the ORB high
↓ (red) → price has broken below the ORB low
• (gray) → price remains inside the ORB range (optional; can be disabled)
Customizable:
Toggle which ORBs to show (5m, 15m, 30m)
Choose table position (top/bottom left/right)
Adjustable text size
Option to plot the ORB High/Low lines on your chart
📌 Usage
Designed for intraday traders watching US equities/ETFs/futures.
Works best on 1-minute or 5-minute charts with Extended Hours turned OFF (so the session starts exactly at 09:30 ET).
Helps you quickly spot early breakouts (5m), mid-session trends (15m), or confirmed directional moves (30m).
⚠️ Notes
Signals only update during the RTH session
Outside market hours, the last locked ORB and signal remain displayed until the next open.
This tool is for analysis/visualization only; not a buy/sell signal. Always combine with your own trading strategy and risk management.
👉 Perfect for traders who want a quick visual confirmation of whether price is breaking out of the opening range or stuck inside it.

NY 9:30-9:35 High/Low Range📘 Script Description
This script automatically identifies and plots the high and low of the 5-minute candle formed between 9:30 AM and 9:35 AM New York time, which corresponds to the opening of the U.S. equity market.
The goal is to provide a clear reference level for intraday volatility, directional bias, and breakout levels.
🔍 Function Overview
■ 1. Detects the 9:30–9:35 NY Time Candle
The script converts chart timestamps into New York session time and automatically captures the 5-minute candle that forms between:
NY 9:30:00 → NY 9:35:00
■ 2. Automatically Draws Horizontal Lines
After identifying the high and low of this candle, the script draws:
High line → Red
Low line → Blue
Lines start exactly at the 9:30 timestamp
Lines extend 3 hours into the future (until NY 12:30)
Lines do not extend beyond 3 hours (prevents unwanted diagonal lines or lines from previous days)
■ 3. Label Display at NY 20:00
The script places a label at New York 20:00, marking:
“9:30 High” for the high line
“9:30 Low” for the low line
This allows you to instantly identify the key reference levels at the end of the trading day.
■ 4. Auto-Removal at NY 20:00
At NY 20:00, both the lines and the labels are automatically deleted.
No old lines remain on the chart, ensuring clarity and accuracy for each new trading day.
🎯 Purpose and Use Cases
This script is highly useful for:
Determining intraday direction after the NY open
Tracking volatility spikes at the U.S. equity market open
Identifying breakout levels
Using high/low as dynamic support and resistance throughout the day
Understanding market context during economic events or high-impact sessions
The 9:30–9:35 range is one of the most watched price zones in global markets, often serving as the day’s initial liquidity sweep.
📝 Key Features
Accurate New York time conversion
Clean horizontal lines (no previous-day diagonal lines)
Labels positioned clearly at NY 20:00
No unnecessary visuals—simple and effective
Lightweight script with minimal chart impact

SPX +10 / -10 From 9:30 Open//@version=5
indicator("SPX +10 / -10 From 9:30 Open", overlay=true)
// Exchange Time (New York)
sess = input.session("0930-1600", "Regular Session (ET)")
// Detect session and 9:30 AM bar
inSession = time(timeframe.period, sess)
// Capture the 9:30 AM open
var float open930 = na
if inSession
// If this is the first bar of the session (9:30 AM)
if time(timeframe.period, sess) == na
open930 := open
else
open930 := na
// Calculate movement from 9:30 AM open
up10 = close >= open930 + 10
dn10 = close <= open930 - 10
// Plot reference lines
plot(open930, "9:30 AM Open", color=color.orange)
plot(open930 + 10, "+10 Level", color=color.green)
plot(open930 - 10, "-10 Level", color=color.red)
// Alert conditions
alertcondition(up10, title="SPX Up +10", message="SPX moved UP +10 from the 9:30 AM open")
alertcondition(dn10, title="SPX Down -10", message="SPX moved DOWN -10 from the 9:30 AM open")
// Plot signals on chart
plotshape(up10, title="+10 Hit", style=shape.labelup, color=color.green, text="+10", location=location.belowbar, size=size.tiny)
plotshape(dn10, title="-10 Hit", style=shape.labeldown, color=color.red, text="-10", location=location.abovebar, size=size.tiny)
