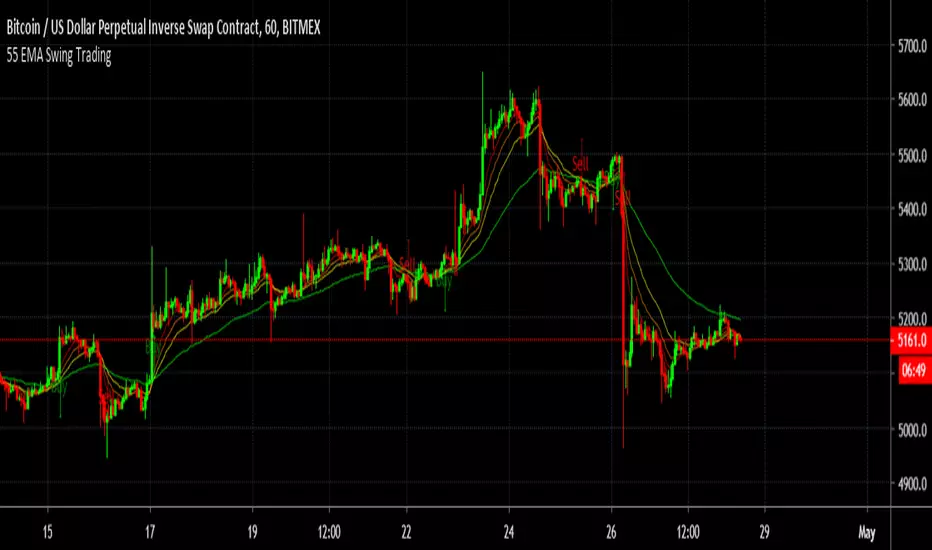
55 EMA Swing TradingA simple Buy and sell strategy using 55 EMA - " 55 EMA Swing Trading" The source code is publicly available to for further modification. Penunjuk Pine Script®oleh zysasm2262
Fiyat - 55 EMA Uzaklık SinyaliThis indicator generates a signal when the price moves a certain percentage away from the 55-period Exponential Moving Average (EMA). It helps traders identify when the market is stretched too far from its mean level, which can indicate potential reversal or continuation zones. ⚙️ How It Works Calculates the 55 EMA on the selected chart. Measures the percentage distance between the current price and the 55 EMA. When the price distance exceeds the user-defined threshold (default: 0.50%), a visual signal (orange triangle) appears on the chart. The background also highlights the signal candle. 🧩 Inputs EMA Length: Default = 55 (can be changed). Distance Threshold (%): Default = 0.50 → Change to detect stronger or weaker price deviations.Penunjuk Pine Script®oleh TrigialSystemTelah dikemas kini 7
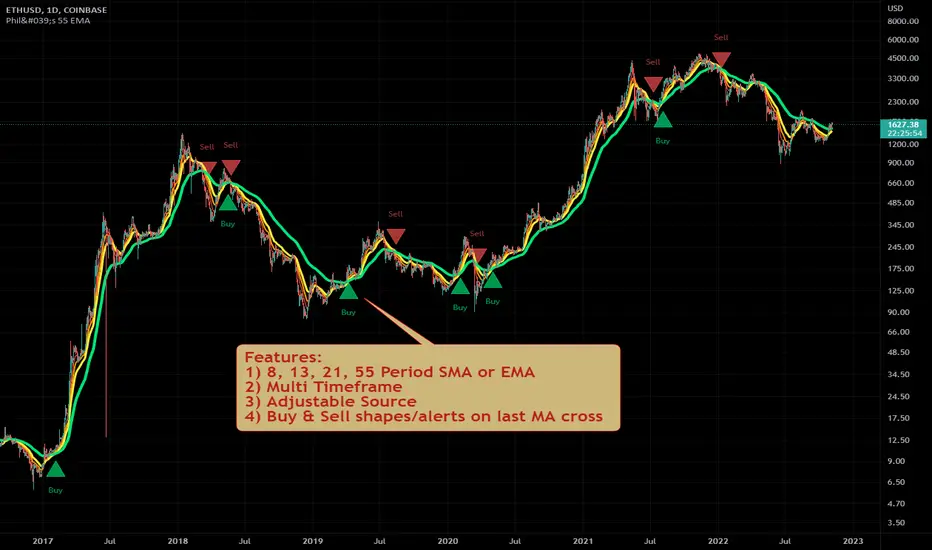
Philakone 55 EMA Swing Trading StrategyThis strategy was inspired by Philkone Crypto's "Lesson 12: Let's Learn Advanced 55 EMA Strategy" video. steemit.com Supports Buy and Sell Condition alerts and displays arrows on the chart.Penunjuk Pine Script®oleh prosum_solutionsTelah dikemas kini 1313 4 K
20 EMA / 55 EMA Cross with 50 SMMA FilterBulish Bearish indicator for the 55 ema flipping abover or below 20 ema and abover or below 50 smmaPenunjuk Pine Script®oleh jdevary322233
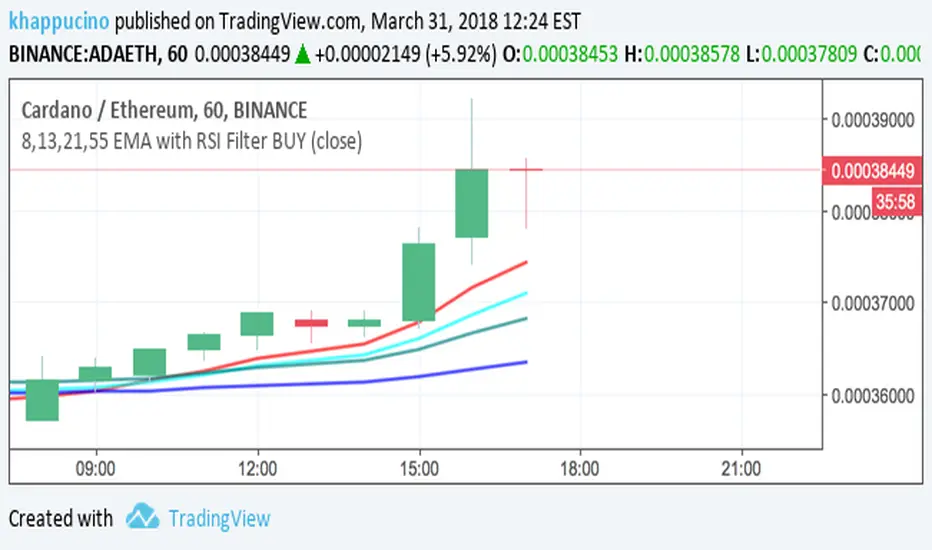
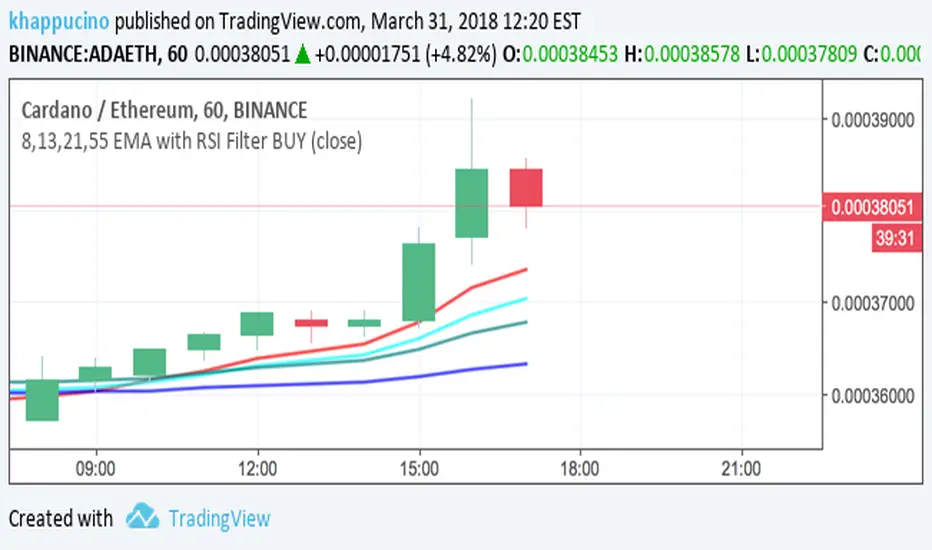
8,13,21,55 EMA with RSI Filter BUY8,13,21,55 EMA with RSI Filter BUY with alertPenunjuk Pine Script®oleh khappucino49
21 & 55 EMA CloudWhenever prices goes inside the cloud and comes out Entry: After coming out of the 21-55 EMA Cloud in uptrend Confirm with CPR and support/resistance, breakout of resistance is good sign. Stop loss is previous swing low. Success Rate will be good Penunjuk Pine Script®oleh godbless_antony785
8,13,21,55 EMA with RSI Filter BUY8,13,21,55 EMA with RSI Filter BUYPenunjuk Pine Script®oleh khappucino120
8,13,21,55 EMA with RSI Filter BUY8,13,21,55 EMA with RSI Filter BUYPenunjuk Pine Script®oleh khappucino66
RRR EMA Ignition BUY & SELL (Sideways-Proof)🔹 Description RRR EMA Ignition Buy & Sell is a trend-following, non-repainting indicator designed to capture high-probability trend ignition points while filtering out sideways market noise. Unlike basic EMA crossover systems that generate frequent false signals, this indicator uses a state-based trend engine, volatility filters, and trend strength confirmation to ensure signals appear only when a real directional move is underway. It is optimized for swing trading and positional trading on stocks and indices. 🔹 Core Logic 🔼 BUY Signal (Bullish Ignition) A BUY signal is generated only when all of the following conditions are met: EMA 21 confirms bullish regime above EMA 55 EMA 9 shows momentum above EMA 21 Price is trading above EMA 55 Candle closes bullish (confirmation) Trend strength is validated using ADX EMA 55 is sloping upward Price is sufficiently far from EMA 55 (ATR-based distance filter) Only one BUY per bullish trend leg (no repeated signals) 🔽 SELL Signal (Bearish Ignition) A SELL signal is the exact reverse of the BUY logic: EMA 21 confirms bearish regime below EMA 55 EMA 9 shows bearish momentum below EMA 21 Price is trading below EMA 55 Candle closes bearish ADX confirms trend strength EMA 55 is sloping downward ATR distance filter blocks sideways chop Only one SELL per bearish trend leg 🔹 Key Features ✅ Non-repainting (signals appear only after candle close) ✅ Sideways-market protection using ATR + ADX ✅ State-based logic (prevents repeated BUY/SELL spam) ✅ Handles strong V-reversals using trend re-arm logic ✅ Clean signals suitable for alerts and automation ✅ Works across stocks, indices, and ETFs 🔹 Best Use Cases 📈 Swing trading on Daily / 4H charts 📊 Large-cap stocks and indices (Nifty, Bank Nifty, SPX, NASDAQ) 🚫 Not intended for low-timeframe scalping 🎯 Designed for trend capture, not range trading 🔹 Recommended Settings Indian Stocks ADX Minimum: 18 ATR Multiplier: 0.6 – 0.8 US Indices ADX Minimum: 22 ATR Multiplier: 0.5 (Default settings work well for most instruments.) 🔹 How to Trade (Simple Guide) Use BUY signals to enter or add to long positions Use SELL signals to enter short positions or exit longs Combine with: Support/resistance Higher-timeframe bias Position sizing & risk management 🔹 Disclaimer This indicator is a decision-support tool, not financial advice. Always apply proper risk management and confirm signals with your own analysis.Penunjuk Pine Script®oleh RAGSTER12369
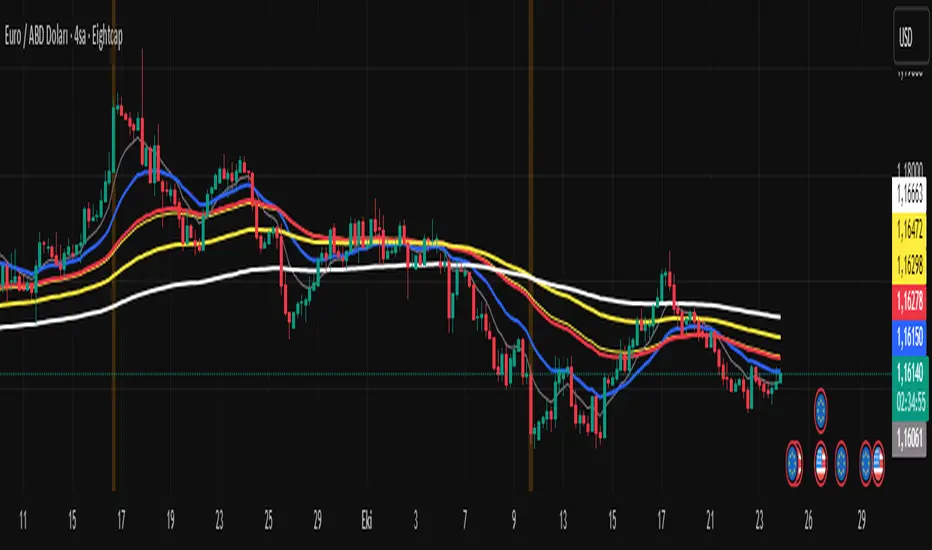
Ghost Ninja Moving Average by HassonyaThe Ghost Ninja Moving Average indicator contains three ema averages. These are ema 21, ema 55 and ema 233. The values of the averages appearing on the screen are adjusted according to their own lengths. If you want, you can change the settings from the "Numbers of bars back" setting. The 1st moving average (EMA-21) will follow the price and will disappear if the price is above it. It will only appear where needed. The 2nd moving average (EMA-55) will be red if not orange when EMA-21 is greater than EMA-55. The 3rd moving average (EMA-233) will appear if EMA-55 is greater than it, otherwise it will not. The system will also display Golden and Death crosses. I hope you will be satisfied using it. Yours sincerely. Happy Trading TÜRKÇE AÇIKLAMA Ghost Ninja Hareketli Ortalama indikatörü, üç adet ema ortalaması barındırıyor. Bunlar ema 21, ema 55 ve ema 233 tür. Ortalamaların ekranda gözükme değerleri, kendi uzunluklarına göre ayarlanmıştır. İsterseniz ayarları "Numbers of bars back" ayarından değiştirebilirsiniz. 1nci hareketli ortalama olan (EMA-21), fiyatı izleyerek eğer fiyat onun üzerindeyse gözükecek değilse yok olacak. Sadece gerektiği yerlerde gözükecek. 2nci hareketli ortalama(EMA-55), EMA-21 EMA-55'ten büyük olduğunda turuncu değilse kırmızı olacak. 3ncü hareketli ortalama(EMA-233), Eğer EMA-55 ondan büyükse gözükecek yoksa gözükmeyecek. Sistem aynı zamanda Golden ve Death crossları da gösterecek. Güle güle kullanın. Bereket bulun. SevgilerPenunjuk Pine Script®oleh Hassonya1313859
KingEMA21-55ZoneI used the moving average with the habit of 21-55, so added two moving average When the price runs above 55, it only looks for the buy signal. When the price runs below 55, it only looks for sell signals. The first step up through the 55 moving average after the first confirmation can buy homeoply, The first pull down after crossing the 55 moving average for the first time confirms that it can be sold in line with the trend. Price horizontal finishing, moving average frequently across the field observation. The yellow area in the interval from 81to 55 is the homeopathic warehouse addition signal. When the price is above the 55 moving average, the k-line closes below the 21-day moving average as a callback signal Prices below the 55 ema close above the 21 - day ema as a rebound signal After the correction and rebound signals come out, we should make half of the profit and the other half of the stop loss in the break-even place. Moving average is very suitable for the trend of strong varieties, is not suitable for volatile market. Only at the end of the shock market moving average upward or downward divergent when it is possible to be used. 1. Repeatedly entangle the mean line of horizontal disk stage and observe it from the field 2. Sell the three EMA moving averages when they can't exceed 89EMA with downward crossing 3, many times can not break the new low when prices go sideways profit 4. Buy when the price reaches 89EMA after the convergence of triangle 3 is broken 5, the Angle of price rise slowed and closed below the 21 moving average when profit 6. Left field observation during transverse oscillation. Sit tight while news or data cause prices to fall quickly 8. Buy when the price triangle breaks through the 55 moving average upward 9, the price does not rise to slow down when the horizontal closed below the 21 moving average when profit 10, price horizontal shock finishing at the same time the average line also transverse finishing field observation 11, the price of the triangle after finishing through the 89 moving average to buy.At this point all the averages have turned up 12, the second time can not break through the new high when the negative line can profit 13, the price of the first time in the same period of time through 89 after the first step back can be re-bought. 中文翻译 价格在55上面运行时时只找买入信号、 价格在55下面运行时只寻找卖出信号、 第一次向上穿过55均线后的第一次回踩确认可以顺势买入、 第一次向下穿过55均线后的第一次回抽确认可以顺势卖出、 价格横盘整理,均线频繁穿越时离场观察。 21-55区间里面黄色区域为顺势加仓信号, 价格在55均线上面时K线收盘在21天均线下面时为回调信号 价格在55均线下面时K线收盘在21天均线上面时为反弹信号 在回调和反弹信号出来之后我们应该获利一半的头寸,另外一半止损放到盈亏平衡的地方。 均线非常适合趋势性很强的品种,并不适合震荡行情。 只有在震荡行情结束时均线向上或向下发散时才有被运用的可能。 1、横盘阶段均线反复纠缠,离场观察 2、三条EMA均线向下交叉回抽无法超越55EMA时卖出 3、多次不能破新低时价格走横时获利 4、价格在3处三角形收敛被突破后站上了55EMA时买入 5、价格上涨角度变缓并收盘在21均线下面时获利 6、横盘震荡时离场观察。 7、见死不救新闻或数据导致价格快速下跌时观望 8、价格三角形向上突破时穿过55均线时买入 9、价格不升减速走横时收盘于21均线下面时获利 10、价格横盘震荡整理同时均线也横向整理时离场观察 11、价格突破三角形整理后重新穿过89均线时买入。此时所有均线已经向上翘头 12、第二次不能突破新高时收阴线可以获利 13、价格在同一个时间周期内第一次穿过89以后的第一次回踩可以重新买入 14、21-55作为牛熊的分水岭。在21-55区域之下只考虑做空,21-55之上只考虑做多。如果21-55走横则以位置决定高位倾向空低位倾向多。 15、K线会因为指标的设置自动变成两个颜色块,绿色看涨,红色看跌。做趋势看K线颜色。牛市的红色可以当成入场K熊市绿色当成入场KPenunjuk Pine Script®oleh Cn-King44252
Combined EMA, SMMA, and 60-Day Cycle Indicator V2What This Script Does: This script is designed to help traders visualize market trends and generate trading signals based on a combination of moving averages and price action. Here's a breakdown of its components and functionality: Moving Averages: EMAs (Exponential Moving Averages): These are indicators that smooth out price data to help identify trends. The script uses several EMAs: 200 EMA: A long-term trend indicator. 400 EMA: An even longer-term trend indicator. 55 EMA: A medium-term trend indicator. 89 EMA: Another medium-term trend indicator. SMMA (Smoothed Moving Average): Similar to EMAs but with different smoothing. The script calculates: 21 SMMA: Short-term smoothed average. 9 SMMA: Very short-term smoothed average. Cycle High and Low: 60-Day Cycle: The script looks back over the past 60 days to find the highest price (cycle high) and the lowest price (cycle low). These are plotted as horizontal lines on the chart. Color-Coded Clouds: Clouds: The script fills the area between certain EMAs with color-coded clouds to visually indicate trend conditions: 200 EMA vs. 400 EMA Cloud: Green when the 200 EMA is above the 400 EMA (bullish trend) and red when it’s below (bearish trend). 21 SMMA vs. 9 SMMA Cloud: Orange when the 21 SMMA is above the 9 SMMA and green when it’s below. 55 EMA vs. 89 EMA Cloud: Light green when the 55 EMA is above the 89 EMA and red when it’s below. Trading Signals: Buy Signal: This is shown when: The price crosses above the 60-day low and The EMAs indicate a bullish trend (e.g., the 200 EMA is above the 400 EMA and the 55 EMA is above the 89 EMA). Sell Signal: This is shown when: The price crosses below the 60-day high and The EMAs indicate a bearish trend (e.g., the 200 EMA is below the 400 EMA and the 55 EMA is below the 89 EMA). How It Helps Traders: Trend Visualization: The colored clouds and EMA lines help you quickly see whether the market is in a bullish or bearish phase. Trading Signals: The script provides clear visual signals (buy and sell labels) based on specific market conditions, helping you make more informed trading decisions. In summary, this script combines several tools to help identify market trends and provide buy and sell signals based on price action relative to a 60-day high/low and the positioning of moving averages. It’s a useful tool for traders looking to visualize trends and automate some aspects of their trading strategy.Penunjuk Pine Script®oleh goat-farmTelah dikemas kini 257
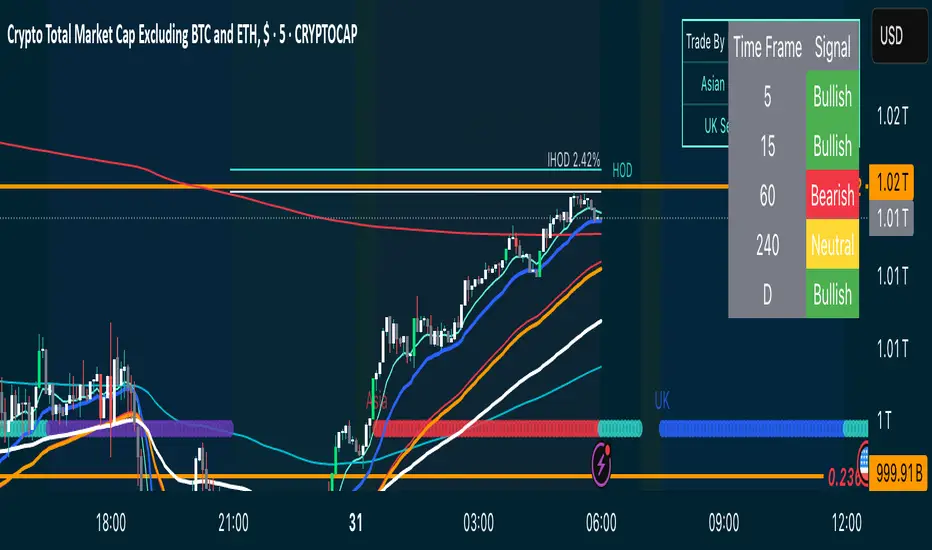
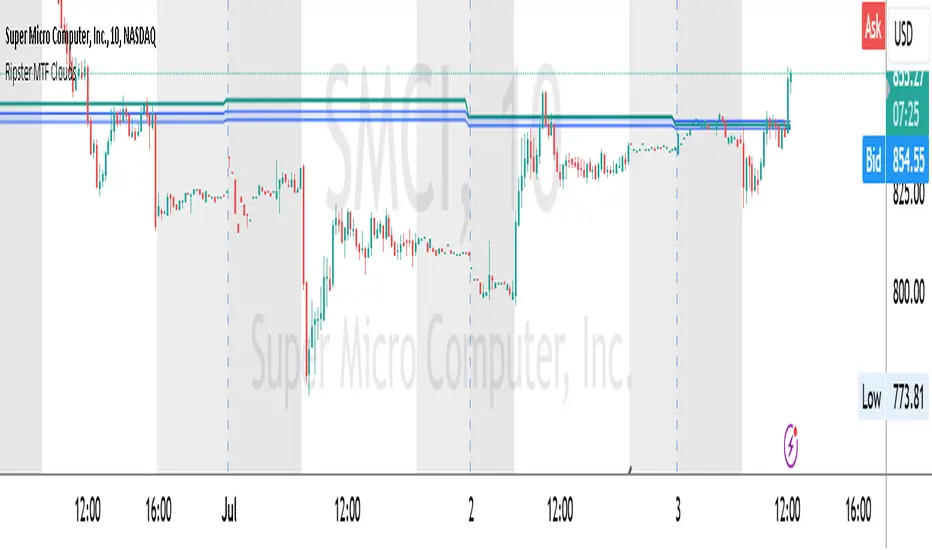
Ripster MTF CloudsDescription: MTF EMA Cloud By Ripster EMA Cloud System is a Trading System Invented by Ripster where areas are shaded between two desired EMAs. The concept implies the EMA cloud area serves as support or resistance for Intraday & Swing Trading. This can be utilized effectively on 10 Min for day trading and 1Hr/Daily for Swings. Ripster himself utilizes various combinations of the 5-12, 34-50, 8-9, 20-21 EMA clouds but the possibilities are endless to find what works best for you. “Ideally, 5-12 or 5-13 EMA cloud acts as a fluid trendline for day trades. 8-9 EMA Clouds can be used as pullback Levels –(optional). Additionally, a high level price over or under 34-50 EMA clouds confirms either bullish or bearish bias on the price action for any timeframe” – Ripster This indicator is an extension of the Ripster EMA Clouds. It allows you to visualize Exponential Moving Average (EMA) clouds from any time frame on your current chart, regardless of the chart's own time frame. This functionality is especially useful for traders who want to monitor higher time frame trends and support/resistance levels while trading on lower time frames. What does this code do? The Ripster MTF Clouds indicator displays two sets of EMA clouds. Each set consists of a short EMA and a long EMA. By default, the indicator uses Daily 20/21 and 50/55 EMAs, but you can customize these settings to fit your trading strategy. The EMAs are plotted on your chart along with their corresponding clouds, colored for easy differentiation: EMA 1 (default 50/55): Plotted in blue. EMA 2 (default 20/21): Plotted in teal. The indicator uses the security function to fetch EMA values from higher time frames and plots them on your current chart, allowing you to see how these higher time frame EMAs interact with your current time frame's price action. How to use this indicator: Adjust Resolution: Set the "Resolution" input to the time frame from which you want to fetch EMA values. For example, set it to "1H" if you want to see 1-hour EMAs on your current chart. Customize EMAs: Modify the "EMA 1 Short Length" and "EMA 1 Long Length" inputs to change the default 50/55 EMAs. Adjust the "EMA 2 Short Length" and "EMA 2 Long Length" inputs to change the default 20/21 EMAs. Monitor Clouds: The indicator fills the area between the short and long EMAs, creating a cloud that helps visualize the trend. A blue cloud indicates the area between the EMA 1 pair, while a teal cloud indicates the area between the EMA 2 pair. Use Multiple Instances: You can add multiple instances of this indicator to your chart to monitor multiple higher time frames simultaneously. For instance, one instance can show daily clouds while another shows hourly clouds. Integration with Trading Strategy: Use this indicator to identify higher time frame trends and support/resistance levels, which can help improve your trading decisions on lower time frames. For example, you can go long when the stock is above the 50-55 EMA clouds and 20-21 EMA clouds with daily resolution on a 10-minute chart and short when it is below it. Similarly, you can short a stock under the 1-hour 34/50 EMA clouds while still trading on a 10-minute chart.Penunjuk Pine Script®oleh ripster4755 1.1 K
FANBLASTERFANBLASTER Methodology & Rules (Live Trading Version) Purpose Catch the exact moment the market flips from chop into a high-conviction trending move using a clean, stacked Fib EMA ribbon + volatility + volume confirmation. Core Idea When the 5-8-13-21-34-55 EMA stack suddenly “fans out” in perfect order with significant separation, a real trend is being born. Most retail traders chase late – FANBLASTER alerts you on the very first bar the fan opens. What Triggers a “FAN BLAST” Alert Perfect EMA Alignment Bullish: 5 > 8 > 13 > 21 > 34 > 55 Bearish: 5 < 8 < 13 < 21 < 34 < 55 (Has to flip from NOT aligned on the previous bar → aligned on this bar) Significant Separation Distance between EMA 5 and EMA 55 ≥ 1.3 × ATR(14) (1.3 is the ES sweet spot – filters fake little wiggles) Trend Strength Confirmation ADX(14) ≥ 22 (Ensures the move isn’t just noise; ES trends explode while ADX is still climbing) Volume Conviction Current volume > 1.4 × 20-period EMA of volume (Real moves have real participation) When ALL FOUR conditions are true on the same bar → you get the green or red circle + phone alert. How to Trade It (Live Rules) Alert fires → look at the chart immediately If price is pulling back to the 8 or 13 EMA in the direction of the fan → enter on touch or close above/below Initial stop: opposite side of the fan (below the 55 for longs, above the 55 for shorts) Target: 2–4 R minimum, trail with the 21 or 34 once in profit No alert = stay flat. This is a “trend birth” sniper, not a scalping tool. Best Instruments & Timeframes (2025) ES & NQ futures 2 min, 5 min, 15 min (all work with the exact same settings) Works on MES/MNQ too (same params) Bottom Line FANBLASTER sits silent 90 % of the day and only screams when the market is actually about to run 20–100+ points. One alert = one high-probability trend. That’s it. Lock it, load it, and let the phone do the hunting. Good luck, stay disciplined, and stack those points. — Your edge is now live.Penunjuk Pine Script®oleh Nico_Nuvole14
Scout Regiment - D17# Scout Regiment - D17 Indicator ## English Documentation ### Overview Scout Regiment - D17 is a comprehensive TradingView indicator that combines multiple technical analysis tools into one powerful overlay indicator. It provides traders with market structure analysis, divergence detection, volume profiling, smart money concepts, and session analysis. ### Key Features #### 1. **EMA (Exponential Moving Averages)** - **Purpose**: Trend identification and dynamic support/resistance levels - **Configuration**: 13 customizable EMAs with adjustable periods - **Default Active EMAs**: EMA 3 (21), EMA 5 (55), EMA 7 (144), EMA 8 (233) - **Uses**: Identify trend direction, entry/exit points, and trend strength - **Color Coding**: Different colors for easy visual distinction #### 2. **TFMA (Timeframe Moving Averages)** - **Purpose**: Multi-timeframe trend analysis - **Features**: - 3 EMAs on higher timeframes - Dynamic labels showing trend direction - Price difference percentage display - Customizable timeframe settings - **Default Settings**: 21-period timeframe with lengths 55, 144, and 233 - **Benefits**: Align trades with higher timeframe trends #### 3. **DFMA (Daily Frame Moving Averages)** - **Purpose**: Daily timeframe perspective on any chart - **Features**: Similar to TFMA but specifically for daily analysis - **Default Timeframe**: 1D (Daily) - **Use Case**: Long-term trend confirmation and positioning #### 4. **PMA (Price Moving Averages)** - **Purpose**: Price channel analysis with filled areas - **Configuration**: 7 customizable moving averages with fill zones - **Default Lengths**: 12, 144, 169, 288, 338, 576, 676 - **Visual**: Color-filled zones between selected MAs for channel trading #### 5. **VWAP (Volume Weighted Average Price)** - **Purpose**: Institutional trading levels and fair value - **Features**: - Multiple anchor periods (Session, Week, Month, Quarter, Year, etc.) - Standard deviation bands - Corporate event anchoring (Earnings, Dividends, Splits) - **Use Case**: Identify institutional support/resistance and mean reversion opportunities #### 6. **Divergence Detector** - **Purpose**: Identify potential trend reversals - **Supported Indicators**: MACD, MACD Histogram, RSI, Stochastic, CCI, Williams %R, Bias, Momentum, OBV, SOBV, VWmacd, CMF, MFI, and external indicators - **Divergence Types**: - Regular Bullish/Bearish - Hidden Bullish/Bearish - **Features**: - Automatic divergence line drawing - Customizable detection parameters - Color-coded alerts #### 7. **Volume Profile & Node Detection** - **Purpose**: Identify key price levels based on volume distribution - **Features**: - Volume Profile with POC (Point of Control) - Value Area High (VAH) and Value Area Low (VAL) - Peak and trough volume node detection - Highest/lowest volume node highlighting - **Lookback**: Configurable (default 377 bars) - **Use Case**: Identify support/resistance zones and liquidity areas #### 8. **Smart Money Concepts** - **Purpose**: Track institutional trading patterns - **Features**: - Market Structure (BOS - Break of Structure, CHoCH - Change of Character) - Internal and Swing structures - Strong/Weak Highs and Lows - Equal Highs/Lows detection - Fair Value Gaps (FVG) - **Modes**: Historical or Present (latest only) - **Use Case**: Trade with institutional flow #### 9. **Trading Sessions** - **Purpose**: Analyze market behavior during different global sessions - **Available Sessions**: - Asian Session - Sydney, Tokyo, Shanghai, Hong Kong - European Session - London, New York, NYSE - **Features**: - Session boxes with high/low visualization - Real-time countdown timers - Volume and price change tracking - Information table with session statistics - **Customization**: Choose which sessions to display, colors, and box styles ### How to Use #### For Trend Following: 1. Enable EMAs 3, 5, 7, and 8 2. Use TFMA for higher timeframe confirmation 3. Look for price above/below key EMAs for trend direction 4. Use VWAP as additional confirmation #### For Reversal Trading: 1. Enable Divergence Detector with MACD Histogram and Bias 2. Look for divergences at key support/resistance levels 3. Confirm with Smart Money CHoCH signals 4. Use Volume Profile nodes as entry/exit targets #### For Intraday Trading: 1. Enable Trading Sessions 2. Focus on high-volume sessions (London, New York overlap) 3. Use session highs/lows as support/resistance 4. Trade Fair Value Gaps during active sessions #### For Swing Trading: 1. Use DFMA for daily trend 2. Enable PMA for channel identification 3. Look for price reactions at volume profile value areas 4. Confirm with swing structure breaks ### Best Practices 1. **Don't Overcrowd**: Enable only the components you need for your strategy 2. **Multi-Timeframe Analysis**: Always check higher timeframe TFMA/DFMA 3. **Confluence**: Look for multiple signals confirming the same direction 4. **Volume Confirmation**: Use Volume Profile to validate price action 5. **Session Awareness**: Be aware of which session is active for volatility expectations ### Performance Optimization - Disable unused features to improve chart loading speed - Use "Present Mode" for Smart Money Concepts if historical data isn't needed - Reduce Volume Profile lookback period on slower devices ### Alerts The indicator includes alert conditions for: - All divergence types (8 conditions) - Smart Money structure breaks (8 conditions) - Equal highs/lows detection - Fair Value Gaps formation --- ## 中文说明文档 ### 概述 Scout Regiment - D17 是一款综合性TradingView指标,将多个技术分析工具整合到一个强大的叠加指标中。它为交易者提供市场结构分析、背离检测、成交量分析、聪明钱概念和时区分析。 ### 核心功能 #### 1. **EMA(指数移动平均线)** - **用途**:趋势识别和动态支撑阻力位 - **配置**:13条可自定义周期的EMA - **默认启用**:EMA 3(21)、EMA 5(55)、EMA 7(144)、EMA 8(233) - **应用**:识别趋势方向、进出场点位和趋势强度 - **颜色编码**:不同颜色便于视觉区分 #### 2. **TFMA(时间框架移动平均线)** - **用途**:多时间框架趋势分析 - **特点**: - 3条更高时间框架的EMA - 显示趋势方向的动态标签 - 价格差异百分比显示 - 可自定义时间框架设置 - **默认设置**:21周期时间框架,长度为55、144和233 - **优势**:使交易与更高时间框架趋势保持一致 #### 3. **DFMA(日线框架移动平均线)** - **用途**:在任何图表上提供日线时间框架视角 - **特点**:与TFMA类似,但专门用于日线分析 - **默认时间框架**:1D(日线) - **使用场景**:长期趋势确认和定位 #### 4. **PMA(价格移动平均线)** - **用途**:价格通道分析与填充区域 - **配置**:7条可自定义的移动平均线,带填充区域 - **默认长度**:12、144、169、288、338、576、676 - **视觉效果**:选定MA之间的彩色填充区域,用于通道交易 #### 5. **VWAP(成交量加权平均价格)** - **用途**:机构交易水平和公允价值 - **特点**: - 多个锚定周期(交易日、周、月、季度、年等) - 标准差波段 - 企业事件锚定(财报、分红、拆股) - **使用场景**:识别机构支撑阻力和均值回归机会 #### 6. **背离检测器** - **用途**:识别潜在趋势反转 - **支持指标**:MACD、MACD柱状图、RSI、随机指标、CCI、威廉指标、乖离率、动量、OBV、SOBV、VWmacd、CMF、MFI及外部指标 - **背离类型**: - 常规看涨/看跌背离 - 隐藏看涨/看跌背离 - **特点**: - 自动绘制背离连线 - 可自定义检测参数 - 颜色编码警报 #### 7. **成交量分布与节点检测** - **用途**:基于成交量分布识别关键价格水平 - **特点**: - 成交量分布图与POC(控制点) - 价值区域高点(VAH)和低点(VAL) - 峰值和低谷成交量节点检测 - 最高/最低成交量节点突出显示 - **回溯期**:可配置(默认377根K线) - **使用场景**:识别支撑阻力区域和流动性区域 #### 8. **聪明钱概念** - **用途**:追踪机构交易模式 - **特点**: - 市场结构(BOS-突破结构、CHoCH-结构转变) - 内部和摆动结构 - 强/弱高低点 - 等高/等低检测 - 公允价值缺口(FVG) - **模式**:历史模式或当前模式(仅最新) - **使用场景**:跟随机构资金流动交易 #### 9. **交易时区** - **用途**:分析不同全球时段的市场行为 - **可用时段**: - 亚洲时段 - 悉尼、东京、上海、香港 - 欧洲时段 - 伦敦、纽约、纽交所 - **特点**: - 时段方框显示高低点 - 实时倒计时 - 成交量和价格变化追踪 - 时段统计信息表格 - **自定义**:选择显示哪些时段、颜色和方框样式 ### 使用方法 #### 趋势跟随策略: 1. 启用EMA 3、5、7和8 2. 使用TFMA进行更高时间框架确认 3. 观察价格在关键EMA上方/下方确定趋势方向 4. 使用VWAP作为额外确认 #### 反转交易策略: 1. 启用背离检测器(MACD柱状图和乖离率) 2. 在关键支撑阻力位寻找背离 3. 用聪明钱CHoCH信号确认 4. 使用成交量分布节点作为进出场目标 #### 日内交易策略: 1. 启用交易时区 2. 关注高成交量时段(伦敦、纽约重叠时段) 3. 使用时段高低点作为支撑阻力 4. 在活跃时段交易公允价值缺口 #### 波段交易策略: 1. 使用DFMA确定日线趋势 2. 启用PMA识别通道 3. 观察价格在成交量分布价值区域的反应 4. 用摆动结构突破确认 ### 最佳实践 1. **避免过度拥挤**:仅启用策略所需的组件 2. **多时间框架分析**:始终检查更高时间框架的TFMA/DFMA 3. **汇合点**:寻找多个信号确认同一方向 4. **成交量确认**:使用成交量分布验证价格行为 5. **时段意识**:了解当前活跃时段以预期波动性 ### 性能优化 - 禁用未使用的功能以提高图表加载速度 - 如果不需要历史数据,对聪明钱概念使用"当前模式" - 在较慢设备上减少成交量分布回溯期 ### 警报 指标包含以下警报条件: - 所有背离类型(8个条件) - 聪明钱结构突破(8个条件) - 等高/等低检测 - 公允价值缺口形成 --- ## Technical Support For questions or issues, please refer to the TradingView community or contact the indicator creator. ## 技术支持 如有问题,请参考TradingView社区或联系指标创建者。Penunjuk Pine Script®oleh lwmxmpypTelah dikemas kini 30
EMA TrendThe purpose of this script is to identify price trends based on EMAs. The relative position of price to specific EMAs and the position of certain EMAs towards each other are used to determine the trend direction. The script is intended for investors as a tool to define a basis for further evaluation. I do not use the script as a signal generator and would not recommend doing so without the help of additional indicators. How to work with the script The major (or long term) trend direction is determined by the 144 EMA much in the same way as the 200 MA is used in other systems. If the price is above the 144 EMA we are in a long term uptrend, below we are in a long term downtrend. This is to be taken with a grain of salt though. The 144 EMA is considerably shorter than the 200 SMA and is more prone to the price fluctuating around it during periods without a strong long term trend. I recommend using this as a confirmation for the short term trend. The short term trend is derived from the position and slope of the price, the 21 EMA and the 55 EMA. If the price is above the 21 EMA, the 21 above the 55 EMA, both EMAs are sloping upwards and the distance between the two is increasing, we are talking about an uptrend (and vice versa for a downtrend). This is visualized by the color of the fill between the 144 EMA and close price. Green for uptrend, red for downtrend and no color for an undetermined trend. The EMAs used are: 21 , 34 , 55 , 89 , 144 , 233 . Most of the EMAs are at 50 transparency to appear less dominant. For orientation, the 144 EMA is bright green to indicate its general importance for the trend determination, and the 55 EMAs is not transparent mainly to be able to identify positioning when the EMAs are close together. Base time frame EMA The 144 EMA is plotted twice where one is fixed to the daily time frame (can be configured) to be able to have the 144 on different timeframes during analysis. I find this very useful to keep the focus on my main time frame while analyzing trend on lower or higher time frames. This can also be turned off. Configurability This script is less configurable than I generally like with my other scripts. The reason is that the title attribute of the plots is not dynamic, and I use the data window often to get exact values from the script to determine buy targets for pullbacks and other things. Hence, I prefer not to have random names (or no names) in there to save mental capacity. If this ever becomes available, I'll gladly add this to this script. Till then, I encourage you to take the script and adjust it to your own needs. It should be simple enough even if you are just starting out in pine. Penunjuk Pine Script®oleh AshDollmaker298
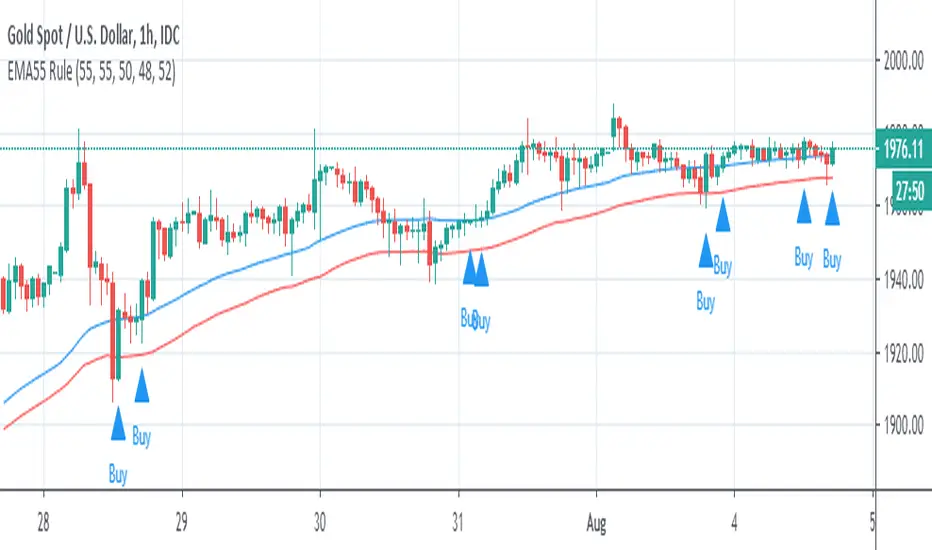
EMA55 Rule - DivineIt's base on EMA and RSI. Default Settings : EMA (H): 55 EMA (L): 55 RIS (50) OverBought: 52 OverSold: 48 Rule For Buy : Ready for BUY when it's cross above 55 EMA (Source is "High", Offset is "0"). RSI Must be amove 52 when the price is amove 55 EMA(H). Buy it. with stoploss. (Stoploss Must be previous cable's low or base on your risk capacity.) Rule For Buy : Ready for BUY when it's cross below 55 EMA (Source is "Low", Offset is "0"). RSI Must be below 48 when the price is below 55 EMA(L). SELL it. with stoploss. (Stoploss Must be previous cable's High or base on your risk capacity.) Happy Trading :) If any other modification you need, you can comment below. Thanks, Rakesh Patel (WhatsApp No : +91-09137021887)Penunjuk Pine Script®oleh rakeshp3790
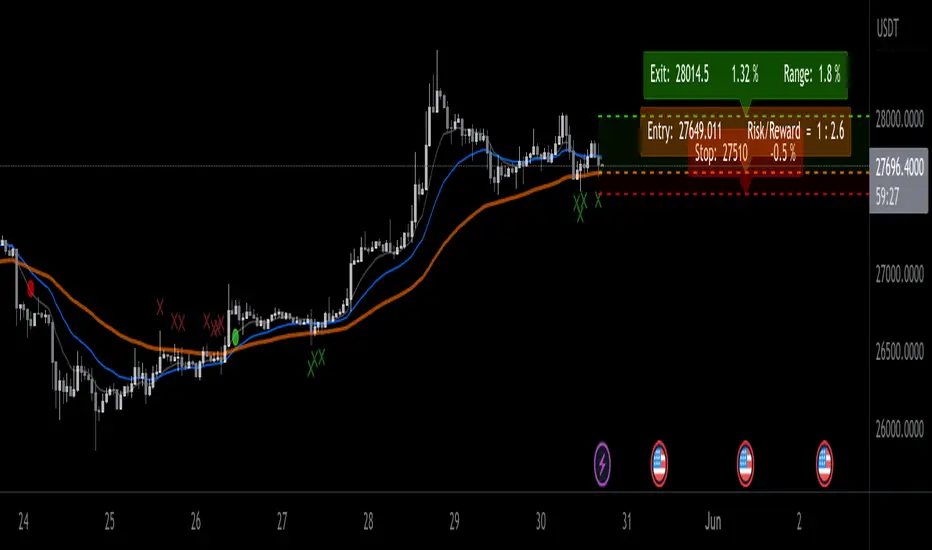
EMA ProHi Traders! This Improved EMA Cross Pro Indicator does a few things that Ease Up Our Charting. Personally it Saved me Tons of Time searching for structure highs / lows, measuring ranges and distances from my entry to stop or take profit. It's like having most of your trade in front of you, charted for you. Works Across Assets & Time Frames. The Functions 1. Signals EMA Crosses - green for Bull Cross & Red for Bear Cross 2. Signals Touches to the 55 EMA a. In a Bull Cross it will only signal touches and closes Above the 55 b. In a Bear Cross it will only signal touches and closes Under the 55 3. Plots Current Horizontals: a. The current position of the 55 b. The last High & Low 4. Calculation: a. % from the 55 to the High & Low b. Risk / Reward Ratio ("Bad Risk Management" message appears if ratio is not favorable) c. Over Range between the Low and the High 5. Labels - Current prices for all horizontals marked as Entry, Exit & Stop Notes: * This Indicator is Interchanging between bull and bear crosses, it recognizes the trend and adapts its high and low output. * You Can and Should make your personal changes. everything can be changed in the settings inputs. * You can Turn On & Off most functions in the settings inputs. BYBIT:BTCUSDT.P Penunjuk Pine Script®oleh AlexShechTelah dikemas kini 2020415
Fibonacci EMA's with Bollinger Bands [Feniks]Many Fibonacci EMAs are calculated and then tracked using custom-colored candlesticks so that your chart remains very clean. This setup is mainly used for scalping on the 2min. Feniks uses gray candlesticks and then all of the custom-colored candlesticks to know when to react to price action. WARNING: Do your own due diligence and try it out. Also, the script's default colors were determined with the chart's candlesticks being gray for both bullish/bearish candles. You'll probably have to change some of the colors to make use of the script if your chart's candlesticks are not similarly configured. The main two strategies involve the 13/55 and 21/233. The 13 EMA (blue) crosses above or below the 55 EMA (green). - 13/55 Crossover is shown by the triggering candlestick being blue. - 55/13 Crossunder is shown by the triggering candlestick being orange. - (Alerts 1/2) The 21 EMA (red) crosses above or below the 233 EMA (white). - 21/233 Crossover is shown by the triggering candlestick being green. - 233/21 Crossunder is shown by the triggering candlestick being red. - (Alerts 3/4)Penunjuk Pine Script®oleh SateriokTelah dikemas kini 41
EMA - Baby WhaleThis script will show you the 8, 13, 21, 55, 100 and 200 EMA . You can change the colors yourself if you want. You can use the EMA to define the trend. A good strategy that traders use is a 55 EMA crossover. This means that when the 8, 13 and 21 all cross the 55 EMA you place a buy or sell order. You close your position when the same thing happens on the other side. Another great way that traders use these EMA's is to spot a Golden or Death cross. When the 55 and 200 EMA cross and the 200 becomes support it means we're in a uptrend and vice versa. If you want access, just send a message please. Much love from Baby Whale!! 🙏❤️🐳Penunjuk Pine Script®oleh BabyWhale83Telah dikemas kini 1156
Easy Scalping by JayKasunBINANCE:BTCUSDTPERP This indicator can show stochastic RSI K and D line crosses and some candlestick patterns on chart. You can use this indicator to scalping, check usage for more info. Always backtest before trading with your real money. This indicator will also help mobile TradingView users to get an idea when getting stochastic RSI signals, they can use this indicator to check if stochastic RSI K and D crossed or not. ( Because they have limited area to view chart ) . 4 Exponential moving averages are there in the indicator with easy enable disable option. 9 , 21 , 55 , 100 is suggested as default values. Meanings of signs in chart Blue triangle bellow candle means it's a stochastic RSI K and D line cross in oversold level Red triangle above candle means it's a stochastic RSI K and D line cross in overbought level Green plus sign shows when EMA 50 crossover EMA 100 Red plus sign shows when EMA 50 cross bellow EMA 100 Features You can enable candlestick pattern displaying when stochastic RSI K and D cross happen. Check indicator settings. You can enable displaying ATR Trailing Stops in indicator settings. Indicator will only show blue triangle after Green plus sign and Red triangles after Red plus sign After you enable candlestick pattern option, stochastic RSI crosses with candlestick patterns will show in deferent colors. Blue triangle will turn into green and Red triangle into pink. Usage Use lower time frames like 5m or 15m After green plus sign, if price retouched 21 EMA or 55 EMA and blue triangle appeared , you can enter a long position. After red plus sign, if price retouched 21 EMA or 55 EMA and red triangle appeared , you can enter a short position. Always wait for candle close . signs of chart can be changed when candle closing. ( Does repaint until candle close ) Use ATR trailing to get a stop loss price. Use 1:1 or 1:0.5 Risk Reward ratio. Because it's scalping and lower time frame. Use more indicators like RSI to get more confirmations ( like divergences ) before entering a trade. Its more reliable. Candlestick Patterns Short names H - Hammer IH -Inverted Hammer BE - Bullish Engulfing ( green triangle ) BE - Bearish Engulfing ( pink triangle ) BH - Bullish Harami ( green triangle ) BH - Bearish Harami ( pink triangle ) I have included ATR + Trailing Stops by SimpleCryptoLife and Candlestick Patterns Identified (updated 3/11/15) by repo32 this is a combination of multiple indicators credit goes to original creators of above indicatorsPenunjuk Pine Script®oleh chnthkksnTelah dikemas kini 33169
21/55 EMA Cloud w/ Optional RibbonThis indicator behaves like a traditional EMA ribbon by using the 21, 25, 30, 35, 40, 45, 50, and 55 bar exponential moving averages. In this particular indicator, the traditional EMA ribbon lines are turned off by default leaving only a filled in area between the 21 and 55 bar averages. The filled in area is green when the 21 bar average is greater than the 55 and red otherwise. Additionally, the 9, 100, and 200 exponential moving averages are available for reference. Penunjuk Pine Script®oleh tacosontitan33805