Dynamic EMA Stack Support & ResistanceEvery trader needs reliable support and resistance — but static zones and lagging indicators won't cut it in fast-moving markets. This script combines a Fibonacci-based 5-EMA stacking system and left/right pivots that create dynamic support & resistance logic to uncover real-time structural shifts & momentum zones that actually adapt to price action. This isn’t just a mashup — it’s a complete built-from-the-ground-up support & resistance engine designed for scalpers, intraday traders, and trend followers alike.
🧠 🧠 🧠What It Does🧠 🧠 🧠
This script uses two powerful engines working in sync:
1️⃣ EMA Stack (5-EMA Framework)
Built on Fibonacci-based lengths: 5, 8, 13, 21, 34, (configurable) this stack identifies:
🔹 Bullish Stack: EMAs aligned from fastest to slowest (uptrend confirmation)
🔹 Bearish Stack: EMAs aligned inversely (downtrend confirmation)
🟡 Narrowing Zones: When EMAs compress within ATR thresholds → possible breakout or reversal zone
🎯 Labels identify key transitions like:
✅"Begin Bear Trend?"
✅"Uptrend SPRT"
✅"RES?" (resistance test)
2️⃣ Pivot-Based Projection Engine
Using classic Left/Right Bar pivot logic, the script:
📌 Detects early-stage swing highs/lows before full confirmation
📈 Projects horizontal S/R lines that adapt to market structure
🔁 Keeps lines active until a new pivot replaces them
🧩 Syncs beautifully with EMA stack for confluence zones
🎯🎯🎯Key Features for Traders🎯🎯🎯
✅ Trend Detection
→ EMA order reveals real-time bias (bullish, bearish, compression)
✅ Dynamic S/R Zones
→ Historical support/resistance levels auto-draw and extend
✅ Smart Labeling
→ “SPRT”, “RES”, and “Trend?” labels for live context + testing logic
✅ Custom Candle Coloring
→ Choose from Bar Color or Full Candle Overlay modes
✅ Scalper & Swing Compatible
→ Use fast confirmations for scalping or stack consistency for longer trends
⚙️⚙️⚙️How to Use⚙️⚙️⚙️
✅Use Top/Bottom (trend state) Line Colors to quickly read trend conditions.
✅Use Pivot-based support/resistance projections to anticipate where price might pause or reverse.
✅Watch for yellow/blue zones to prepare for volatility shifts/reversals.
✅Combine with volume or momentum indicators for added confirmation.
📐📐📐Customization Options📐📐📐
✅EMA lengths (5, 8, 13, 21, 34) — fully configurable - try 21,34,55, 89, 144 for longer term trend states
✅Left/Right bar pivot settings (default: 21/5)
✅Label size, visibility, and color themes
✅Toggle line and label visibility for clean layouts
✅“Max Bars Back” to control how deep history is scanned safely
🛠🛠🛠Built-In Safeguards🛠🛠🛠
✅ATR-based filters to stabilize compression logic
✅Guarded lookback (max_bars_back) to avoid runtime errors
✅Works on any asset, any timeframe
🏁🏁🏁Final Word🏁🏁🏁
This script is not just a visual tool, it’s a complete trend and structure framework. Whether you're looking for clean trend alignment, dynamic support/resistance, or early warning labels, this system is tuned to help you react with confidence — not hindsight.
Rembember, no single indicator should be used in isolation. For best results, combine it with price action analysis, higher-timeframe context, and complementary tools like trendlines, moving averages etc Use it as part of a well-rounded trading approach to confirm setups — not to define them alone.
💡💡💡Turn logic into clarity. Structure into trades. And uncertainty into confidence.💡💡💡
Cari dalam skrip untuk "89年属蛇运势"

HawkEye EMA Cloud
# HawkEye EMA Cloud - Enhanced Multi-Timeframe EMA Analysis
## Overview
The HawkEye EMA Cloud is an advanced technical analysis indicator that visualizes multiple Exponential Moving Average (EMA) relationships through dynamic color-coded cloud formations. This enhanced version builds upon the original Ripster EMA Clouds concept with full customization capabilities.
## Credits
**Original Author:** Ripster47 (Ripster EMA Clouds)
**Enhanced Version:** HawkEye EMA Cloud with advanced customization features
## Key Features
### 🎨 **Full Color Customization**
- Individual bullish and bearish colors for each of the 5 EMA clouds
- Customizable rising and falling colors for EMA lines
- Adjustable opacity levels (0-100%) for each cloud independently
### 📊 **Multi-Layer EMA Analysis**
- **5 Configurable EMA Cloud Pairs:**
- Cloud 1: 8/9 EMAs (default)
- Cloud 2: 5/12 EMAs (default)
- Cloud 3: 34/50 EMAs (default)
- Cloud 4: 72/89 EMAs (default)
- Cloud 5: 180/200 EMAs (default)
### ⚙️ **Advanced Customization Options**
- Toggle individual clouds on/off
- Adjustable EMA periods for all timeframes
- Optional EMA line display with color coding
- Leading period offset for cloud projection
- Choice between EMA and SMA calculations
- Configurable source data (HL2, Close, Open, etc.)
## How It Works
### Cloud Formation
Each cloud is formed by the area between two EMAs of different periods. The cloud color dynamically changes based on:
- **Bullish (Green/Custom):** When the shorter EMA is above the longer EMA
- **Bearish (Red/Custom):** When the shorter EMA is below the longer EMA
### Multiple Timeframe Analysis
The indicator provides a comprehensive view of trend strength across multiple timeframes:
- **Short-term:** Clouds 1-2 (faster EMAs)
- **Medium-term:** Cloud 3 (intermediate EMAs)
- **Long-term:** Clouds 4-5 (slower EMAs)
## Trading Applications
### Trend Identification
- **Strong Uptrend:** Multiple clouds stacked bullishly with price above
- **Strong Downtrend:** Multiple clouds stacked bearishly with price below
- **Consolidation:** Mixed cloud colors indicating sideways movement
### Entry Signals
- **Bullish Entry:** Price breaking above bearish clouds turning bullish
- **Bearish Entry:** Price breaking below bullish clouds turning bearish
- **Confluence:** Multiple cloud confirmations strengthen signal reliability
### Support/Resistance Levels
- Cloud boundaries often act as dynamic support and resistance
- Thicker clouds (higher opacity) may provide stronger S/R levels
- Multiple cloud intersections create significant price levels
## Customization Guide
### Color Schemes
Create your own visual style by customizing:
1. **Bullish/Bearish colors** for each cloud pair
2. **Rising/Falling colors** for EMA lines
3. **Opacity levels** to layer clouds effectively
### Recommended Settings
- **Day Trading:** Focus on Clouds 1-2 with higher opacity
- **Swing Trading:** Use Clouds 1-3 with moderate opacity
- **Position Trading:** Emphasize Clouds 3-5 with lower opacity
## Technical Specifications
- **Version:** Pine Script v6
- **Type:** Overlay indicator
- **Calculations:** Real-time EMA computations
- **Performance:** Optimized for all timeframes
- **Alerts:** Configurable long/short alerts available
## Risk Disclaimer
This indicator is for educational and informational purposes only. Always combine with proper risk management and additional analysis before making trading decisions. Past performance does not guarantee future results.
---
*Enhanced and customized version of the original Ripster EMA Clouds by Ripster47. This modification adds comprehensive color customization and enhanced user control while preserving the core analytical framework.*

ATAI Volume Pressure Analyzer V 1.0 — Pure Up/DownATAI Volume Pressure Analyzer V 1.0 — Pure Up/Down
Overview
Volume is a foundational tool for understanding the supply–demand balance. Classic charts show only total volume and don’t tell us what portion came from buying (Up) versus selling (Down). The ATAI Volume Pressure Analyzer fills that gap. Built on Pine Script v6, it scans a lower timeframe to estimate Up/Down volume for each host‑timeframe candle, and presents “volume pressure” in a compact HUD table that’s comparable across symbols and timeframes.
1) Architecture & Global Settings
Global Period (P, bars)
A single global input P defines the computation window. All measures—host‑TF volume moving averages and the half‑window segment sums—use this length. Default: 55.
Timeframe Handling
The core of the indicator is estimating Up/Down volume using lower‑timeframe data. You can set a custom lower timeframe, or rely on auto‑selection:
◉ Second charts → 1S
◉ Intraday → 1 minute
◉ Daily → 5 minutes
◉ Otherwise → 60 minutes
Lower TFs give more precise estimates but shorter history; higher TFs approximate buy/sell splits but provide longer history. As a rule of thumb, scan thin symbols at 5–15m, and liquid symbols at 1m.
2) Up/Down Volume & Derived Series
The script uses TradingView’s library function tvta.requestUpAndDownVolume(lowerTf) to obtain three values:
◉ Up volume (buyers)
◉ Down volume (sellers)
◉ Delta (Up − Down)
From these we define:
◉ TF_buy = |Up volume|
◉ TF_sell = |Down volume|
◉ TF_tot = TF_buy + TF_sell
◉ TF_delta = TF_buy − TF_sell
A positive TF_delta indicates buyer dominance; a negative value indicates selling pressure. To smooth noise, simple moving averages of TF_buy and TF_sell are computed over P and used as baselines.
3) Key Performance Indicators (KPIs)
Half‑window segmentation
To track momentum shifts, the P‑bar window is split in half:
◉ C→B: the older half
◉ B→A: the newer half (toward the current bar)
For each half, the script sums buy, sell, and delta. Comparing the two halves reveals strengthening/weakening pressure. Example: if AtoB_delta < CtoB_delta, recent buying pressure has faded.
[ 4) HUD (Table) Display /i]
Colors & Appearance
Two main color inputs define the theme: a primary color and a negative color (used when Δ is negative). The panel background uses a translucent version of the primary color; borders use the solid primary color. Text defaults to the primary color and flips to the negative color when a block’s Δ is negative.
Layout
The HUD is a 4×5 table updated on the last bar of each candle:
◉ Row 1 (Meta): indicator name, P length, lower TF, host TF
◉ Row 2 (Host TF): current ↑Buy, ↓Sell, ΔDelta; plus Σ total and SMA(↑/↓)
◉ Row 3 (Segments): C→B and B→A blocks with ↑/↓/Δ
◉ Rows 4–5: reserved for advanced modules (Wings, α/β, OB/OS, Top
5) Advanced Modules
5.1 Wings
“Wings” visualize volume‑driven movement over C→B (left wing) and B→A (right wing) with top/bottom lines and a filled band. Slopes are ATR‑per‑bar normalized for cross‑symbol/TF comparability and converted to angles (degrees). Coloring mirrors HUD sign logic with a near‑zero threshold (default ~3°):
◉ Both lines rising → blue (bullish)
◉ Both falling → red (bearish)
◉ Mixed/near‑zero → gray
Left wing reflects the origin of the recent move; right wing reflects the current state.
5.2 α / β at Point B
We compute the oriented angle between the two wings at the midpoint B:
β is the bottom‑arc angle; α = 360° − β is the top‑arc angle.
◉ Large α (>180°) or small β (<180°) flags meaningful imbalance.
◉ Intuition: large α suggests potential selling pressure; small β implies fragile support. HUD cells highlight these conditions.
5.3 OB/OS Spike
OverBought/OverSold (OB/OS) labels appear when directional volume spikes align with a 7‑oscillator vote (RSI, Stoch, %R, CCI, MFI, DeMarker, StochRSI).
◉ OB label (red): unusually high sell volume + enough OB votes
◉ OS label (teal): unusually high buy volume + enough OS votes
Minimum votes and sync window are user‑configurable; dotted connectors can link labels to the candle wick.
5.4 Top3 Volume Peaks
Within the P window the script ranks the top three BUY peaks (B1–B3) and top three SELL peaks (S1–S3).
◉ B1 and S1 are drawn as horizontal resistance (at B1 High) and support (at S1 Low) zones with adjustable thickness (ticks/percent/ATR).
◉ The HUD dedicates six cells to show ↑/↓/Δ for each rank, and prints the exact High (B1) and Low (S1) inline in their cells.
6) Reading the HUD — A Quick Checklist
◉ Meta: Confirm P and both timeframes (host & lower).
◉ Host TF block: Compare current ↑/↓/Δ against their SMAs.
◉ Segments: Contrast C→B vs B→A deltas to gauge momentum change.
◉ Wings: Right‑wing color/angle = now; left wing = recent origin.
◉ α / β: Look for α > 180° or β < 180° as imbalance cues.
◉ OB/OS: Note labels, color (red/teal), and the vote count.
◉Top3: Keep B1 (resistance) and S1 (support) on your radar.
Use these together to sketch scenarios and invalidation levels; never rely on a single signal in isolation.
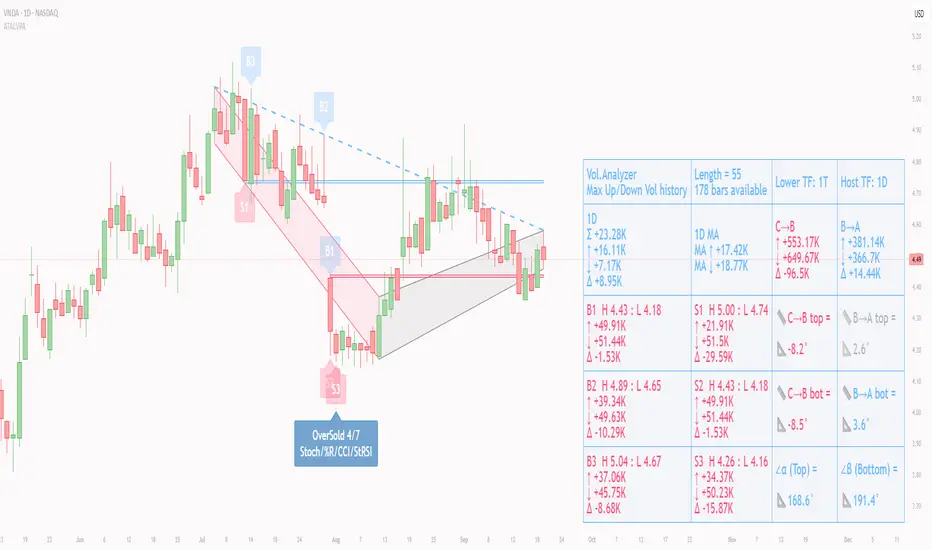
[ 7) Example Highlights (What the table conveys) /i]
◉ Row 1 shows the indicator name, the analysis length P (default 55), and both TFs used for computation and display.
◉ B1 / S1 blocks summarize each side’s peak within the window, with Δ indicating buyer/seller dominance at that peak and inline price (B1 High / S1 Low) for actionable levels.
◉ Angle cells for each wing report the top/bottom line angles vs. the horizontal, reflecting the directional posture.
◉ Ranks B2/B3 and S2/S3 extend context beyond the top peak on each side.
◉ α / β cells quantify the orientation gap at B; changes reflect shifting buyer/seller influence on trend strength.
Together these visuals often reveal whether the “wings” resemble a strong, upward‑tilted arm supported by buyer volume—but always corroborate with your broader toolkit
8) Practical Tips & Tuning
◉ Choose P by market structure. For daily charts, 34–89 bars often works well.
◉ Lower TF choice: Thin symbols → 5–15m; liquid symbols → 1m.
◉ Near‑zero angle: In noisy markets, consider 5–7° instead of 3°.
◉ OB/OS votes: Daily charts often work with 3–4 votes; lower TFs may prefer 4–5.
◉ Zone thickness: Tie B1/S1 zone thickness to ATR so it scales with volatility.
◉ Colors: Feel free to theme the primary/negative colors; keep Δ<0 mapped to the negative color for readability.
Combine with price action: Use this indicator alongside structure, trendlines, and other tools for stronger decisions.
Technical Notes
Pine Script v6.
◉ Up/Down split via TradingView/ta library call requestUpAndDownVolume(lowerTf).
◉ HUD‑first design; drawings for Wings/αβ/OBOS/Top3 align with the same sign/threshold logic used in the table.
Disclaimer: This indicator is provided solely for educational and analytical purposes. It does not constitute financial advice, nor is it a recommendation to buy or sell any security. Always conduct your own research and use multiple tools before making trading decisions.
Trend CandlesTrend Candles
Overview
The Trend Candles indicator is a simple yet effective tool designed to help traders visually identify the prevailing market trend. By combining candle coloring with a trend-based Exponential Moving Average (EMA), it enhances chart readability and makes trend-following strategies easier to apply.
Concepts
Exponential Moving Average (EMA): The EMA is a moving average that places more weight on recent price data. It reacts faster to price changes compared to a Simple Moving Average (SMA), making it well-suited for trend detection.
Trend Determination:
- If the EMA is rising (current EMA > previous EMA), the market is considered bullish.
- If the EMA is falling (current EMA < previous EMA), the market is considered bearish.
- If the EMA is flat (no significant change), no trend color is applied.
Candle Coloring:
- Green candles = Uptrend
- Purple candles = Downtrend
- Default candles = Sideways/Flat EMA
Features
- Trend Visualization: Candles automatically change color based on EMA slope, making it easy to spot bullish and bearish phases.
- Customizable EMA Length: The trader can set the EMA period (default is 50), allowing flexibility for short-term or long-term trend analysis.
- Overlay EMA Line: An orange EMA line is plotted on the chart for additional confirmation of the trend.
- Clean & Minimalist: Focuses on trend clarity without cluttering the chart with unnecessary signals.
How to Use
1. Apply the indicator to your chart.
2. Adjust the EMA Length as per your trading style (shorter = faster signals, longer = smoother trend).
3. Follow the candle color:
- Green = Favor long entries.
- Purple = Favor short entries.
- No color = Stay cautious, as trend is unclear.
4. Use with other confirmation tools (support/resistance, volume, or oscillators).
5. Users are encouraged to experiment with different EMA lengths. The default length is 50, but you can explore other values based on your needs. In particular, try Fibonacci numbers such as 13, 21, 34, 55, 89, 144, and 233 to observe how trends behave differently.
Disclaimer
The information provided by the Trend Candles indicator is for educational purposes only. It should not be considered financial advice. Trading involves substantial risk, and past performance is not necessarily indicative of future results. Always do your own research and use risk management practices.

VWAP Suite {Phanchai}VWAP Suite {Phanchai}
Compact, readable, TradingView-friendly.
What is VWAP?
The Volume Weighted Average Price (VWAP) is the average price of a period weighted by traded volume. It’s used as a fair-value reference (mean) and resets at the start of each new period.
Included VWAP Modes
Session — resets each trading day (current session).
Week / Month / Quarter / Year — current calendar periods.
Anchored Week / Month / Quarter / Year — starts at the beginning of the previous completed period.
Rolling 7D / 30D / 90D — rolling windows: today + last 6/29/89 daily sessions.
Important
This suite does not generate buy/sell signals. It provides structure and confluence; decisions remain yours.
Use Cases
Identify fair-value zones / mean-reversion areas.
Plan TP / SL around periodic VWAPs.
Define DCA levels (e.g., anchored to prior week/month).
Gauge trend bias via VWAP slope and reactions.
How to Use
Inputs → VWAP 1..5: Choose the period per slot (Session, Anchored, Rolling, etc.) and toggle Show .
Sources: Select the price source for all VWAPs (default: HLC3).
Global: Line offset (bars) shifts plots visually (does not affect calculations).
Style tab: Adjust per-line colors, thickness, and line style.
Alerts
Price crosses a VWAP (per slot).
VWAP slope turns UP or DOWN (per slot).
Tips & Notes
Volume required: Poor/absent volume (e.g., some FX tickers) can degrade accuracy.
Anchored modes: Start at the prior period’s open; values appear only after that timestamp.
Rolling modes: Use completed daily sessions (including today).
Clutter control: If labels crowd, increase Line offset or hide unneeded slots.
Confluence: Combine with market structure, liquidity zones, or momentum filters for stronger context.
Built for clear VWAP workflows. Trade safe!

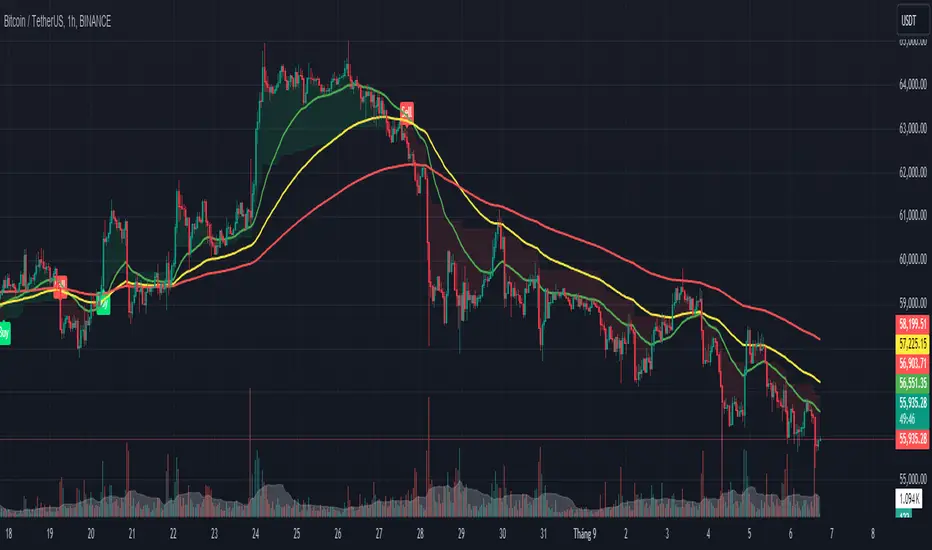
SONIC R BREAK FINAL (VER5)
Purpose: Capture breakouts through Support/Resistance (S/R) zones based on Pivot and filter signals using EMA 34 (High/Low/Close), EMA 89, volume, and candle structure. Includes a Higher Timeframe (H4) RSI risk warning (visual only, does not block entries).
How it works
S/R zones from Pivot
Draws Resistance and Support using ta.pivothigh/ta.pivotlow with Left/Right Bars.
S/R lines are locked with offset to reduce repaint.
EMA trend filters
EMA34 High/Low/Close build a “EMA 34 band”.
EMA89 works as the main trend filter.
Trend conditions:
Long: close above all EMA34 High/Low/Close and EMA89.
Short: close below all EMA34 High/Low/Close and EMA89.
Volume filter (optional)
Signal valid only if Volume > SMA(Volume, n).
Wick filter
Each wick (upper/lower) ≤ 50% of candle range to avoid weak breakouts.
Higher TF RSI risk (H4)
Fetches RSI from a higher timeframe (default H4).
If RSI exceeds threshold, breakout labels turn gray (risk warning only).
Anti-repeat mechanism
Each new pivot resets trigger.
Each S/R level triggers only once until the next pivot is formed.
Signals & Alerts
Label “B” (green) below candle: breakout above Resistance, valid EMA/Volume/Wick conditions.
Label “S” (red) above candle: breakout below Support, valid EMA/Volume/Wick conditions.
Gray labels = H4 RSI risk warning.
Unified alert: “S/R Breakout (Unified)” with message B=Buy, S=Sell, Gray=Risk.
Parameters
Show Breaks: toggle breakout detection.
Left/Right Bars: pivot sensitivity.
Require Volume > Average + Volume MA Length: volume filter.
Use H4 RSI Risk Warning: enable higher TF RSI check.
RSI Length, Higher TF (minutes), RSI thresholds for Buy/Sell risk.
Usage tips
Prioritize trades in the same direction as EMA89 and EMA34 trend.
Works on M5 to H4; best combined with RSI H4 when trading M15/M30.
Place SL behind the S/R just broken, TP by fixed RR or EMA trailing.
Increase Left/Right Bars for stronger zones and less noise in sideways markets.
Notes
Pivot still has repaint element (mitigated by offset).
This indicator is not financial advice. Always combine with proper risk management.
Version
Clean v4: added wick ≤50% filter, H4 RSI risk coloring, volume filter, anti-repeat pivot trigger, unified alert, EMA34 H/L/C background shading.
Squeeze Momentum Regression Clouds [SciQua]╭──────────────────────────────────────────────╮
☁️ Squeeze Momentum Regression Clouds
╰──────────────────────────────────────────────╯
🔍 Overview
The Squeeze Momentum Regression Clouds (SMRC) indicator is a powerful visual tool for identifying price compression , trend strength , and slope momentum using multiple layers of linear regression Clouds. Designed to extend the classic squeeze framework, this indicator captures the behavior of price through dynamic slope detection, percentile-based spread analytics, and an optional UI for trend inspection — across up to four customizable regression Clouds .
────────────────────────────────────────────────────────────
╭────────────────╮
⚙️ Core Features
╰────────────────╯
Up to 4 Regression Clouds – Each Cloud is created from a top and bottom linear regression line over a configurable lookback window.
Slope Detection Engine – Identifies whether each band is rising, falling, or flat based on slope-to-ATR thresholds.
Spread Compression Heatmap – Highlights compressed zones using yellow intensity, derived from historical spread analysis.
Composite Trend Scoring – Aggregates directional signals from each Cloud using your chosen weighting model.
Color-Coded Candles – Optional candle coloring reflects the real-time composite score.
UI Table – A toggleable info table shows slopes, compression levels, percentile ranks, and direction scores for each Cloud.
Gradient Cloud Styling – Apply gradient coloring from Cloud 1 to Cloud 4 for visual slope intensity.
Weight Aggregation Options – Use equal weighting, inverse-length weighting, or max pooling across Clouds to determine composite trend strength.
────────────────────────────────────────────────────────────
╭──────────────────────────────────────────╮
🧪 How to Use the Indicator
1. Understand Trend Bias with Cloud Colors
╰──────────────────────────────────────────╯
Each Cloud changes color based on its current slope:
Green indicates a rising trend.
Red indicates a falling trend.
Gray indicates a flat slope — often seen during chop or transitions.
Cloud 1 typically reflects short-term structure, while Cloud 4 represents long-term directional bias. Watch for multi-Cloud alignment — when all Clouds are green or red, the trend is strong. Divergence among Clouds often signals a potential shift.
────────────────────────────────────────────────────────────
╭───────────────────────────────────────────────╮
2. Use Compression Heat to Anticipate Breakouts
╰───────────────────────────────────────────────╯
The space between each Cloud’s top and bottom regression lines is measured, normalized, and analyzed over time. When this spread tightens relative to its history, the script highlights the band with a yellow compression glow .
This visual cue helps identify squeeze zones before volatility expands. If you see compression paired with a changing slope color (e.g., gray to green), this may indicate an impending breakout.
────────────────────────────────────────────────────────────
╭─────────────────────────────────╮
3. Leverage the Optional Table UI
╰─────────────────────────────────╯
The indicator includes a dynamic, floating table that displays real-time metrics per Cloud. These include:
Slope direction and value , with historical Min/Max reference.
Top and Bottom percentile ranks , showing how price sits within the Cloud range.
Current spread width , compared to its historical norms.
Composite score , which blends trend, slope, and compression for that Cloud.
You can customize the table’s position, theme, transparency, and whether to show a combined summary score in the header.
────────────────────────────────────────────────────────────
╭─────────────────────────────────────────────╮
4. Analyze Candle Color for Composite Signals
╰─────────────────────────────────────────────╯
When enabled, the indicator colors candles based on a weighted composite score. This score factors in:
The signed slope of each Cloud (up, down, or flat)
The percentile pressure from the top and bottom bands
The degree of spread compression
Expect green candles in bullish trend phases, red candles during bearish regimes, and gray candles in mixed or low-conviction zones.
Candle coloring provides a visual shorthand for market conditions , useful for intraday scanning or historical backtesting.
────────────────────────────────────────────────────────────
╭────────────────────────╮
🧰 Configuration Guidance
╰────────────────────────╯
To tailor the indicator to your strategy:
Use Cloud lengths like 21, 34, 55, and 89 for a balanced multi-timeframe view.
Adjust the slope threshold (default 0.05) to control how sensitive the trend coloring is.
Set the spread floor (e.g., 0.15) to tune when compression is detected and visualized.
Choose your weighting style : Inverse Length (favor faster bands), Equal, or Max Pooling (most aggressive).
Set composite weights to emphasize trend slope, percentile bias, or compression—depending on your market edge.
────────────────────────────────────────────────────────────
╭────────────────╮
✅ Best Practices
╰────────────────╯
Use aligned Cloud colors across all bands to confirm trend conviction.
Combine slope direction with compression glow for early breakout entry setups.
In choppy markets, watch for Clouds 1 and 2 turning flat while Clouds 3 and 4 remain directional — a sign of potential trend exhaustion or consolidation.
Keep the table enabled during backtesting to manually evaluate how each Cloud behaved during price turns and consolidations.
────────────────────────────────────────────────────────────
╭───────────────────────╮
📌 License & Usage Terms
╰───────────────────────╯
This script is provided under the Creative Commons Attribution-NonCommercial 4.0 International License .
✅ You are allowed to:
Use this script for personal or educational purposes
Study, learn, and adapt it for your own non-commercial strategies
❌ You are not allowed to:
Resell or redistribute the script without permission
Use it inside any paid product or service
Republish without giving clear attribution to the original author
For commercial licensing , private customization, or collaborations, please contact Joshua Danford directly.

The Kyber Cell's – TTM Wave CThe Kyber Cell’s Wave C – TTM Squeeze Macro Bias & Structural Filter
⸻
1. Introduction
Wave C is the strategic compass in the TTM Squeeze Wave system — the final layer that helps you align with the larger trend or macro context. While Wave A delivers momentum bursts and Wave B confirms active trend direction, Wave C filters trades through a broader lens, helping you avoid taking strong intraday setups that go against the dominant structure.
Wave C is designed to act as your macro bias validator — filtering out trades that contradict higher-timeframe flows or major moving average slopes. When all three waves line up, you’re no longer just reacting to signals — you’re trading with intention and structure. When in doubt, zoom out and that is what Wave C gives you.
⸻
2. Core Concept and Calculation
Wave C is built to measure high-level trend bias, either on the current chart timeframe or derived from a higher timeframe (HTF). Its logic is based on one or more of the following structural tools:
• Long-term EMA slope (e.g., 55, 89, or 200 EMA)
• HTF VWAP positioning (price above or below)
• Long-period HMA slope (e.g., HMA 144 or HMA 233)
• Directional bias from HTF TTM Squeeze or MTF trend engine
Unlike Wave A and B, which may fluctuate during normal price swings, Wave C changes more slowly. That’s the point — it gives a “big picture” backdrop against which all lower-level signals should be evaluated. It reduces false positives and helps you wait for trades in the direction of the broader trend.
⸻
3. Visual Output and Color Logic
Wave C uses a simple and deliberate color scheme to communicate macro alignment:
• Green: Bullish macro structure
• Red: Bearish macro structure
• Gray: Neutral, indecisive, or flat macro trend
This muted but firm logic encourages patient, structured trading. The goal isn’t to trigger trades directly from Wave C, but to filter out trades that contradict market posture.
• When Wave C is Green, you ideally want Wave B to be blue and Wave A to turn cyan before going long.
• When Wave C is Red, you look for Wave B to be red and Wave A to turn bright red before shorting.
• If Wave C is Gray, it may signal choppy, indecisive structure — use caution or reduce trade size.
⸻
4. Ideal Use Case
Wave C functions as your global bias filter:
1. Set your directional bias for the session or week.
2. Only take trades that agree with Wave C direction.
3. When all waves align, trade with size and confidence.
4. When Wave C disagrees, wait or downshift your trade plan.
This makes Wave C especially valuable for swing traders, position traders, or intraday traders who want to anchor their entries within a broader trend.
⸻
5. Configuration and Customization
Wave C is built with advanced users in mind, and its configuration allows multiple structural methods:
• EMA Slope Method: Set EMA length and threshold angle
• HTF Source Method: Request HTF data for squeeze trend, VWAP, or Wave B analog
• HMA Trend Filter: Longer-term smoothing to detect sustained directional flow
• Color Preferences: Customize green/red/gray scheme as needed
This flexibility allows you to tailor Wave C to your strategy — whether you’re anchoring to a Daily EMA while scalping the 5-minute chart, or aligning swing entries with the Weekly VWAP.
⸻
6. Alerts and Add-ons
Although Wave C isn’t typically used for alerts, it can be incorporated into confluence-based alert stacks. For example:
• Alert only when Wave C = Green, Wave B = Blue, and Wave A = Rising
• Alert on macro flip (e.g., Green → Red) as a possible regime change
• Alert when macro bias agrees with MTF Squeeze Panel bias
These setups are more advanced but help automate disciplined trade selection.
⸻
7. Disclaimer
This indicator is for educational and research purposes only. It is not trading advice. Wave C is most effective when used in conjunction with Wave A, Wave B, and other structural context. All trades should be executed with proper risk management and backtested methodology.

EMA Ribbon with TableThis indicator plots multiple EMAs (5, 8, 13, 21, 34, 55, 89, 144, 233, 377) based on Fibonacci levels. Each line has a distinct color, and a clean table displays their real-time values. Great for spotting trend direction, crossovers, and momentum at a glance.

Staccked SMA - Regime Switching & Persistance StatisticsThis indicator is designed to identify the prevailing market regime by analyzing the behavior of a "stack" of Simple Moving Averages (SMAs). It helps you understand whether the market is currently trending, mean-reverting, or moving randomly.
Core Concept: SMA Correlation
At its heart, the indicator examines the relationship between a set of nine SMAs with different lengths (3, 5, 8, 13, 21, 34, 55, 89, 144) and the lengths themselves.
In a strong trending market (either up or down), the SMAs will be neatly "stacked" in order of their length. The shortest SMA will be furthest from the longest SMA, creating a strong, almost linear visual pattern. When we measure the statistical correlation between the SMA values and their corresponding lengths, we get a value close to +1 (perfect uptrend stack) or -1 (perfect downtrend stack). The absolute value of this correlation will be very high (close to 1).
In a mean-reverting or sideways market, the SMAs will be tangled and crisscrossing each other. There is no clear order, and the relationship between an SMA's length and its price value is weak. The correlation will be close to 0.
This indicator calculates this Pearson correlation on every bar, giving a continuous measure of how ordered or "trendy" the SMAs are. An absolute correlation above 0.8 is considered strongly trending, while a value between 0.4 and 0.8 suggests a mean-reverting character. Below 0.4, the market is likely random or choppy.
Regime Classification and Statistics
The indicator doesn't just look at the current correlation; it analyzes its behavior over a user-defined lookback window (default is 252 bars) to classify the overall market "regime."
It presents its findings in a clear table:
📊 |SMA Correlation| Regime Table: This main table provides a snapshot of the current market character.
Median: Shows the median absolute correlation over the lookback period, giving a central tendency of the market's behavior.
% > 0.80: The percentage of time the market was in a strong trend during the lookback period.
% < 0.80 & > 0.40: The percentage of time the market showed mean-reverting characteristics.
🧠 Regime: The final classification. It's labeled "📈 Trend-Dominant" if the median correlation is high and it has spent a significant portion of the time trending. It's labeled "🔄 Mean-Reverting" if the median is in the middle range and it has spent significant time in that state. Otherwise, it's considered "⚖️ Random/ Choppy".
📐 Regime Significance: This tells you how statistically confident you can be in the current regime classification, using a Z-score to compare its occurrence against random chance. ⭐⭐⭐ indicates high confidence (99%), while "❌ Not Significant" means the pattern could be random.
Regime Transition Probabilities
Optionally, a second table can be displayed that shows the historical probability of the market transitioning from one regime to another over different time horizons (t+5, t+10, t+15, and t+20 bars).
📈 → 🔄 → ⚖️ Transition Table: This table answers questions like, "If the market is trending now (From: 📈), what is the probability it will be mean-reverting (→ 🔄) in 10 bars?"
This provides powerful insights into the market's cyclical nature, helping you anticipate future behavior based on past patterns. For example, you might find that after a period of strong trending, a transition to a choppy state is more likely than a direct switch to a mean-reverting
Indicator Settings
Lookback Window for Regime Classification: This sets the number of recent bars (default is 252) the script analyzes to determine the current market regime (Trending, Mean-Reverting, or Random). A larger number provides a more stable, long-term view, while a smaller number makes the classification more sensitive to recent price action.
Show Regime Transition Table: A simple toggle (on/off) to show or hide the table that displays the probabilities of the market switching from one regime to another.
Lookback Offset for Starting Regime: This determines the "starting point" in the past for calculating regime transitions. The default is 20 bars ago. The script looks at the regime at this point and then checks what it became at later points.
Step 1, 2, 3, 4 Offset (bars): These define the future time intervals (5, 10, 15, and 20 bars by default) for the transition probability table. For example, the script checks the regime at the "Lookback Offset" and then sees what it transitioned to 5, 10, 15, and 20 bars later.
Significance Filter Settings
Use Regime Significance Filter: When enabled, this filter ensures that the regime transition statistics only count transitions that were "statistically significant." This helps to filter out noise and focus on more reliable patterns.
Min Stars Required (1=90%, 2=95%, 3=99%): This sets the minimum confidence level required for a regime to be included in the transition statistics when the significance filter is on.
1 ⭐: Requires at least 90% confidence.
2 ⭐⭐: Requires at least 95% confidence (default).
3 ⭐⭐⭐: Requires at least 99% confidence.

Mandelbrot-Fibonacci Cascade Vortex (MFCV)Mandelbrot-Fibonacci Cascade Vortex (MFCV) - Where Chaos Theory Meets Sacred Geometry
A Revolutionary Synthesis of Fractal Mathematics and Golden Ratio Dynamics
What began as an exploration into Benoit Mandelbrot's fractal market hypothesis and the mysterious appearance of Fibonacci sequences in nature has culminated in a groundbreaking indicator that reveals the hidden mathematical structure underlying market movements. This indicator represents months of research into chaos theory, fractal geometry, and the golden ratio's manifestation in financial markets.
The Theoretical Foundation
Mandelbrot's Fractal Market Hypothesis Traditional efficient market theory assumes normal distributions and random walks. Mandelbrot proved markets are fractal - self-similar patterns repeating across all timeframes with power-law distributions. The MFCV implements this through:
Hurst Exponent Calculation: H = log(R/S) / log(n/2)
Where:
R = Range of cumulative deviations
S = Standard deviation
n = Period length
This measures market memory:
H > 0.5: Trending (persistent) behavior
H = 0.5: Random walk
H < 0.5: Mean-reverting (anti-persistent) behavior
Fractal Dimension: D = 2 - H
This quantifies market complexity, where higher dimensions indicate more chaotic behavior.
Fibonacci Vortex Theory Markets don't move linearly - they spiral. The MFCV reveals these spirals using Fibonacci sequences:
Vortex Calculation: Vortex(n) = Price + sin(bar_index × φ / Fn) × ATR(Fn) × Volume_Factor
Where:
φ = 0.618 (golden ratio)
Fn = Fibonacci number (8, 13, 21, 34, 55)
Volume_Factor = 1 + (Volume/SMA(Volume,50) - 1) × 0.5
This creates oscillating spirals that contract and expand with market energy.
The Volatility Cascade System
Markets exhibit volatility clustering - Mandelbrot's "Noah Effect." The MFCV captures this through cascading volatility bands:
Cascade Level Calculation: Level(i) = ATR(20) × φ^i
Each level represents a different fractal scale, creating a multi-dimensional view of market structure. The golden ratio spacing ensures harmonic resonance between levels.
Implementation Architecture
Core Components:
Fractal Analysis Engine
Calculates Hurst exponent over user-defined periods
Derives fractal dimension for complexity measurement
Identifies market regime (trending/ranging/chaotic)
Fibonacci Vortex Generator
Creates 5 independent spiral oscillators
Each spiral follows a Fibonacci period
Volume amplification creates dynamic response
Cascade Band System
Up to 8 volatility levels
Golden ratio expansion between levels
Dynamic coloring based on fractal state
Confluence Detection
Identifies convergence of vortex and cascade levels
Highlights high-probability reversal zones
Real-time confluence strength calculation
Signal Generation Logic
The MFCV generates two primary signal types:
Fractal Signals: Generated when:
Hurst > 0.65 (strong trend) AND volatility expanding
Hurst < 0.35 (mean reversion) AND RSI < 35
Trend strength > 0.4 AND vortex alignment
Cascade Signals: Triggered by:
RSI > 60 AND price > SMA(50) AND bearish vortex
RSI < 40 AND price < SMA(50) AND bullish vortex
Volatility expansion AND trend strength > 0.3
Both signals implement a 15-bar cooldown to prevent overtrading.
Advanced Input System
Mandelbrot Parameters:
Cascade Levels (3-8):
Controls number of volatility bands
Crypto: 5-7 (high volatility)
Indices: 4-5 (moderate volatility)
Forex: 3-4 (low volatility)
Hurst Period (20-200):
Lookback for fractal calculation
Scalping: 20-50
Day Trading: 50-100
Swing Trading: 100-150
Position Trading: 150-200
Cascade Ratio (1.0-3.0):
Band width multiplier
1.618: Golden ratio (default)
Higher values for trending markets
Lower values for ranging markets
Fractal Memory (21-233):
Fibonacci retracement lookback
Uses Fibonacci numbers for harmonic alignment
Fibonacci Vortex Settings:
Spiral Periods:
Comma-separated Fibonacci sequence
Fast: "5,8,13,21,34" (scalping)
Standard: "8,13,21,34,55" (balanced)
Extended: "13,21,34,55,89" (swing)
Rotation Speed (0.1-2.0):
Controls spiral oscillation frequency
0.618: Golden ratio (balanced)
Higher = more signals, more noise
Lower = smoother, fewer signals
Volume Amplification:
Enables dynamic spiral expansion
Essential for stocks and crypto
Disable for forex (no central volume)
Visual System Architecture
Cascade Bands:
Multi-level volatility envelopes
Gradient coloring from primary to secondary theme
Transparency increases with distance from price
Fill between bands shows fractal structure
Vortex Spirals:
5 Fibonacci-period oscillators
Blue above price (bullish pressure)
Red below price (bearish pressure)
Multiple display styles: Lines, Circles, Dots, Cross
Dynamic Fibonacci Levels:
Auto-updating retracement levels
Smart update logic prevents disruption near levels
Distance-based transparency (closer = more visible)
Updates every 50 bars or on volatility spikes
Confluence Zones:
Highlighted boxes where indicators converge
Stronger confluence = stronger support/resistance
Key areas for reversal trades
Professional Dashboard System
Main Fractal Dashboard: Displays real-time:
Hurst Exponent with market state
Fractal Dimension with complexity level
Volatility Cascade status
Vortex rotation impact
Market regime classification
Signal strength percentage
Active indicator levels
Vortex Metrics Panel: Shows:
Individual spiral deviations
Convergence/divergence metrics
Real-time vortex positioning
Fibonacci period performance
Fractal Metrics Display: Tracks:
Dimension D value
Market complexity rating
Self-similarity strength
Trend quality assessment
Theory Guide Panel: Educational reference showing:
Mandelbrot principles
Fibonacci vortex concepts
Dynamic trading suggestions
Trading Applications
Trend Following:
High Hurst (>0.65) indicates strong trends
Follow cascade band direction
Use vortex spirals for entry timing
Exit when Hurst drops below 0.5
Mean Reversion:
Low Hurst (<0.35) signals reversal potential
Trade toward vortex spiral convergence
Use Fibonacci levels as targets
Tighten stops in chaotic regimes
Breakout Trading:
Monitor cascade band compression
Watch for vortex spiral alignment
Volatility expansion confirms breakouts
Use confluence zones for targets
Risk Management:
Position size based on fractal dimension
Wider stops in high complexity markets
Tighter stops when Hurst is extreme
Scale out at Fibonacci levels
Market-Specific Optimization
Cryptocurrency:
Cascade Levels: 5-7
Hurst Period: 50-100
Rotation Speed: 0.786-1.2
Enable volume amplification
Stock Indices:
Cascade Levels: 4-5
Hurst Period: 80-120
Rotation Speed: 0.5-0.786
Moderate cascade ratio
Forex:
Cascade Levels: 3-4
Hurst Period: 100-150
Rotation Speed: 0.382-0.618
Disable volume amplification
Commodities:
Cascade Levels: 4-6
Hurst Period: 60-100
Rotation Speed: 0.5-1.0
Seasonal adjustment consideration
Innovation and Originality
The MFCV represents several breakthrough innovations:
First Integration of Mandelbrot Fractals with Fibonacci Vortex Theory
Unique synthesis of chaos theory and sacred geometry
Novel application of Hurst exponent to spiral dynamics
Dynamic Volatility Cascade System
Golden ratio-based band expansion
Multi-timeframe fractal analysis
Self-adjusting to market conditions
Volume-Amplified Vortex Spirals
Revolutionary spiral calculation method
Dynamic response to market participation
Multiple Fibonacci period integration
Intelligent Signal Generation
Cooldown system prevents overtrading
Multi-factor confirmation required
Regime-aware signal filtering
Professional Analytics Dashboard
Institutional-grade metrics display
Real-time fractal analysis
Educational integration
Development Journey
Creating the MFCV involved overcoming numerous challenges:
Mathematical Complexity: Implementing Hurst exponent calculations efficiently
Visual Clarity: Displaying multiple indicators without cluttering
Performance Optimization: Managing array operations and calculations
Signal Quality: Balancing sensitivity with reliability
User Experience: Making complex theory accessible
The result is an indicator that brings PhD-level mathematics to practical trading while maintaining visual elegance and usability.
Best Practices and Guidelines
Start Simple: Use default settings initially
Match Timeframe: Adjust parameters to your trading style
Confirm Signals: Never trade MFCV signals in isolation
Respect Regimes: Adapt strategy to market state
Manage Risk: Use fractal dimension for position sizing
Color Themes
Six professional themes included:
Fractal: Balanced blue/purple palette
Golden: Warm Fibonacci-inspired colors
Plasma: Vibrant modern aesthetics
Cosmic: Dark mode optimized
Matrix: Classic green terminal
Fire: Heat map visualization
Disclaimer
This indicator is for educational and research purposes only. It does not constitute financial advice. While the MFCV reveals deep market structure through advanced mathematics, markets remain inherently unpredictable. Past performance does not guarantee future results.
The integration of Mandelbrot's fractal theory with Fibonacci vortex dynamics provides unique market insights, but should be used as part of a comprehensive trading strategy. Always use proper risk management and never risk more than you can afford to lose.
Acknowledgments
Special thanks to Benoit Mandelbrot for revolutionizing our understanding of markets through fractal geometry, and to the ancient mathematicians who discovered the golden ratio's universal significance.
"The geometry of nature is fractal... Markets are fractal too." - Benoit Mandelbrot
Revealing the Hidden Order in Market Chaos Trade with Mathematical Precision. Trade with MFCV.
— Created with passion for the TradingView community
Trade with insight. Trade with anticipation.
— Dskyz , for DAFE Trading Systems

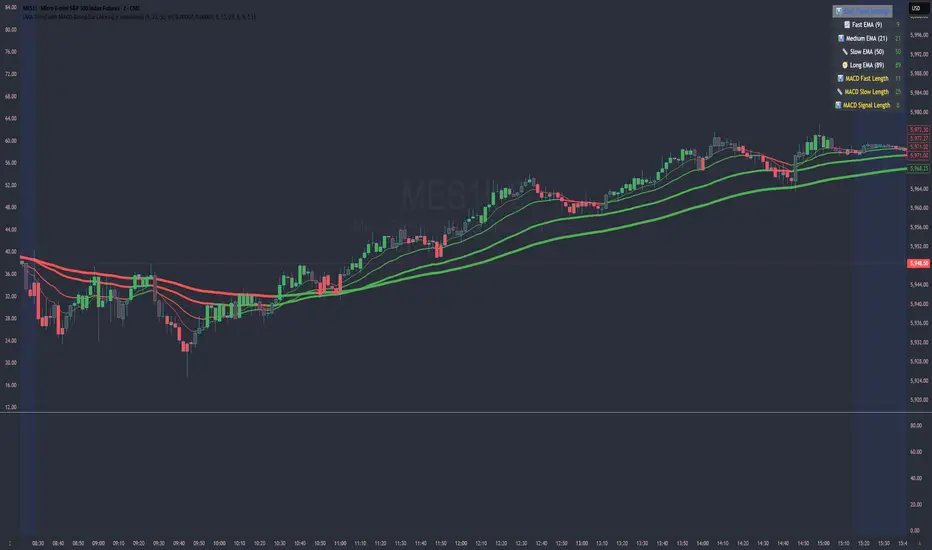
EMA Trend with MACD-Based Bar Coloring (Customized)This indicator blends trend-following EMAs with MACD-based momentum signals to provide a visually intuitive view of market conditions. It's designed for traders who value clean, color-coded charts and want to quickly assess both trend direction and overbought/oversold momentum.
🔍 Key Features:
Multi-EMA Trend Visualization:
Includes four Exponential Moving Averages (EMAs):
Fast (9)
Medium (21)
Slow (50)
Long (89)
Each EMA is dynamically color-coded based on its slope—green for bullish, red for bearish, and gray for neutral—to help identify the trend strength and alignment at a glance.
MACD-Based Bar Coloring:
Candlesticks are colored based on MACD's relationship to its Bollinger Bands:
Green bars signal strong bullish momentum (MACD > Upper Band)
Red bars signal strong bearish momentum (MACD < Lower Band)
Gray bars reflect neutral conditions
Compact Visual Dashboard:
A clean, top-right table displays your current EMA and MACD settings, helping you track parameter configurations without opening the settings menu.
✅ Best Used For:
Identifying trend alignment across short- to medium-term timeframes
Filtering entries based on trend strength and MACD overextension
Enhancing discretion-based or rule-based strategies with visual confirmation
Williams R Zone Scalper v1.0[BullByte]Originality & Usefulness
Unlike standard Williams R cross-over scripts, this strategy layers five dynamic filters—moving-average trend, Supertrend, Choppiness Index, Bollinger Band Width, and volume validation —and presents a real-time dashboard with equity, PnL, filter status, and key indicator values. No other public Pine script combines these elements with toggleable filters and a custom dashboard. In backtests (BTC/USD (Binance), 5 min, 24 Mar 2025 → 28 Apr 2025), adding these filters turned a –2.09 % standalone Williams R into a +5.05 % net winner while cutting maximum drawdown in half.
---
What This Script Does
- Monitors Williams R (length 14) for overbought/oversold reversals.
- Applies up to five dynamic filters to confirm trend strength and volatility direction:
- Moving average (SMA/EMA/WMA/HMA)
- Supertrend line
- Choppiness Index (CI)
- Bollinger Band Width (BBW)
- Volume vs. its 50-period MA
- Plots blue arrows for Long entries (R crosses above –80 + all filters green) and red arrows for Short entries (R crosses below –20 + all filters green).
- Optionally sets dynamic ATR-based stop-loss (1.5×ATR) and take-profit (2×ATR).
- Shows a dashboard box with current position, equity, PnL, filter status, and real-time Williams R / MA/volume values.
---
Backtest Summary (BTC/USD(Binance), 5 min, 24 Mar 2025 → 28 Apr 2025)
• Total P&L : +50.70 USD (+5.05 %)
• Max Drawdown : 31.93 USD (3.11 %)
• Total Trades : 198
• Win Rate : 55.05 % (109/89)
• Profit Factor : 1.288
• Commission : 0.01 % per trade
• Slippage : 0 ticks
Even in choppy March–April, this multi-filter approach nets +5 % with a robust risk profile, compared to –2.09 % and higher drawdown for Williams R alone.
---
Williams R Alone vs. Multi-Filter Version
• Total P&L :
– Williams R alone → –20.83 USD (–2.09 %)
– Multi-Filter → +50.70 USD (+5.05 %)
• Max Drawdown :
– Williams R alone → 62.13 USD (6.00 %)
– Multi-Filter → 31.93 USD (3.11 %)
• Total Trades : 543 vs. 198
• Win Rate : 60.22 % vs. 55.05 %
• Profit Factor : 0.943 vs. 1.288
---
Inputs & What They Control
- wrLen (14): Williams R look-back
- maType (EMA): Trend filter type (SMA, EMA, WMA, HMA)
- maLen (20): Moving-average period
- useChop (true): Toggle Choppiness Index filter
- ciLen (12): CI look-back length
- chopThr (38.2): CI threshold (below = trending)
- useVol (true): Toggle volume-above-average filter
- volMaLen (50): Volume MA period
- useBBW (false): Toggle Bollinger Band Width filter
- bbwMaLen (50): BBW MA period
- useST (false): Toggle Supertrend filter
- stAtrLen (10): Supertrend ATR length
- stFactor (3.0): Supertrend multiplier
- useSL (false): Toggle ATR-based SL/TP
- atrLen (14): ATR period for SL/TP
- slMult (1.5): SL = slMult × ATR
- tpMult (2.0): TP = tpMult × ATR
---
How to Read the Chart
- Blue arrow (Long): Williams R crosses above –80 + all enabled filters green
- Red arrow (Short) : Williams R crosses below –20 + all filters green
- Dashboard box:
- Top : position and equity
- Next : cumulative PnL in USD & %
- Middle : green/white dots for each filter (green=passing, white=disabled)
- Bottom : Williams R, MA, and volume current values
---
Usage Tips
- Add the script : Indicators → My Scripts → Williams R Zone Scalper v1.0 → Add to BTC/USD chart on 5 min.
- Defaults : Optimized for BTC/USD.
- Forex majors : Raise `chopThr` to ~42.
- Stocks/high-beta : Enable `useBBW`.
- Enable SL/TP : Toggle `useSL`; stop-loss = 1.5×ATR, take-profit = 2×ATR apply automatically.
---
Common Questions
- * Why not trade every Williams R reversal?*
Raw Williams R whipsaws in sideways markets. Choppiness and volume filters reduce false entries.
- *Can I use on 1 min or 15 min?*
Yes—adjust ATR length or thresholds accordingly. Defaults target 5 min scalping.
- *What if all filters are on?*
Fewer arrows, higher-quality signals. Expect ~10 % boost in average win size.
---
Disclaimer & License
Trading carries risk of loss. Use this script “as is” under the Mozilla Public License 2.0 (mozilla.org). Always backtest, paper-trade, and adjust risk settings to your own profile.
---
Credits & References
- Pine Script v6, using TradingView’s built-in `ta.supertrend()`.
- TradingView House Rules: www.tradingview.com
Goodluck!
BullByte

Pino Trend Pack (SMA/EMA + Bollinger)🔹 Pino Trend Pack is a compact trend-following and volatility indicator that includes:
📈 Moving Averages:
- SMA 10, SMA 30
- EMA 21, EMA 55, EMA 89
(All configured for short-term to mid-term trend analysis by default, but fully adjustable for user preference.)
📊 Bollinger Bands:
- Period: 20
- Standard Deviation: 2.0
- Includes Upper Band, Lower Band, and Basis (SMA 20)
This pack is designed for traders who want a clean visual of price dynamics across multiple short-term trend layers, combined with volatility tracking. It helps you identify compression, expansion, and trend shifts at a glance.
🧠 Ideal for swing trading, short- to mid-term setups, or as a supporting tool in any confluence-based strategy.

PVSRA v5Overview of the PVSRA Strategy
This strategy is designed to detect and capitalize on volume-driven threshold breaches in price candles. It operates on the premise that when a high-volume candle breaks a critical price threshold, not all orders are filled within that candle’s range. This creates an imbalance—similar to a physical system being perturbed—causing the price to revert toward the level where the breach occurred to “absorb” the residual orders.
Key Features and Their Theoretical Underpinnings
Dynamic Volume Analysis and Threshold Detection
Volume Surges as Market Perturbations:
The script computes a moving average of volume over a short window and flags moments when the current volume significantly exceeds this average. These surges act as a perturbation—injecting “energy” into the market.
Adaptive Abnormal Volume Threshold:
By calculating a dynamic abnormal threshold using a daily volume average (via an 89-period VWMA) and standard deviation, the strategy identifies when the current volume is abnormally high. This mechanism mirrors the idea that when a system is disturbed (here, by a volume surge), it naturally seeks to return to equilibrium.
Candle Coloring and Visual Signal Identification
Differentiation of Candle Types:
The script distinguishes between bullish (green) and bearish (red) candles. It applies different colors based on the strength of the volume signal, providing a clear, visual representation of whether a candle is likely to trigger a price reversion.
Implication of Unfilled Orders:
A red (bearish) candle with high volume implies that sell pressure has pushed the price past a critical threshold—yet not all buy orders have been fulfilled. Conversely, a green (bullish) candle indicates that aggressive buying has left pending sell orders. In both cases, the market is expected to reverse toward the breach point to restore balance.
Trade Execution Logic: Normal and Reversal Trades
Normal Trades:
When a high-volume candle breaches a threshold and meets the directional conditions (e.g., a red candle paired with price above a daily upper band), the strategy enters a trade anticipating a reversion. The underlying idea is that the market will move back to the level where the threshold was crossed—clearing the residual orders in a manner analogous to a system following the path of least resistance.
Reversal Trades:
The strategy also monitors for clusters of consecutive signals within a short lookback period. When multiple signals accumulate, it interprets this as the market having overextended and, in a corrective move, reverses the typical trade direction. This inversion captures the market’s natural tendency to “correct” itself by moving in discrete, quantized steps—each step representing the absorption of a minimum quantum of order imbalance.
Risk and Trade Management
Stop Loss and Take Profit Buffers:
Both normal and reversal trades include predetermined buffers for stop loss and take profit levels. This systematic risk management approach is designed to capture the anticipated reversion while minimizing potential losses, aligning with the idea that market corrections follow the most energy-efficient path back to equilibrium.
Symbol Flexibility:
An option to override the chart’s symbol allows the strategy to be applied consistently across different markets, ensuring that the volume and price dynamics are analyzed uniformly.
Conceptual Bridge: From Market Dynamics to Trade Execution
At its core, the strategy treats market price movements much like a physical system that seeks to minimize “transactional energy” or inefficiency. When a price candle breaches a key threshold on high volume, it mimics an injection of energy into the system. The subsequent price reversion is the market’s natural response—moving in the most efficient path back to balance. This perspective is akin to the principle of least action, where the system evolves along the trajectory that minimizes cumulative imbalance, and it acknowledges that these corrections occur in discrete steps reflective of quantized order execution.
This unified framework allows the PVSRA strategy to not only identify when significant volume-based threshold breaches occur but also to systematically execute trades that benefit from the expected corrective moves.

RSI & EMA IndicatorMulti-Timeframe EMA & RSI Analysis with Trend Merging Detection
Overview
This script provides traders with a multi-timeframe analysis tool that simplifies trend detection, momentum confirmation, and potential trend shifts. It integrates Exponential Moving Averages (EMAs) and the Relative Strength Index (RSI) across Daily, Weekly, and Monthly timeframes, helping traders assess both long-term and short-term market conditions at a glance.
This script is a simplification and modification of the EMA Cheatsheet by MarketMoves, reducing chart clutter while adding EMA merging detection to highlight potential trend reversals or breakouts.
Originality and Usefulness
Unlike traditional indicators, which focus on a single timeframe, this script combines multiple timeframes in a single view to offer a comprehensive market outlook.
What Makes This Indicator Unique?
This Indicator to Combine RSI and EMA Clouds for Multiple Timeframes
Multi-Timeframe Trend Analysis in One Visual Tool
EMA Merging Detection to Spot Trend Shifts Early
Momentum Validation Using RSI Across Daily, Weekly, and Monthly Timeframes
Reduces Chart Clutter While Providing Actionable Trade Signals
I couldn't find a TradingView indicator that displayed RSI and EMA clouds together across Daily, Weekly, and Monthly timeframes. This tool bridges that gap, allowing traders to see trend strength and momentum shifts across key timeframes without switching charts.
How the Script Works
1. Trend Direction via EMAs
The script tracks Short-term (5 & 12-period), Medium-term (34 & 50-period), and Long-term (72 & 89-period) EMAs across Daily, Weekly, and Monthly timeframes.
Bullish trend: When faster EMAs are above slower EMAs.
Bearish trend: When faster EMAs are below slower EMAs.
A visual table simplifies trend recognition with:
Green cells for bullish alignment.
Red cells for bearish alignment.
This color-coded system allows traders to quickly assess market momentum across different timeframes without excessive manual analysis.
2. Momentum Confirmation with RSI
The RSI(14) values for Daily, Weekly, and Monthly timeframes are displayed alongside the EMAs.
RSI above 70 suggests overbought conditions.
RSI below 30 suggests oversold conditions.
By combining RSI with EMA trends, traders can confirm whether momentum supports the trend direction or if the market is losing strength.
3. Trend Shift Detection (EMA Merging Mechanism)
A unique feature of this script is EMA merging detection, which occurs when:
The short, medium, and long-term EMAs come within 0.5% of the price.
This often signals trend reversals, breakouts, or consolidations.
When this condition is met, a warning signal appears, alerting traders to potential market shifts.
Who This Indicator Is For?
This script is designed for traders who want to track trends across multiple timeframes while keeping a clean and simplified chart.
Swing & Position Traders – Identify strong trends and potential momentum shifts for longer-term trades.
Trend Followers – Stay aligned with major market trends and avoid trading against momentum.
Day Traders – Use the Daily timeframe for entries while referencing higher timeframes for confirmation.
How to Use the Indicator
Add the indicator to any chart.
Check the trend table in the top-right corner:
Green cells indicate a bullish trend.
Red cells indicate a bearish trend.
Look at RSI values to confirm momentum:
RSI above 70 = Overbought.
RSI below 30 = Oversold.
Watch for the "Merge" alert to spot potential reversals or consolidations.
Combine signals from multiple timeframes for stronger trade decisions.
Why This Indicator is Unique on TradingView?
Before this script, no TradingView indicator displayed RSI and EMA clouds together across multiple timeframes (Daily, Weekly, Monthly).
This tool eliminates the need to:
Manually check multiple timeframes for trend alignment.
Add multiple EMA and RSI indicators to the same chart, creating clutter.
Constantly switch between different timeframes to confirm momentum and trend direction.
With this indicator, traders can see trend strength and momentum shifts instantly, improving their decision-making process.
Chart Guidelines
The script is designed for use on a clean chart to maximize clarity.
The trend alignment table is displayed in a non-intrusive manner so traders can focus on price action.
No additional indicators are required, but users may combine this script with volume-based indicators for further confirmation.
The script name and timeframe should always be visible on published charts to help traders understand the analysis.
Final Notes
This script is a simplification and modification of the EMA Cheatsheet by MarketMoves, improving trend detection, momentum confirmation, and EMA merging detection.
It is designed to help traders quickly identify trend direction, confirm momentum, and detect potential trend shifts, reducing the need for excessive manual analysis.
Disclaimer: This indicator is for educational purposes only and does not constitute financial advice. Trading involves risk; always use proper risk management when applying this tool in live markets.

Engulfing Pattern with Volume and EMAs
**Strategy Overview:
This strategy combines price action (Engulfing patterns), volume analysis, trend confirmation (EMAs), and noise reduction (ATR filter) to generate high-probability trading signals.
Engulfing Pattern with Volume, EMAs, and Market Noise Filter**
This strategy identifies bullish and bearish Engulfing candlestick patterns, combined with volume analysis, moving averages (EMAs), and a market noise filter to generate trading signals.
**Key Components:**
1. **Engulfing Pattern Detection:**
- **Bullish Engulfing**: A green candle completely engulfs the previous red candle.
- **Bearish Engulfing**: A red candle completely engulfs the previous green candle.
2. **Volume Filter:**
- Signals are validated only if the current volume is higher than the 20-period Simple Moving Average (SMA) of volume.
3. **EMA Indicators:**
- Three EMAs are plotted: 50-period (blue), 89-period (orange), and 200-period (red).
- These EMAs help identify the trend direction and provide additional confirmation.
4. **Market Noise Filter:**
- Uses the Average True Range (ATR) to filter out insignificant price movements.
- A signal is considered valid only if the price movement (absolute difference between open and close) is greater than 0.5 times the 14-period ATR.
**Trading Signals:**
**Buy Signal**:
- Bullish Engulfing pattern + High volume (above SMA 20) + Significant price movement (filtered by ATR).
- Plotted as a green "BUY" label below the candle.
**Sell Signal**:
- Bearish Engulfing pattern + High volume (above SMA 20) + Significant price movement (filtered by ATR).
- Plotted as a red "SELL" label above the candle.
**Customization:**
- Users can adjust EMA lengths, volume SMA period, and ATR multiplier to suit their trading preferences.
[COG] Adaptive Squeeze Intensity 📊 Adaptive Squeeze Intensity (ASI) Indicator
🎯 Overview
The Adaptive Squeeze Intensity (ASI) indicator is an advanced technical analysis tool that combines the power of volatility compression analysis with momentum, volume, and trend confirmation to identify high-probability trading opportunities. It quantifies the degree of price compression using a sophisticated scoring system and provides clear entry signals for both long and short positions.
⭐ Key Features
- 📈 Comprehensive squeeze intensity scoring system (0-100)
- 📏 Multiple Keltner Channel compression zones
- 📊 Volume analysis integration
- 🎯 EMA-based trend confirmation
- 🎨 Proximity-based entry validation
- 📱 Visual status monitoring
- 🎨 Customizable color schemes
- ⚡ Clear entry signals with directional indicators
🔧 Components
1. 📐 Squeeze Intensity Score (0-100)
The indicator calculates a total squeeze intensity score based on four components:
- 📊 Band Convergence (0-40 points): Measures the relationship between Bollinger Bands and Keltner Channels
- 📍 Price Position (0-20 points): Evaluates price location relative to the base channels
- 📈 Volume Intensity (0-20 points): Analyzes volume patterns and thresholds
- ⚡ Momentum (0-20 points): Assesses price momentum and direction
2. 🎨 Compression Zones
Visual representation of squeeze intensity levels:
- 🔴 Extreme Squeeze (80-100): Red zone
- 🟠 Strong Squeeze (60-80): Orange zone
- 🟡 Moderate Squeeze (40-60): Yellow zone
- 🟢 Light Squeeze (20-40): Green zone
- ⚪ No Squeeze (0-20): Base zone
3. 🎯 Entry Signals
The indicator generates entry signals based on:
- ✨ Squeeze release confirmation
- ➡️ Momentum direction
- 📊 Candlestick pattern confirmation
- 📈 Optional EMA trend alignment
- 🎯 Customizable EMA proximity validation
⚙️ Settings
🔧 Main Settings
- Base Length: Determines the calculation period for main indicators
- BB Multiplier: Sets the Bollinger Bands deviation multiplier
- Keltner Channel Multipliers: Three separate multipliers for different compression zones
📈 Trend Confirmation
- Four customizable EMA periods (default: 21, 34, 55, 89)
- Optional trend requirement for entry signals
- Adjustable EMA proximity threshold
📊 Volume Analysis
- Customizable volume MA length
- Adjustable volume threshold for signal confirmation
- Option to enable/disable volume analysis
🎨 Visualization
- Customizable bullish/bearish colors
- Optional intensity zones display
- Status monitor with real-time score and state information
- Clear entry arrows and background highlights
💻 Technical Code Breakdown
1. Core Calculations
// Base calculations for EMAs
ema_1 = ta.ema(close, ema_length_1)
ema_2 = ta.ema(close, ema_length_2)
ema_3 = ta.ema(close, ema_length_3)
ema_4 = ta.ema(close, ema_length_4)
// Proximity calculation for entry validation
ema_prox_raw = math.abs(close - ema_1) / ema_1 * 100
is_close_to_ema_long = close > ema_1 and ema_prox_raw <= prox_percent
```
### 2. Squeeze Detection System
```pine
// Bollinger Bands setup
BB_basis = ta.sma(close, length)
BB_dev = ta.stdev(close, length)
BB_upper = BB_basis + BB_mult * BB_dev
BB_lower = BB_basis - BB_mult * BB_dev
// Keltner Channels setup
KC_basis = ta.sma(close, length)
KC_range = ta.sma(ta.tr, length)
KC_upper_high = KC_basis + KC_range * KC_mult_high
KC_lower_high = KC_basis - KC_range * KC_mult_high
```
### 3. Scoring System Implementation
```pine
// Band Convergence Score
band_ratio = BB_width / KC_width
convergence_score = math.max(0, 40 * (1 - band_ratio))
// Price Position Score
price_range = math.abs(close - KC_basis) / (KC_upper_low - KC_lower_low)
position_score = 20 * (1 - price_range)
// Final Score Calculation
squeeze_score = convergence_score + position_score + vol_score + mom_score
```
### 4. Signal Generation
```pine
// Entry Signal Logic
long_signal = squeeze_release and
is_momentum_positive and
(not use_ema_trend or (bullish_trend and is_close_to_ema_long)) and
is_bullish_candle
short_signal = squeeze_release and
is_momentum_negative and
(not use_ema_trend or (bearish_trend and is_close_to_ema_short)) and
is_bearish_candle
```
📈 Trading Signals
🚀 Long Entry Conditions
- Squeeze release detected
- Positive momentum
- Bullish candlestick
- Price above relevant EMAs (if enabled)
- Within EMA proximity threshold (if enabled)
- Sufficient volume confirmation (if enabled)
🔻 Short Entry Conditions
- Squeeze release detected
- Negative momentum
- Bearish candlestick
- Price below relevant EMAs (if enabled)
- Within EMA proximity threshold (if enabled)
- Sufficient volume confirmation (if enabled)
⚠️ Alert Conditions
- 🔔 Extreme squeeze level reached (score crosses above 80)
- 🚀 Long squeeze release signal
- 🔻 Short squeeze release signal
💡 Tips for Usage
1. 📱 Use the status monitor to track real-time squeeze intensity and state
2. 🎨 Pay attention to the color gradient for trend direction and strength
3. ⏰ Consider using multiple timeframes for confirmation
4. ⚙️ Adjust EMA and proximity settings based on your trading style
5. 📊 Use volume analysis for additional confirmation in liquid markets
📝 Notes
- 🔧 The indicator combines multiple technical analysis concepts for robust signal generation
- 📈 Suitable for all tradable markets and timeframes
- ⭐ Best results typically achieved in trending markets with clear volatility cycles
- 🎯 Consider using in conjunction with other technical analysis tools for confirmation
⚠️ Disclaimer
This technical indicator is designed to assist in analysis but should not be considered as financial advice. Always perform your own analysis and risk management when trading.

Mean Reversion Pro Strategy [tradeviZion]Mean Reversion Pro Strategy : User Guide
A mean reversion trading strategy for daily timeframe trading.
Introduction
Mean Reversion Pro Strategy is a technical trading system that operates on the daily timeframe. The strategy uses a dual Simple Moving Average (SMA) system combined with price range analysis to identify potential trading opportunities. It can be used on major indices and other markets with sufficient liquidity.
The strategy includes:
Trading System
Fast SMA for entry/exit points (5, 10, 15, 20 periods)
Slow SMA for trend reference (100, 200 periods)
Price range analysis (20% threshold)
Position management rules
Visual Elements
Gradient color indicators
Three themes (Dark/Light/Custom)
ATR-based visuals
Signal zones
Status Table
Current position information
Basic performance metrics
Strategy parameters
Optional messages
📊 Strategy Settings
Main Settings
Trading Mode
Options: Long Only, Short Only, Both
Default: Long Only
Position Size: 10% of equity
Starting Capital: $20,000
Moving Averages
Fast SMA: 5, 10, 15, or 20 periods
Slow SMA: 100 or 200 periods
Default: Fast=5, Slow=100
🎯 Entry and Exit Rules
Long Entry Conditions
All conditions must be met:
Price below Fast SMA
Price below 20% of current bar's range
Price above Slow SMA
No existing position
Short Entry Conditions
All conditions must be met:
Price above Fast SMA
Price above 80% of current bar's range
Price below Slow SMA
No existing position
Exit Rules
Long Positions
Exit when price crosses above Fast SMA
No fixed take-profit levels
No stop-loss (mean reversion approach)
Short Positions
Exit when price crosses below Fast SMA
No fixed take-profit levels
No stop-loss (mean reversion approach)
💼 Risk Management
Position Sizing
Default: 10% of equity per trade
Initial capital: $20,000
Commission: 0.01%
Slippage: 2 points
Maximum one position at a time
Risk Control
Use daily timeframe only
Avoid trading during major news events
Consider market conditions
Monitor overall exposure
📊 Performance Dashboard
The strategy includes a comprehensive status table displaying:
Strategy Parameters
Current SMA settings
Trading direction
Fast/Slow SMA ratio
Current Status
Active position (Flat/Long/Short)
Current price with color coding
Position status indicators
Performance Metrics
Net Profit (USD and %)
Win Rate with color grading
Profit Factor with thresholds
Maximum Drawdown percentage
Average Trade value
📱 Alert Settings
Entry Alerts
Long Entry (Buy Signal)
Short Entry (Sell Signal)
Exit Alerts
Long Exit (Take Profit)
Short Exit (Take Profit)
Alert Message Format
Strategy name
Signal type and direction
Current price
Fast SMA value
Slow SMA value
💡 Usage Tips
Consider starting with Long Only mode
Begin with default settings
Keep track of your trades
Review results regularly
Adjust settings as needed
Follow your trading plan
⚠️ Disclaimer
This strategy is for educational and informational purposes only. It is not financial advice. Always:
Conduct your own research
Test thoroughly before live trading
Use proper risk management
Consider your trading goals
Monitor market conditions
Never risk more than you can afford to lose
📋 Release Notes
14 January 2025
Added New Fast & Slow SMA Options:
Fibonacci-based periods: 8, 13, 21, 144, 233, 377
Additional period: 50
Complete Fast SMA options now: 5, 8, 10, 13, 15, 20, 21, 34, 50
Complete Slow SMA options now: 100, 144, 200, 233, 377
Bug Fixes:
Fixed Maximum Drawdown calculation in the performance table
Now using strategy.max_drawdown_percent for accurate DD reporting
Previous version showed incorrect DD values
Performance metrics now accurately reflect trading results
Performance Note:
Strategy tested with Fast/Slow SMA 13/377
Test conducted with 10% equity risk allocation
Daily Timeframe
For Beginners - How to Modify SMA Levels:
Find this line in the code:
fastLength = input.int(title="Fast SMA Length", defval=5, options= )
To add a new Fast SMA period: Add the number to the options list, e.g.,
To remove a Fast SMA period: Remove the number from the options list
For Slow SMA, find:
slowLength = input.int(title="Slow SMA Length", defval=100, options= )
Modify the options list the same way
⚠️ Note: Keep the periods that make sense for your trading timeframe
💡 Tip: Test any new combinations thoroughly before live trading
"Trade with Discipline, Manage Risk, Stay Consistent" - tradeviZion

UM EMA SMA WMA HMA with Directional Color ChangeUM EMA SMA WMA HMA with Directional Color Change
Description:
This is a Swiss Army knife type of Moving Average tool. Select your favorite Moving Average type, EMA - Exponential Moving Average, SMA - Simple Moving Average, WMA - Weighted Moving Average, or HMA - Hull Moving Average. Then selection your number of periods. The MA line is green when trending higher and red when trending lower. The fill between price and the MA line matches the red/green of the direction.
Defaults and Configuration:
The default setting is 65 period and EMA. Line colors and optional fill colors are user-configurable.
Alerts:
An alert can be set on the MA for directional color changes (red to green, or green to red) Right click the indicator and select Add Alert. Then select Bullish or Bearish color change.
Suggested Uses:
Add this to any timeframe chart with your favorite Moving averages. A strategy I use frequently is to "stretch" the Moving average. For example if you like the 8 day moving average on the daily chart, try the 52 period Moving average on the hourly chart. (6.5 market hours per day * 8) By looking at smaller time frames with longer MAs you get smoother color transitions on the Moving average. Add multiple instances of the MA. I prefer to use a smaller quick MA with a longer MA that represents a longer time frame.
Another use case I also like is the color transition over a Moving Average crossover. While I do like the daily 2/6 and 8/3 moving average crossovers, red-to-green and green-to-red color transitions seem to work with less lag than the crossovers.
Suggested Settings:
Daily charts: 8 EMA
Hourly charts: 55 EMA
30 minute charts: 65 WMA. (I like this one for inverse ETFs)
3 minutes charts: 178 EMA and 233 EMA
I also like to round MA settings up or down to the nearest fibonacci number: 5, 8, 13, 21, 34, 55, 89, 144, 233, 377, etc.

Support/Resistance
Custom Moving Average Indicator with MACD, RSI, and Support/Resistance
This indicator is designed to help traders make informed trading decisions by integrating several technical indicators, including moving averages, the Relative Strength Index (RSI), and the Moving Average Convergence Divergence (MACD).
Key Features:
Moving Averages:
This indicator uses simple moving averages (SMAs) for several periods (4, 18, 66, 89, 632, 1000, 1500, 2000, and 3000 bars). This helps to identify the overall trend of the price and potential support and resistance levels.
The color of each moving average line is dynamically changed based on the closing price's position relative to the average; it turns red if the price is above the average and green if the price is below.
Relative Strength Index (RSI):
The RSI is calculated for a 14-bar period, which is a measure of overbought or oversold conditions.
An RSI value above 70 indicates an overbought condition, while a value below 30 indicates an oversold condition.
MACD:
The MACD is calculated using a fast length of 12, a slow length of 26, and a signal length of 9. Crossovers between the MACD line and the signal line indicate momentum shifts.
A crossover of the MACD line above the signal line suggests a potential buy signal, while a crossover below indicates a potential sell signal.
Buy and Sell Signals:
Buy Signal: Triggered when the MACD line crosses above the signal line, the RSI is below 30, the MACD is above 0, and there is high volume.
Sell Signal: Triggered when the MACD line crosses below the signal line, the RSI is above 70, the MACD is below 0, and there is high volume.
Alerts:
The indicator includes alerts that are triggered when buy and sell signals occur, helping traders respond quickly to market opportunities.
How to Trade Using the Indicator (continued):
Trading on Buy Signals:
Look for buy signals when the MACD line crosses above the signal line. Ensure that the RSI is below 30, indicating there is a potential for price recovery from an oversold condition.
Confirm that the volume is above the average, which indicates strong market participation and adds validity to the trade.
Trading on Sell Signals:
Search for sell signals when the MACD line crosses below the signal line. Check that the RSI is above 70 to confirm an overbought condition, implying the price may decline.
As with buy signals, ensure that volume is high to validate the strength of the sell signal.
Risk Management:
Use stop-loss orders to protect your capital. Establish an initial loss threshold based on your risk management strategy.
Continuously monitor the market and new signals and adjust your approach according to your market analysis.
Conclusion:
This combined indicator helps traders make informed decisions by relying on a set of technical tools. To achieve the best results, ensure you integrate the analysis from these indicators with your trading strategies and other techniques.
Feel free to use this explanation as an introduction or guide to inform traders on how to effectively use the indicator. If you have any more questions or need further details, don't hesitate to ask!

Adaptive Fibonacci Trend Ribbon[FibonacciFlux]Adaptive Fibonacci Trend Ribbon (FibonacciFlux)
Overview
The Adaptive Fibonacci Trend Ribbon is a versatile technical analysis tool designed for traders who want to leverage the power of multiple moving averages while integrating Fibonacci numbers. This indicator provides a dynamic visual representation of market trends, enhancing decision-making processes in trading.
Key Features
1. Multi-Moving Averages
- The indicator calculates eight different moving averages based on user-defined periods, including Fibonacci numbers such as 5, 8, 13, 21, 34, 55, 89, and 144.
- Traders can choose from various moving average types, including EMA, HMA, WMA, VWMA, ALMA, SMA, RMA, and TMA , allowing for tailored analysis based on market conditions.
2. Trend Detection
- Each moving average is color-coded based on its trend direction, with green indicating an upward trend and red indicating a downward trend.
- This visual clarity helps traders quickly assess market sentiment and make informed decisions.
3. Fill Areas for Enhanced Insight
- The indicator features fill areas between the moving averages, which dynamically change color according to their relative positions.
- This provides a clear visual cue of trend strength and potential reversal points, allowing traders to identify key areas of interest.
4. Customizable Inputs
- Users can easily adjust the source data, moving average lengths, and ALMA parameters (offset and sigma) to fit their trading strategies.
- This flexibility ensures that traders can adapt the tool to various market conditions and personal preferences.
Insights and Applications
1. Fibonacci Integration
- By incorporating Fibonacci numbers into the moving average periods, this indicator allows traders to align their strategies with key levels of support and resistance.
- This can enhance the accuracy of entry and exit points, particularly in trending markets.
2. Trend Continuation and Reversal Analysis
- The adaptive nature of the moving averages provides insights into potential trend continuations or reversals.
- Traders can use the indicator to identify when to enter or exit positions based on the interaction between the moving averages.
3. Visual Clarity for Quick Decisions
- The color-coded moving averages and fill areas offer immediate visual feedback on market conditions, helping traders react swiftly to changing dynamics.
- This is especially useful in fast-moving markets where timely decisions are critical.
Conclusion
The Adaptive Fibonacci Trend Ribbon is an essential tool for traders looking to enhance their technical analysis capabilities. By combining multiple moving averages with Fibonacci integration and dynamic visual cues, this indicator offers a robust framework for understanding market trends. Its flexibility and clarity make it an invaluable asset for both novice and experienced traders alike.
Open Source Contribution
This indicator is open source, inviting contributions and improvements from the trading community. Feel free to fork, enhance, and share your insights with the world, helping to foster a collaborative environment for traders everywhere.

Trend/with EMA382Introduction to the "Trend/with EMA382" Indicator
The "Trend/with EMA382" indicator is a powerful technical analysis tool that combines trend signals with Exponential Moving Averages (EMA), offering traders a comprehensive view of market dynamics and helping identify potential trading opportunities.
1. Trend Analysis with Trend
The first part of this indicator uses a trend calculation algorithm based on the recent market highs and lows. These levels are used to determine the primary trend:
Bullish (Uptrend): When the market is in an uptrend, the chart will display buy signals in green.
Bearish (Downtrend): When the market is trending down, sell signals are shown in red.
The crossover points between price and trend levels will indicate buy or sell signals on the chart, enabling traders to easily spot entry and exit points.
2. Combination with EMA382
EMA (Exponential Moving Average) is a crucial tool in technical analysis, helping smooth price data and eliminate insignificant short-term fluctuations. This indicator uses three key EMAs:
EMA 34: Reflects short-term trends.
EMA 89: Helps identify medium-term trends.
EMA 200: Determines long-term trends.
These three EMAs assist traders in identifying the overall direction of the market, allowing them to forecast potential trend developments.
3. Application in Trading
The "Trend/with EMA382" indicator is designed to suit various time frames, from short-term to long-term trading. The combination of trend signals and EMAs helps:
Identify the primary market trend.
Provide accurate entry and exit signals.
Deliver clear signals for risk management and profit optimization.
Conclusion
"Trend/with EMA382" is an effective indicator that offers clear signals for both trend and market momentum. By combining EMAs with trend analysis, this indicator empowers traders to make more informed and precise trading decisions.