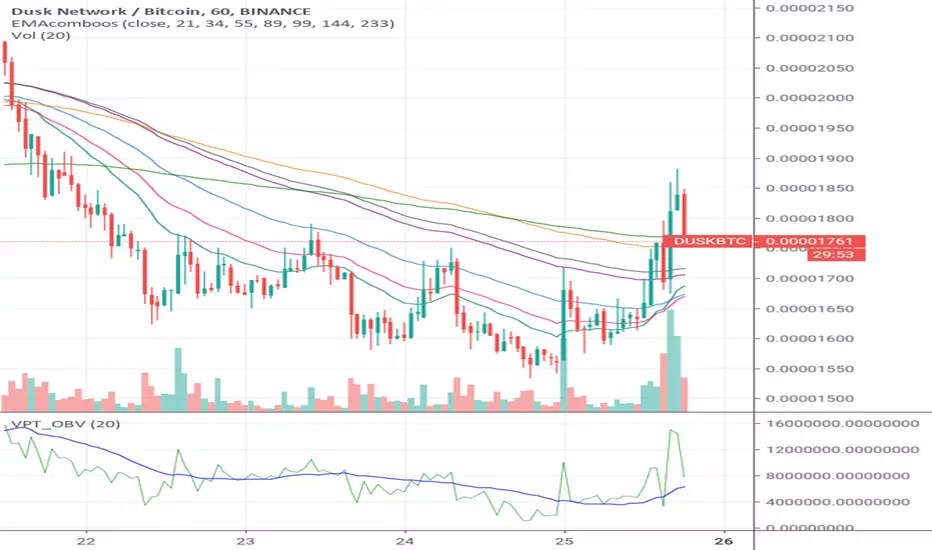
Trend Follow SystemTrend following algorithm:
We take 1- 5 Fibonacci Ema values. 21, 34, 55, 89, 144
2- We normalize the changes of these values over time between 1-100.
3- We take the ema value of 1 length so that it does not follow a horizontal course after the normalization process.
4- In order not to experience too much change, we take the value of sma with a length of 5.
5-We think that when all values are 100, the trend is up, when all values are 0, the trend is down, otherwise the trend is horizontal.
Cari dalam skrip untuk "89年属蛇运势"

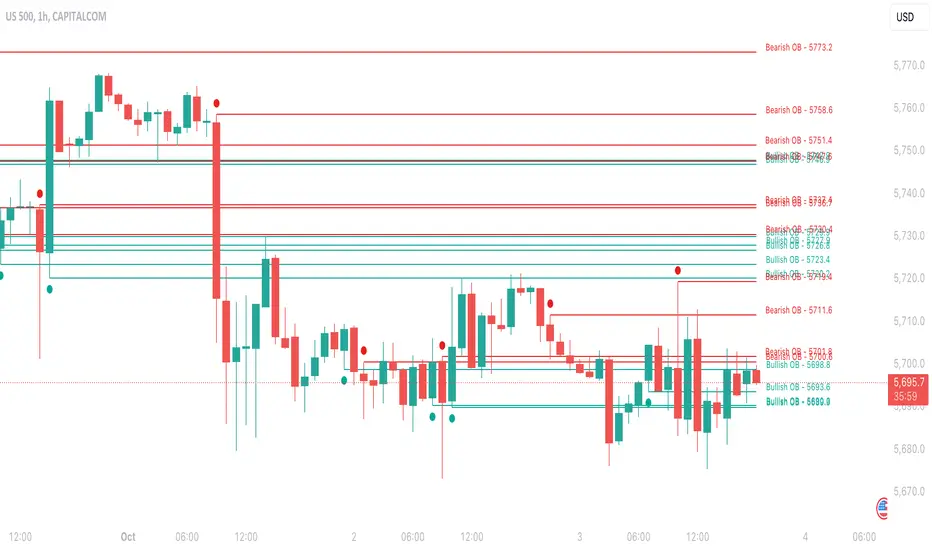
Institutional OrderBlock Pressure█ OVERVIEW
OrderBlocks are areas where Banks take a Short or Long position. So they create a movement that they would like to hide from us, but luckily for us they cannot. Take the example of Banks opening Short position for x reason. The Trend is already Bearish. The Price will fall and then make a Reversal
(most often to the price where they opened their positions) and it is at this precise moment that they will again resume a Short position twice as
large because for the moment, following this example it is not in their interest that the Price exceeds a certain Price since they are Seller.
As a result they create a solid Resistance (the strongest it is). There are several ways to interpret this logic, we can try to follow the movement of Banks
or on the contrary take advantage of the recovery of the course. Note that not having level 2 and access to the order book from TradingView we can only
make a rough estimate of the "OrderBlocks" through VPOC.
█ HOW TO INTERPRET?
• The Labels displayed by "Red Arrow" and "Green Arrow" represent supposed Bearish or Bullish OrderBlock. Note that you should not in any way interpret these "Arrows" as Signals to Buy or Sell for the reasons mentioned above.
• The OB Line works according to detected OrderBlock Candle. These lines indicate the potential recovery area. (The highlighted lines and candles are white by default).
• It is better to use this indicator on Higher TimeFrame like 2H or 4H.
• You can change the Volume Ratio (here VPOC) which is 89 by default.
• There is a Customization section that allows you to change the colors of the Lines and Candles from White to Black depending on your background color (Light or Dark).
• YES the indicator is Repainting and YES you can have False Alerts since Labels appear in intra-bar!
█ ALERTS
• In fact we don't really need Alerts for the logic of this indicator except maybe to get the Price of the last OB Detected and to keep this price in your Alert History and may use it later. Some improvements will come in future with updates and we have already planned to add Alerts when a "Line Cross" gone occur.
If you notice any bugs or if you have any suggestions, don't be hateful gangs ;)
Happy trading everyone and remember, risk management is the most important!
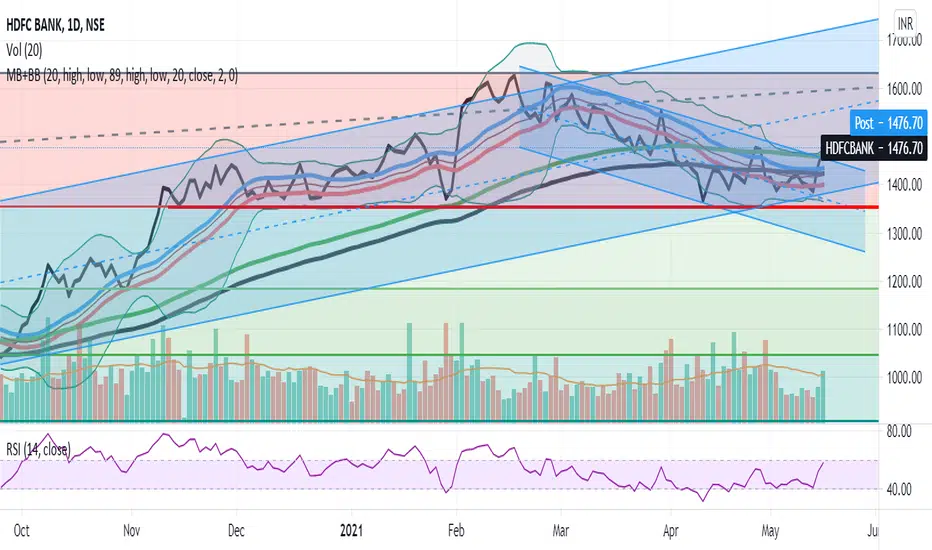
Magic BandBSE:DLF
I have integrated Moving average, Bollinger bands and Exponential moving average. It has two SMA,
The first thing is 20 SMA with blue coloured SMA line source as high and red coloured SMA line source as low, this together forms a band which can be used for a swing trade, usually useful in bull run of the stock and price tries to get support on this band.
the second thing in this is similar to the previous set up but it plots 89 period EMA, this becomes useful in the smaller timeframe when one step larger timeframe is near to 20 SMA band
the third thing is plots of Bollinger band with 20 SMA, which gives us an idea on volatility.
72s Strat: Backtesting Adaptive HMA+ pt.1This is a follow up to my previous publication of Adaptive HMA+ few months ago, as a mean to provide some kind of initial backtesting tools. Which can be use to explore many possible strategies, optimise its settings to better conform user's pair/tf, and hopefully able to help tweaking your general strategy.
If you haven't read the study or use the indicator, kindly go here first to get the overall idea.
The first strategy introduce in this backtest is one most basic already described in the study; buy/sell is when movement is there and everything is on the right side; When RSI has turned to other side, we can use it as exit point (if in profit of course, else just let it hit our TP/SL, why would we exit before profit). Also, base on RSI when we make entry, we can further differentiate type of signals. --Please check all comments in code directly where the signals , entries , and exits section are.
Second additional strategy to check; is when we also use second faster Adaptive HMA+ for exit. So this is like a double orders on a signal but with different exit-rule (/more on this on snapshots below). Alternatively, you can also work the code so to only use this type of exit.
There's also an additional feature which you can enable its visuals, the Distance Zone , is to help measuring price distance to our xHMA+. It's just a simple atr based envelope really, I already put the sample code in study's comment section, but better gonna update it there directly for non-coder too, after this.
In this sample I use Lot for order quantity size just because that's what I use on my broker. Also what few friends use while we forward-testing it since the study is published, so we also checked/compared each profit/loss report by real number. To use default or other unit of measurement, change the entry code accordingly.
If you change your order size, you should also change the commission in Properties Tab. My broker commission is 5 USD per order/lot, so in there with example order size 0.1 lot I put commission 0.5$ per order (I'll put 2.5$ for 0.5 lot, 10$ for 2 lot, and so on). Crypto usually has higher charge. --It is important that you should fill it base on your broker.
SETTINGS
I'm trying to keep it short. Please explore it further again. (Beginner should also first get acquaintance with terms use here.)
ORDERS:
Base Minimum Profit Before Exit:
The number is multiplier of ongoing ATR. Means that when basic exit condition is met, algo will check whether you're already in minimum profit or not, if not, let it still run to TP or SL, or until it meets subsequent exit condition, then it will check again.
Default Target Profit:
Multiplier of ATR at signal. If reached before any eligible exit condition is met, exit TP.
Base StopLoss Point:
You can change directly in code to use other like ATR Trailing SL, fix percent SL, or whatever. In the sample, 4 options provided.
Maximum StopLoss:
This is like a safety-net, that if at some point your chosen SL point from input above happens to be exceeding this maximum input that you can tolerate, then this max point is the one will be use as SL.
Activate 2nd order...:
The additional doubling of certain buy/sell with different exits as described above. If enable, you should also set pyramiding to at least: 2. If not, it does nothing.
ADAPTIVE HMA+ PERIOD
Many users already have their own settings for these. So in here I only sample the default as first presented in the study. Make it to your adaptive.
MARKET MOVEMENT
(1) Now you can check in realtime how much slope degree is best to define your specific pair/tf is out of congestion (yellow) area. And (2) also able to check directly what ATR lengths are more suitable defining your pair's volatility.
DISTANCE ZONE
Distance Multiplier. Each pair/tf has its own best distance zone (in xHMA+ perspective). The zone also determine whether a signal should appear or not. (Or what type of signal, if you wanna go more detail in constructing your strategy)
USAGE
(Provided you already have your own comfortable settings for minimum-maximum period of Adaptive HMA+. Best if you already have backtested it manually too and/or apply as an add-on to your working strategy)
1. In our experiences, first most important to define is both elements in the Market Movement Settings . These also tend to be persistent for whole season since it's kinda describing that pair/tf overall behaviour. Don't worry if you still get a low Profit Factor here, but by tweaking you should start to see positive changes in one of Max Drawdown and Net Profit, or Percent Profitable.
2. Afterwards, find your pair/tf Distance Zone . When optimising this, what we seek is just a "not to bad" equity curves to start forming. At least Max Drawdown should lessen more. Doesn't have to be great already, but should be better, no red in Net Profit.
3. Then go manage the "Trailing Minimum Profit", TP, SL, and max SL.
4. Repeat 1,2,3. 👻
5. Manage order size, commission, and/or enable double-order (need pyramiding) if you like. Check if your equity can handle max drawdown before margin call.
6. After getting an acceptable backtest result, go to List of Trades tab and find the biggest loss or when many sequencing loss in a row happened. Click on it to go to exact point on chart, observe why the signal failed and get at least general idea how it can be prevented . The rest is yours, you should know your pair/tf more than other.
You can also re-explore your minimum-maximum period for both Major and minor xHMA+.
Keep in mind that all numbers in Setting are conceptually in a form of range . You don't want to get superb equity curves but actually a "fragile" , means one can easily turn it to disaster just by changing only a fraction in one/two of the setting.
---
If you just wanna test the strength of the indicator alone, you can disable "Use StopLoss" temporarily while optimising settings.
Using no SL might be tempting in overall result data in some cases, but NOTE: It is not recommended to not using SL, don't forget that we deliberately enter when it's in high volatility. If want to add flexibility or trading for long-term, just maximise your SL. ie.: chose SL Point>ATR only and set it maximum. (Check your max drawdown after this).
I think this is quite important specially for beginners, so here's an example; Hypothetically in below scenario, because of some settings, the buy order after the loss sell signal didn't appear. Let's say if our initial capital only 1000$ using leverage and order size 0,5 lot (risky position sizing already), moreover if this happens at the beginning of your trading season, that's half of account gone already in one trade . Your max SL should've made you exit after that pumping bar.
The Trailing Minimum Profit is actually look like this. Search in the code if you want to plot it. I just don't like too many lines on chart.
To maximise profit we can try enabling double-order. The only added rule coded is: RSI should rising when buy and falling when sell. 2nd signal will appears above or below default buy/sell signal. (Of course it's also prone to double-loss, re-check your max drawdown after. Profit factor play its part in here for a long run). Snapshot in comparison:
Two default sell signals on left closed at RSI exit, the additional sell signal closed later on when price crossover minor xHMA+. On buy side, price haven't met our minimum profit when first crossunder minor xHMA+. If later on we hit SL on this "+buy" signal, at least we already profited from default buy signal. You can also consider/treat this as multiple TP points.
For longer-term trading, what you need to maximise is the Minimum Profit , so it won't exit whenever an exit condition happened, it can happen several times before reaching minimum profit. Hopefully this snapshot can explain:
Notice in comparison default sell and buy signal now close in average after 3 days. What's best is when we also have confirmation from higher TF. It's like targeting higher TF by entering from smaller TF.
As also mention in the study, we can still experiment via original HMA by putting same value for minimum-maximum period setting. This is experimental EU 1H with Major xHMA+: 144-144, Flat market 13, Distance multiplier 3.6, with 2nd order activated.
Kiwi was a bit surprising for me. It's flat market is effectively below 6, with quite far distance zone of 3.5. Probably because I'm using big numbers in adaptive period.
---
The result you see in strategy tester report below for EURUSD 15m is using just default settings you see in code, as follow:
0,1 lot for each order (which is the smallest allowed by my broker).
No pyramiding. Commission: 0.5 usd per order. Slippage: 3
Opening position is only using basic strategy #1 (RSI exit). Additional exit not activated.
Minimum Profit: 1. TP: 3.
SL use: Half-distance zone. Max SL: 4.5.
Major xHMA+: 172-233. minor xHMA+: 89-121
Distance Zone Multiplier: 2.7
RSI: Standard 14.
(From our forward-testing, the difference we get from net profit is because of the spread, our entry isn't exactly at the close/open price. Not so much though, but not the same. If somebody can direct me to any example where we can code our entry via current bid/ask price, that would be awesome!)
It's already a long post (sorry), think I'm gonna pause here. Check out the code :)
---
DISCLAIMER: Past performance is no guarantee of future results , and so on.. you know the drill ;)
Please read whole description first before using, don't take 1-2 paragraph and claim it's the whole logic, you are responsible of your own actions and understanding.

Fibonnaci Moving Averages by WaspeRIn this script you will find a preset of 7 moving averages - 8,13,34,55,89,144,233 based on Fibonacci progression.
You can select between - SMA, EMA, WMA, RMA and HMA.
You have input options for period, type and source and you can modify the parameters based to your needs.
I am new to pine coding and this is my first script. Comments and feedback are welcome.

EMA TrendThe purpose of this script is to identify price trends based on EMAs. The relative position of price to specific EMAs and the position of certain EMAs towards each other are used to determine the trend direction. The script is intended for investors as a tool to define a basis for further evaluation. I do not use the script as a signal generator and would not recommend doing so without the help of additional indicators.
How to work with the script
The major (or long term) trend direction is determined by the 144 EMA much in the same way as the 200 MA is used in other systems. If the price is above the 144 EMA we are in a long term uptrend, below we are in a long term downtrend. This is to be taken with a grain of salt though. The 144 EMA is considerably shorter than the 200 SMA and is more prone to the price fluctuating around it during periods without a strong long term trend. I recommend using this as a confirmation for the short term trend.
The short term trend is derived from the position and slope of the price, the 21 EMA and the 55 EMA. If the price is above the 21 EMA, the 21 above the 55 EMA, both EMAs are sloping upwards and the distance between the two is increasing, we are talking about an uptrend (and vice versa for a downtrend). This is visualized by the color of the fill between the 144 EMA and close price. Green for uptrend, red for downtrend and no color for an undetermined trend.
The EMAs used are: 21 , 34 , 55 , 89 , 144 , 233 . Most of the EMAs are at 50 transparency to appear less dominant. For orientation, the 144 EMA is bright green to indicate its general importance for the trend determination, and the 55 EMAs is not transparent mainly to be able to identify positioning when the EMAs are close together.
Base time frame EMA
The 144 EMA is plotted twice where one is fixed to the daily time frame (can be configured) to be able to have the 144 on different timeframes during analysis. I find this very useful to keep the focus on my main time frame while analyzing trend on lower or higher time frames. This can also be turned off.
Configurability
This script is less configurable than I generally like with my other scripts. The reason is that the title attribute of the plots is not dynamic, and I use the data window often to get exact values from the script to determine buy targets for pullbacks and other things. Hence, I prefer not to have random names (or no names) in there to save mental capacity. If this ever becomes available, I'll gladly add this to this script. Till then, I encourage you to take the script and adjust it to your own needs. It should be simple enough even if you are just starting out in pine.

[THETA] Tema Hema Evwma Trade ActionTHETA
Is an Intraday Strategy Indicator, To be used over 1 minute chart and in conjunction with built in pine indicator Pivot Point Standard, {Fibonacci One}
I came across this Strategy Indicator while reading through the Forex Trading Journals, and thought of sharing you guys
The Indicator Comprises of amalgamation of
TEMA : Triple Exponential Moving Average
HMA : Hulls Moving Average
EVWMA and EMA: Elastic Volume weighted Moving Average and Exponential Moving Average
Filter Action by Rajandran R Supertrend
So
Theta = ( tema(src, length) + hma(src, length) + ema(src, length) + evwma(src, length) )/4
The lengths in use are: 8,21,34,55,89,144,233,610
How to Use
Use on 1 min chart for best results
UsE in Conjuction with Fibonacci Pivot Points, (.which is present in option of built in pine indicator : Pivot Point Standard )
Provision For Alert
Long theta Signal
Short theta Signal
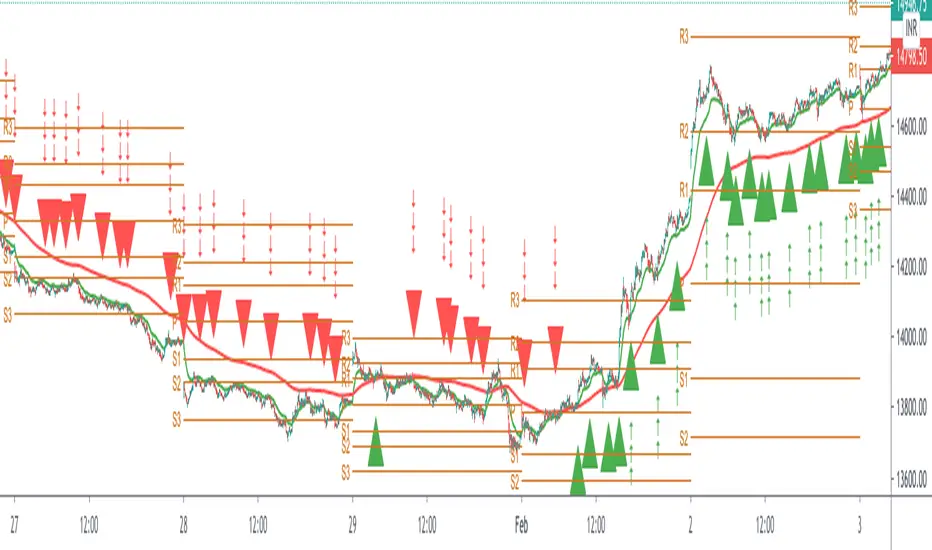
FibBand, Perfect Trendline Trader and Target SystemSo, Dear Friends, I am open-sourcing one of my scripts which I created as a thesis project,
The Auto Trader System is a Scalping Tool , to be used mostly in intraday Setups!!
and is designed using,
1. Fibonacci Bands
Fibo Bands are Calculated by defining dynamic Fibonacci Pivots Lines over a history of Lookup values (Default is 89 periods lookback),
The bands help in identifying the Target Points for the setup
2. Perfect TrendLine Setup
The script uses PTS, as a filter to define the optimum entry and exit points
Which timeframe it works for ?
Works for Any Time Frame, but Intraday setups are good!
Who is this System for ?
Beginner and Intermediate Traders
Provision For Alerts
The Script has provision for both long and short alerts!!
Enjoy!
Trend Line Fibonacci [TLF]TLF is a price based Adaptive Scalping Indicator ideally to be used over lower timeframes
1min, 5min,.... 30 min
Its made using pivot calculations of fibonacci lookback lengths, which gives it an adaptability
default lookback lengths are:
55,89,144,233
This indicator is a pine script clone of Trend Line Fibonacci as available in MT4
google search ( prorealcode , trend line fibonacci )
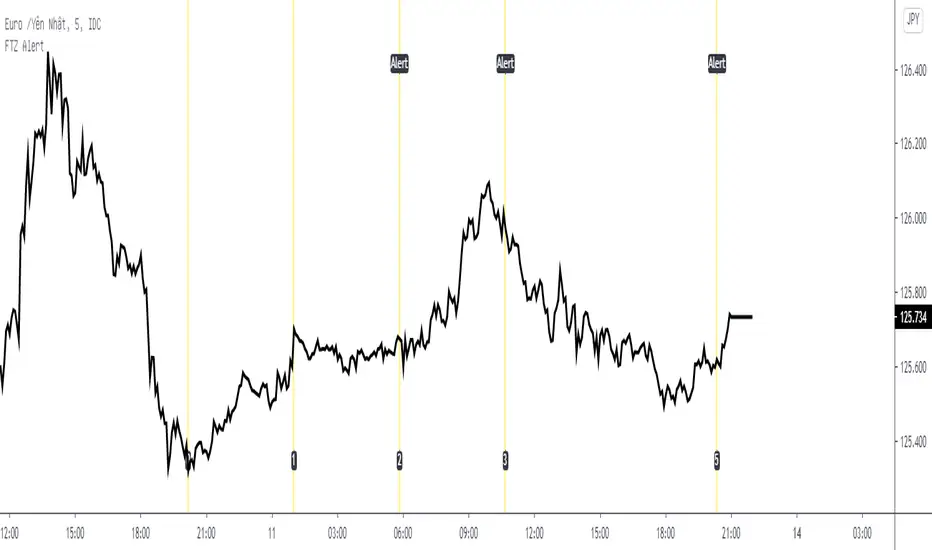
Fib Time Zone with Alert* Fib Time Zone with Alert will draw a series of vertical lines on chart. They are spaced at the Fibonacci intervals of 1, 2, 3, 5, 8, 13, 21, 34, 55 and 89. Trader defined the zero line and the 1 line, then Fib Time Zone with Alert auto draw the rest and display alert when price touch the line.
* Alert condition available in the Create Alert dialog box with title "Fib Time Zone Alert".
* Line 0 was defined by Date, Month, Year, Hour, Minute (use Exchange Timezone).
* Line 1 was defined by number of bars between Line 0 and Line 1.
* Line 2,3,5,8,13,21,34,55 and 89 auto draw.
Hyper Frame Fibo MA RibbonsIntroduction
Moving averages are an integral part of the TA world. There are different types of moving averages and each person uses them depending on their strategy and market conditions.
Meanwhile, the main variable in calculating the averages is their LENGTH. This value is optional, but not every value is applicable.
After much experience in the world of financial markets, I came to the conclusion that although the most popular length values are 20, 50, 100, and 200, the Fibonacci number come with surprising results .
Description
The following script calculates seven averages with the length of Fibonacci numbers (34, 55, 89, 144, 233, 377 and 610) with the formula of your choice (SMA, EMA, WMA, HMA) and shows that we named it FiboMa .
You can also have Bollinger Bands with the desired frame at the same time.
This is not the whole story...
You can see the same values from smaller or larger frames at the same time!
We named this feature Hyper Frame Vision .
It is possible to display values for FiboMa up to three hyper frames (with the main frame a total of 4 levels) and in the Bollinger Bands one hyper frame (with the main frame a total of 2 levels).
By default, the display of FiboMa hyper frame values is limited to the last 10 bars, which you can change to an arbitrary value by changing the source code.
The display of hyper frame values is not limited for Bollinger Band.
What is its use? What is it good for?
Support and Resistance
Using dynamic support / resistance is much smarter than static! This protects you from the risk of many fake breaks, and your profit and loss limits will be more flexible and more efficient.
The intersection of FiboMa ribbons are potential points of support / resistance.
We use colors to easily identify supports / resistances.
Any average lower than the price is assumed as support and displayed in green, and any average above the price is assumed as resistance so displayed in red.
So the color of the averages is dynamic.
The color of FiboMa is a range from red to green. Whatever colors get saturated , the lenght is longer and the more power it has as support / resistance.
Volatility
With this script, you also have the ability to monitor the amount of market volatility ! The combination of Bollinger Bands and FiboMa provides a clear view of the market volatility.
The decrease and compression of the FiboMa width is a sign of a decrease in volatility and vice versa.
Trend
I don't see the need for additional explanation, only whenever the price is higher than the middle band , the BB cloud is green , and whenever it is lower , is red .
The wider FiboMa means the stronger trend.
How to use
In the script settings you have the ability to enable or disable anything except.
---------------------------------------------
Similar scripts have been published before and we were inspired by them and tried to improve idea and code uniqe one.
I hope it will be useful .. Support us with your likes and comments .. We have anothers great script .. Just started.

Trend Following with Moving AveragesHello Traders,
With the info "Trend is Your Friend ", you should not take position against the trend. This script checks multipte moving averages if they are above/below the closing price and try to find trend. The moving averages with the length 8, 13, 21, 34, 55, 89, 144, 233, 377 used. these are fibonacci numbers, but optionally you can change the lengths of each moving averages. while it's green you better take long positions, while it's red you better take short positions according to other indcators or tools.
Optionally you have "smoothing" option to get rid of whipsaws. it's enabled by default.
You have option to use following moving average types: EMA, SMA, RMA, WMA, VWMA. by default it's EMA
Also the script has "Resolution" option. with this option you can get the trend for other time frames, in following example 1h was set as for higher time frame on 15m chart:
This should not be used as buy/sell signal indicators as it's tries to find trend but not entry points, you should use other indicators (such RSI, Momentum) or other tools to find buy/sell signals.
Enjoy!

Ultimate Moving Averages (SMA & EMA)Welcome to the Ultimate Moving Average indicator.
Never again spend time looking for EMA / SMA indicators when you can have them all in this single indicator.
Options include :
Daily Chart: Classic Golden / Death Cross - 50/D and 200/D SMA
Daily Chart: 3-day Golden / Death Cross - 150/D and 600/D SMA
Daily Chart: 140/D SMA
Daily Chart: 700/D SMA
Daily Chart: 1458/D SMA
Daily Chart: Golden Ratio Multiplier
Any Chart: Scalping
9 SMA
10 SMA
20 SMA
21 SMA
30 SMA
34 SMA
50 SMA
80 SMA
100 SMA
200 SMA
8 EMA
10 EMA
13 EMA
20 EMA
21 EMA
26 EMA
30 EMA
34 EMA
50 EMA
55 EMA
80 EMA
89 EMA
100 EMA
200 EMA

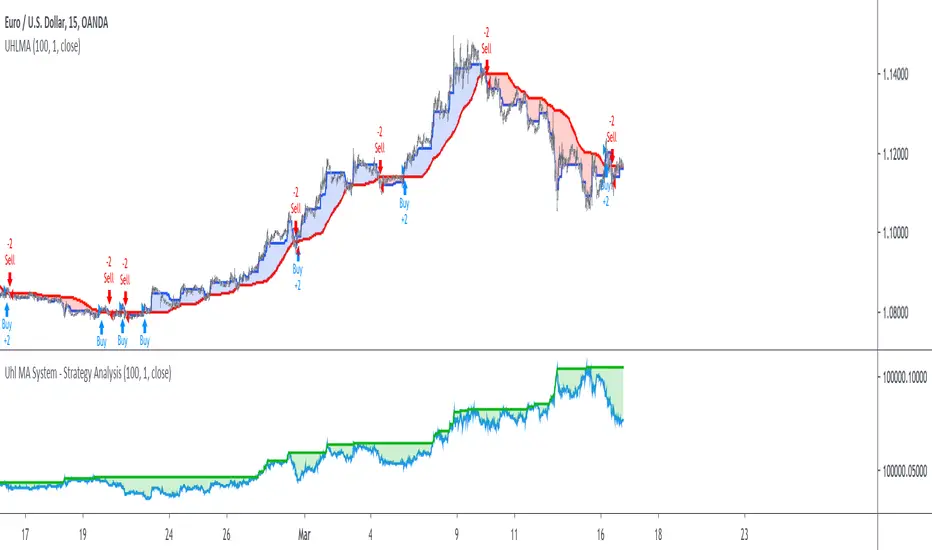
Uhl MA System - Strategy AnalysisThe Uhl MA crossover system was specifically designed to provide an adaptive MA crossover system that didn't committed the same errors of more classical MA systems. This crossover system is based on a fast and a slow moving average, with the slow moving average being the corrected moving average (CMA) originally proposed by Andreas Uhl, and the fast moving average being the corrected trend step (CTS) which is also based on the corrected moving average design.
For more information see :
In this post, the performances of this system are analyzed on various markets.
Setup And Rules
The analysis is solely based on the indicator signals, therefore no spread is applied. Constant position sizing is used. The strategy will be backtested on the 15 minute time-frame. The mult setting is discarded, the default setting used for length is 100.
Here are the rules of our strategy :
long: CTS crossover CMA
short: CTS crossunder CMA
Results And Data
EURUSD:
Net Profit: $ 0.08
Total number of trades: 99
Profitability: 35.35 %
Profit Factor: 1.834
Max Drawdown: $ 0.01
EURUSD behaved pretty well, and was most of time showing long term trends without exhibiting particularly tricky structures, the moving averages still did cross during ranging phases, since march 9 we can see a downtrend with more pronounced cyclical variations (retracements) that could potentially lead to loosing trades.
BTCUSD:
Net Profit: $ 4371.57
Total number of trades: 94
Profitability: 32.98 %
Profit Factor: 1.749
Max Drawdown: $ 1409.96
The strategy didn't started well, producing its largest drawdown after only a few trades, the strategy still managed to recover. BTCUSD exhibited a strong downtrend, the strategy profited from that to recover, signals still occurred on ranging phases, and where mostly caused by a short term volatile move, unfortunately the CMA can converge toward ranging/flat price zones where false signals might occur at higher frequency.
AMD:
Net Profit: $ 16.09
Total number of trades: 95
Profitability: 29.47 %
Profit Factor: 1.288
Max Drawdown: $ 20.11
On AMD the strategy started relatively well with a raising balance, then the balance quickly fallen, this downtrend in the balance lasted quite some time (almost 48 trades), the strategy finally recovered in Nov 2019 and the balance made a new highest high at the end of February. AMD had numerous trends during the backtesting period, yet results are poor.
AAPL:
Net Profit: $ -28.17
Total number of trades: 89
Profitability: 28.09 %
Profit Factor: 0.894
Max Drawdown: $ 63.21
AAPL show the poorest results so far, with a stationary balance around the initial capital (in short the evolution of the balance is not showing any particular trend and oscillate around the initial capital value).
AAPL had some significant retracements in its up-trend, which triggered some trades (of course), and the ranging period from Jan 24 to Feb 13 heavily damaged the strategy performance, generating 6 significant loosing trades. AAPL show the worst results so far, mostly due by ranging phases.
Conclusions
The Uhl MA crossover system strategy has been tested and based on the results don't show particularly interesting performances, and might even be outperformed by simpler MA systems that prove to be more robust against ranging markets. The total number of executed trades are on average 94, and the profitability is on average 31%. The strategy might prove more interesting if we can correct the behavior of the CMA, who sometimes converged toward ranging/flat markets.
Moving Average ChannelThis script display three moving average channels,
main channel (EMA144, EMA169), second (EMA288, EMA338), third (EMA576, EMA676)
This channels can act as support/resisitance, a trade can be setup when price enter and then leave the channel.
There are also other moving averages base on FIbnacci numbers ( 13,21,34,55,89,144,233....), you can use it if you like.
This channels is base on idea of Vegas Tunnel Strategy developed by Vegas.
DPO RMA STRATEGYThis strategy uses tradingview's built-in "Detrended Price Osciilator" ( DPO )indicator script.
It takes the average of 6 different fib lookback periods. (55,89,144,233,377,610)
This is plotted in the purple line.
It then takes the RMA of the DPO and uses the RMA's to determine entry points with crossovers and crossunders.
It's an extremely easy indicator to use. You mostly only need to adjust the last 2 inputs (These are the RMA Smoother inputs)
Works well with most any market and with any timeframe.
Works great on Heiken Ashi if you keep orders under 150. But I can't post in heiken ashi format thanks to automated traders complaining to tradingivew that they can't make any money with heiken ashi candles
And then pine coders like this that are embraced with high regard because they realized that they can spam a heiken ashi chart with over 400 trades and magically it has excessive slippage.

Number StrategyA simple strategy based on fib ratios and numbers
Best time frames for highest accuracy ( Requires Tradingview Pro )
34 mins for quick scalps
89 mins for weekly Swings
254 mins for monthly swings
-Ability to set alerts for btc and $ singals
-Modify Ema values, Set colour
-Trend following strategy, Needs an active trend for best results
-sideways/choppy action results in bad signals
How to trade:
-----------------
Long if Btc signal appears , preferred if price is trading above the 233 EMA .
You can use the 233 EMA for activating trades during price retest
Short if $ signal appears , preferred if price is trading Below the 233 EMA .
You can use the 233 EMA for activating trades during price retest

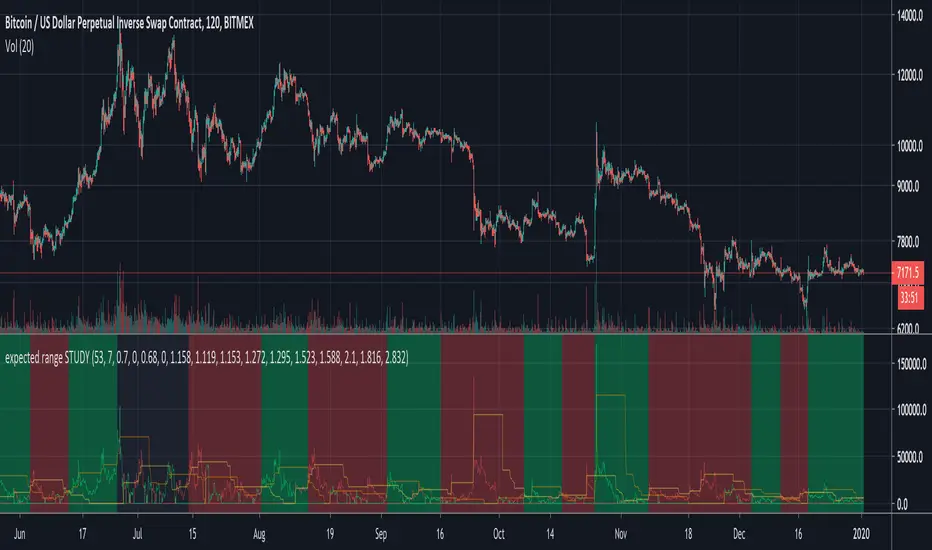
expected range STUDYThis is an indicator that measures how much price movement (low to high) we've seen in a set of 1 bar back, 2 bars back, 3 bars back, 5 bars back, 8 bars back using the Fibonacci sequence up to 89 bars back, and then measures how low or high within each range we are, sort of like giving a rating of 0 for sitting on the lower Bollinger Band and a rating of 100 for sitting on the higher Bollinger band. It combines all the data and weights the data by the historical strength of signal from each length of bands. It's been tuned to a 2 hour XBTUSD chart, but it could be used on other things and other timeframes too. Some tweaking would be needed, though. The final result works more like a trend following indictor than and indicator that tries to pick an exact trend reversal point. However, you're free to use it how you want. Frequently you get a nice red or green spike up showing you when the bottom or top is in, but sometimes those spikes are just the start of an extended down move or up move.
On the chart, a buy (long) signal is generated when the green line crosses up above the orange line. To make it extra clear the background is green when you should be long. A sell (short) signal is generated with the red line crosses up above the yellow line. The background will be red when you should be short. If the background is black, it's indicating a profit of over 53% was taken and it's waiting for another trade to start. Up to you to take profit or keep riding your trade.
For XBTUSD trades, a full take profit on any trade exceeding 53% gains works nice (on 1x leverage) and a stoploss of -7% works quite nicely too. One could use this on up to 2x leverage but I wouldn't recommend going much higher. Have fun. Trade carefully. Don't get rekt.
I will release the "expected range STRATEGY" to go along with this so you can do your own backtesting.
Disclaimer: I haven't tested the alerts, but they should work. Use at your own risk.
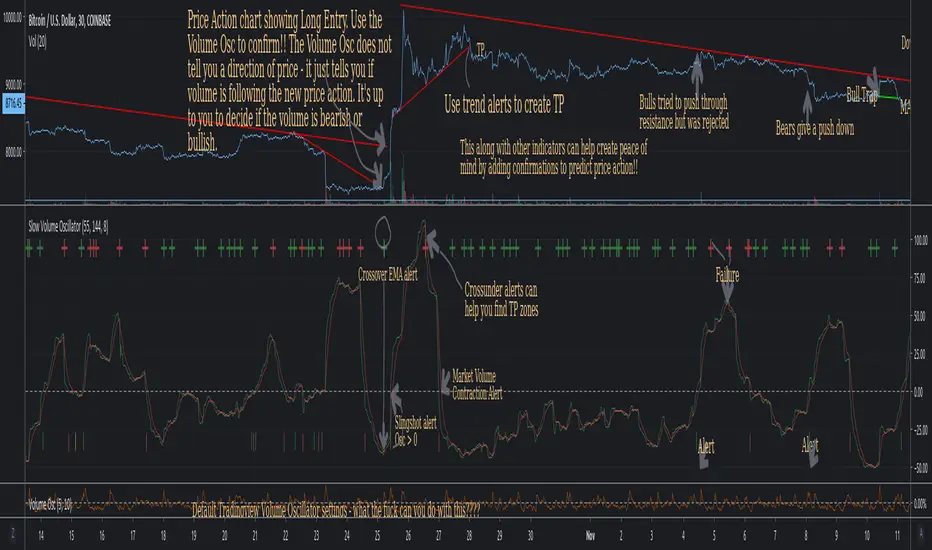
Slow Volume Oscillator Indicator - Just a Better Way To TradeThis script is nothing new. However, I feel that traders do not know the full potential it can provide if they just increase the lookback periods.
Tradingview's default Vol Osc uses a fast setting of 5 and a slow setting of 10. It just paints pointless scribbling. Slow all your indicators down and wake up to a whole new world of Technical Analysis.
To create consistency with variables I typically use Fib numbers for lookback periods. (3,5,8,13,21,34,55,89,144,233,377,610,987)
As noted in chart. An increase in volume can be either bullish or bearish. It's up to you to decide which way price action will move.
If you use with other indicators you can create more confirmations.
More confirmations = peace of mind
My favorite indicators are (Detrended Price Oscillator, Momentum, MACD, Chaikin Money Flow, Ultimate Oscillator, and this Volume Oscillator)
Here is just one example of MACD strategy indicator that can be used with this Vol Oscillator
Rhaps SMAEMA Combo v1.1There's many versions of this sort of thing around the Tradingview library, but i guess we all like things to our own specifications.
So this is my take on the SMA and EMA version combined.
Bunch of SMA's & EMA's, with labels, and G&D Cross Labels and Alerts.
These values can of course be changed to any you may prefer.
Rhapsodyy's Combo SMAEMA's v1.1
SMA's with Painted Labels : 10/30/50/80/200
EMA's with Painted Labels : 21/50/89/200/377
50SMA / 200SMA Golden & Death Crosses on Current Timeframe & Alerts
Daily 50SMA / 200SMA Golden & Death Crosses overlayed onto Current Timeframe & Alerts
50EMA / 200EMA Golden & Death Crosses on Current Timeframe & Alerts
Daily 50EMA / 200EMA Golden & Death Crosses overlayed onto Current Timeframe & Alerts

FibMAThis study visually demonstrates Fibonacci moving averages.
The darker the color, the stronger the signal is for either buying or selling.
Buys/Sells only take place when each moving average is above/below the its adjactent fibonacci sequence, i.e 5<8<13<21<34<55<89<144 for buying..
Alerts are provided as BUY ASSET and SELL ASSET.
Multiple moving averages are also provided.