EMA/SMA Support/Resistance Levels////////////////////////////////////////////////////////////
// saxonlucius 07/08/2019
// EMA/SMA Major Support/Resistance levels
////////////////////////////////////////////////////////////
The script contains major support/resistance EMA's and SMA's.
This includes:
EMA
EMA 21
EMA 34
EMA 50
EMA 89
EMA 100
EMA 200
EMA 377
SMA
SMA 10
SMA 100
SMA 200
SMA 900
The EMA 34 and SMA 900 are not as relevant as the others.
Cari dalam skrip untuk "89年属蛇运势"

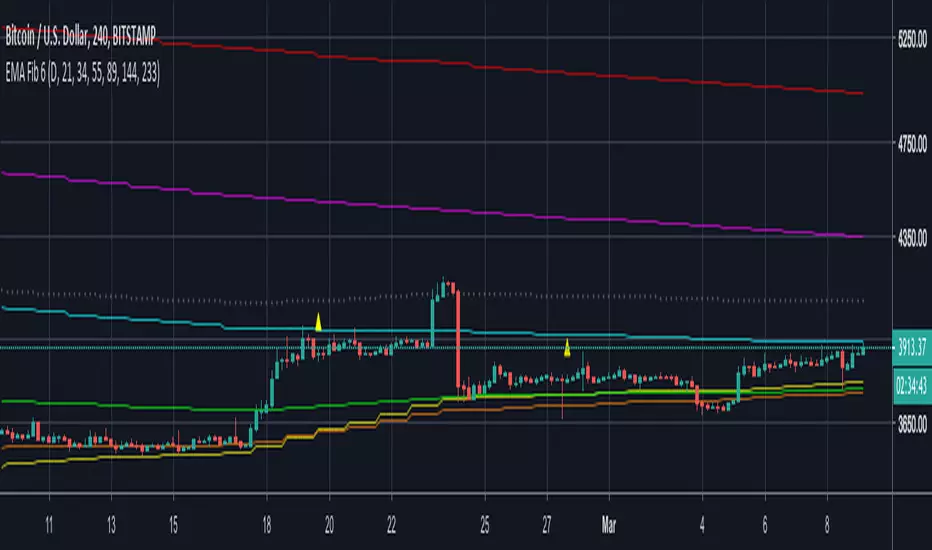
Nine Fibonacci EMAsAre you running short on available indicators in your chart?
Here you get 9 EMAs of the fibonacci sequence in one ;)
EMAs 8, 13, 21, 34, 55, 89, 144, 233 and 377.

Moving Averages & Bollinger Bands with ForecastsMoving Averages & Bollinger Bands with Forecasts
11 Moving Averages
SMA, EMA, WMA
Highly Customizable
Linear Regression Forecast
Bollonger Bands
Personal Setup: Add indicator twice
1st indicator = SMA using #4, 7, 10, 11 (20, 50, 100, 200 SMAs) with bollonger bands on 20.
2nd indicator = EMA using #1, 2, 3, 5, 6, 8, 9 (5, 8, 13, 21 ,34, 55, 89 EMAs).
This allows easy toggling between SMAs/Bolls and Fib EMAs
Thank you to yatrader2 for the forecast code


4SMA Fibonacci 55/89/223/610just noticed the correlation of SMAs and fibonacci on my charts.
maybe it will help you to.


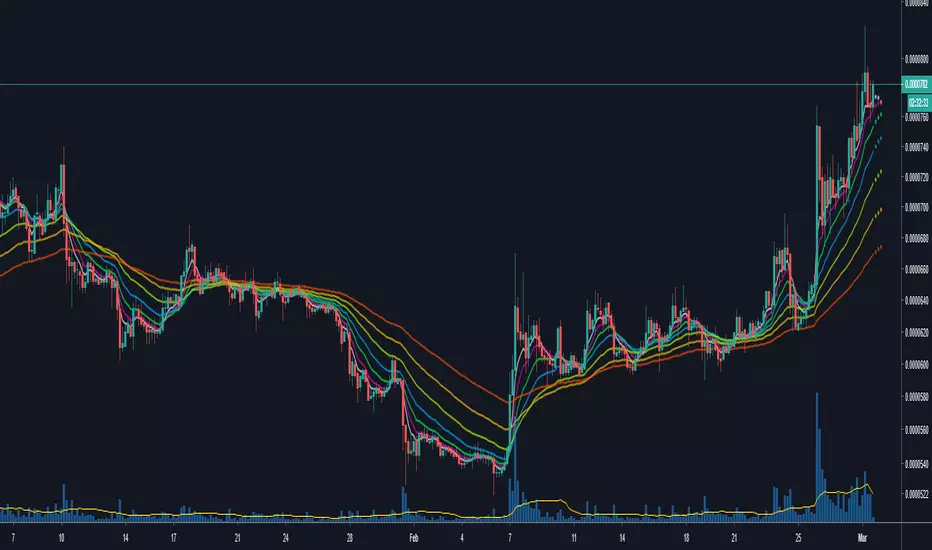
The Scale Of Sacred SoundsBased on the Sacred Sound Scale
How to use it:
This indicator is designed to capture the inferred behavior of traders and investors by using two groups of averages.
Meant for longer trades and trend indicator.
Used on any timescale as needed.
Can trade on long or short where the slow MA crosses fast Ma or where the Slow MA compresses and flips open again.
Follow the trend to the end - pot of gold at the end of the rainbow :-)
References:
Based on Daryl Guppy GMMA and
www.guppytraders.com
Read more at:
whatmusicreallyis.com
There is one tuning in which the frequencies 432, 528, 424 and 440 Hz can peacefully coexist. The scale has 32+1 pure harmonic tones and the reference frequency of 256 Hz. It comes from the Natural Ascending Series of Harmonics 32 to 64 of the 8 Hz Fundamental Tone, and represents its 6th double. I call this tuning The Scale of Sacred Sounds.
Representation using ancient Sumerian/Babylonian/Vedic math:
32; 33; 34; 35; 36; 37; 38; 39; 40; 41; 42; 43; 44; 45; 46; 47; 48; 49; 50; 51; 52; 53; 54; 55; 56; 57; 58; 59; 60; 61; 62; 63; 64
Representation using musical ratios:
1/1; 33/32; 17/16; 35/32; 9/8; 37/32; 19/16; 39/32; 5/4; 41/32; 21/16; 43/32; 11/8; 45/32; 23/16; 47/32; 3/2; 49/32; 25/16; 51/32; 13/8; 53/32; 27/16; 55/32; 7/4; 57/32; 29/16; 59/32; 15/8; 61/32; 31/16; 63/32; 2/1
The math for deriving one of the above series from the other is simple. Divide all numbers from the ancient series by the first, then simplify the fractions. Conversely, the series of ratios can be turned into the series of integers by calculating their least common denominator (the smallest whole number that is a multiple of all numbers under the fraction bar) and discarding it.
Logarithmic representation using musical constants (definition given further down):
0,000; 30,772; 60,625; 89,612; 117,783; 145,182; 171,850; 197,826; 223,144; 247,836; 271,934; 295,464; 318,454; 340,927; 362,905; 384,412; 405,465; 426,084; 446,287; 466,090; 485,508; 504,556; 523,248; 541,597; 559,616; 577,315; 594,707; 611,802; 628,609; 645,138; 661,398; 677,399; 693,147

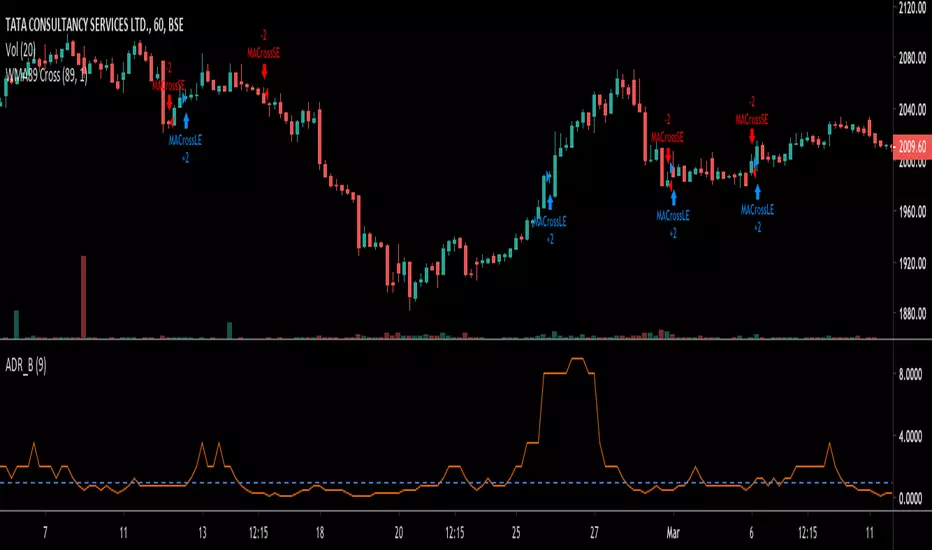
Flying Buddha Inside Bars Indicator v1 by JustUncleLDescription:
=============
This indicator plots MAs and paints Triggered Alert Arrows base on Flying Buddha candle patterns.
The “Flying Buddha” Pattern is defined as:
---------------------------------------------
A candlestick chart with two moving averages: the 5 period exponential moving average (fast EMA) and the 10 period simple moving average (slow SMA), both applied to the closing price. The default “Flying Buddha” pattern is any candlestick which:
1. Has a LOW above the fast EMA, when the fast EMA is above the slow SMA (a bearish “Flying Buddha”); or
2. Has a HIGH below the fast EMA, when the fast EMA is below the slow SMA (a bullish “Flying Buddha”).
Alert Trigger:
---------------
A Flying Buddha Alert is triggered on the first candle that is a non-flying Buddha candle after a Flying Buddha Pattern candle sequence. Flying Buddhas can optionally be filtered by InsideBars and PinBars.
The Alert Trigger is optionally filtered by the Directional MA (default=EMA 89), and/or by Minimum Sequence length of Flying Buddhas.
Moving Averages:
------------------
You can select between 11 different types of moving averages, for each MA line in Flying Buddha MAs (fastMA and slowMA) and the Directional Filter MA:
SMA = Simple Moving Average.
EMA = Exponential Moving Average.
WMA = Weighted Moving Average
VWMA = Volume Weighted Moving Average
SMMA = Smoothed Simple Moving Average.
DEMA = Double Exponential Moving Average
TEMA = Triple Exponential Moving Average.
HullMA = Hull Moving Average
SSMA = Ehlers Super Smoother Moving average
ZEMA = Near Zero Lag Exponential Moving Average.
TMA = Triangular (smoothed) Simple Moving Average.
NOTE: This is a concept indicator, I also intend to release a trading BOT suitable for Autoview, based on this concept indicator.

Kendall Rank Correlation CoefficientKendall Rank Correlation Coefficient script.
This way to measure the ordinal association between two measured quantities described by Maurice Kendall (1938, Biometrika, 30 (1–2): 81–89, "A New Measure of Rank Correlation").
In this script I compare Kendall Coefficient and Pearson Coefficient (using built-in "correlation" function).

AIO EMA by bacoskunAIO EMA script contains EMA 8,13,21,34,55,89,144,200,233 together..
You can change each EMA period whatever you want
and can visible/invisible what you needed with select/deselect checkbox

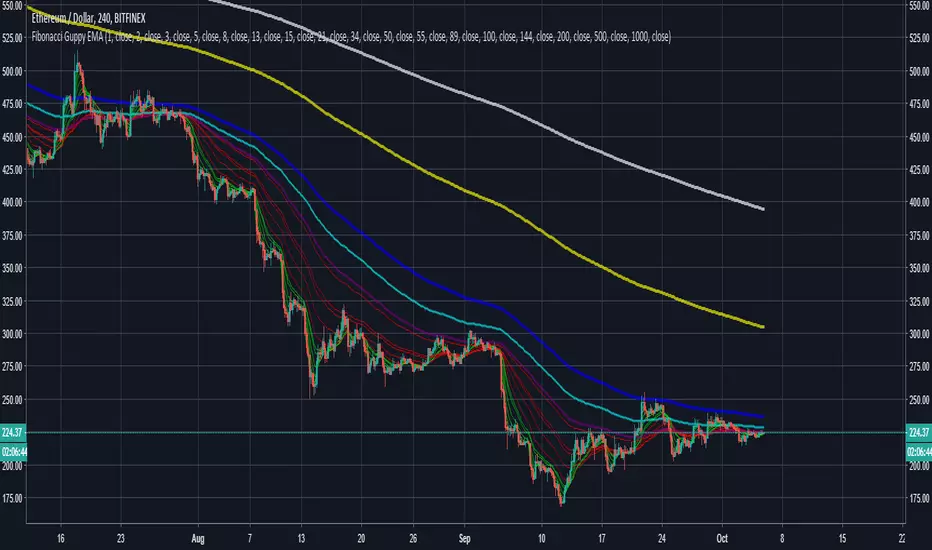
Fibonacci Guppy EMAGuppy EMA that uses fibonacci numbers instead of standard guppy numbers.
EMA's used: 1, 2, 3, 5, 8, 13, 15, 21, 34, (50), 55, 89, (100), 144, (200), (500), (1000)
Multiple Ema 34(low-close-high)/89/987 by Feng3 EMA trading H1
1 EMA trading D1
1 EMA trading Up/Down trend


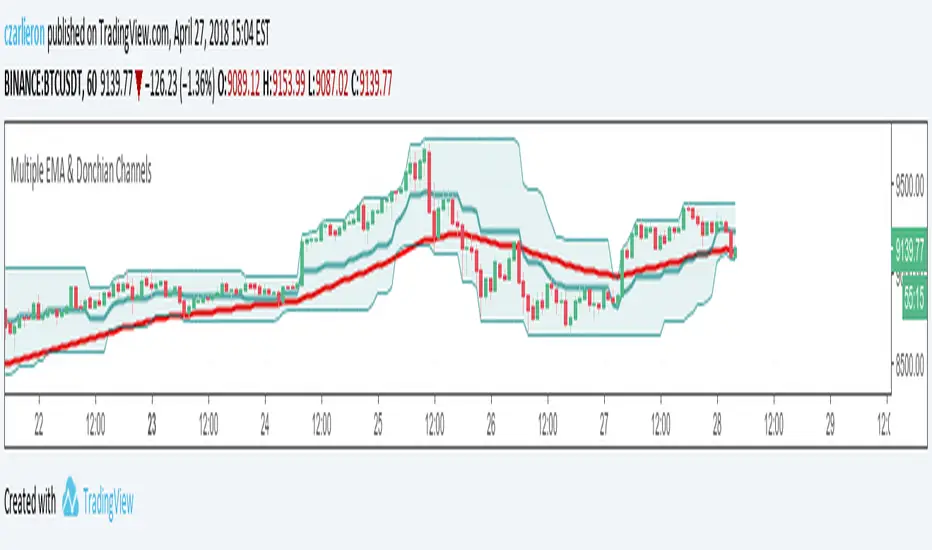
My Multiple EMA with Donchian ChannelsDonchian Channels with EMA's 8, 13, 21, 34, 55, 89 (fib numbers). Everything is configurable.
Fibonacci-based Exponential Moving AveragesFibonacci-based exponential moving averages 21/34/55/89/144/233