MAX MA FibonacciIn un unico indicatore visualizza 4 medie mobili di default (55, 89, 144, 233) numeri di Fibonacci
Cari dalam skrip untuk "89年属蛇运势"
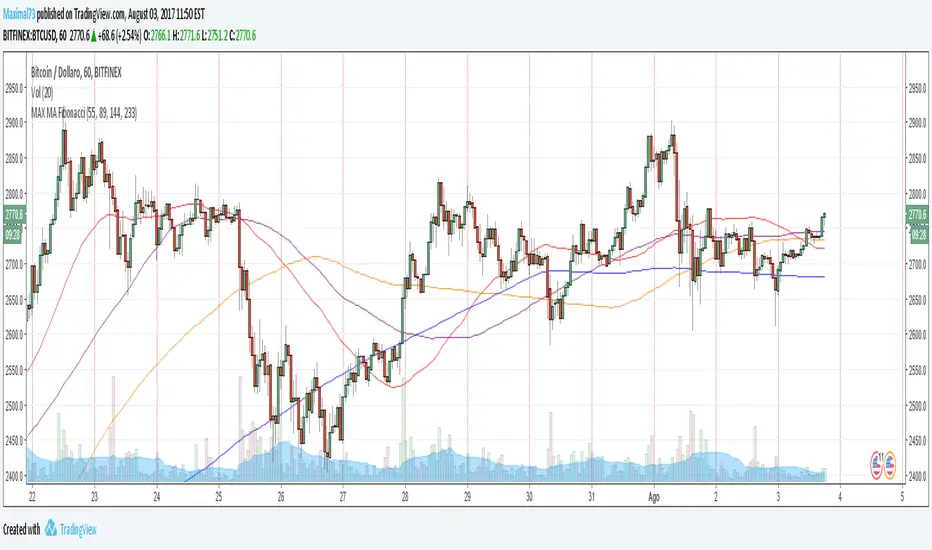
MAX Medie Mobili FibonaciVisualizza 4 Medie Mobili in un indicatore di default (55, 89, 144, 233) serie di Fibonacci

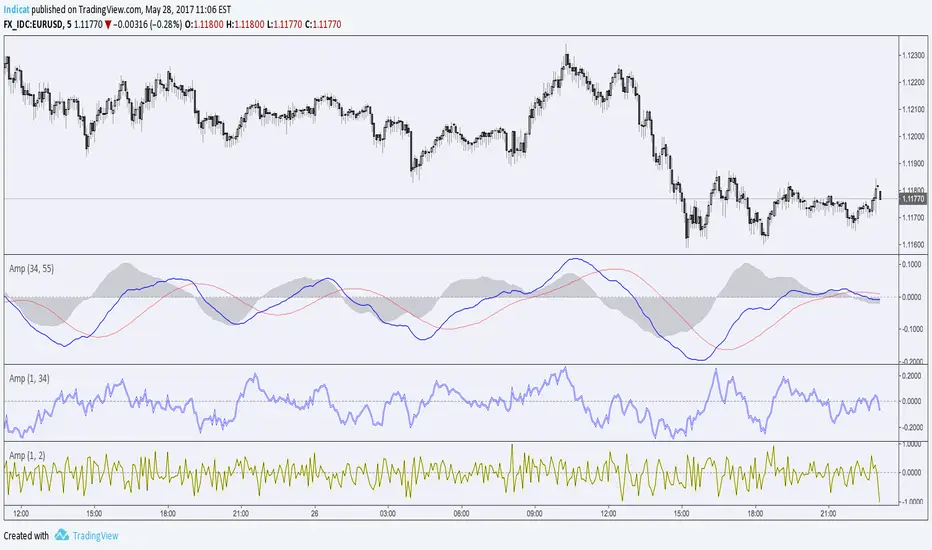
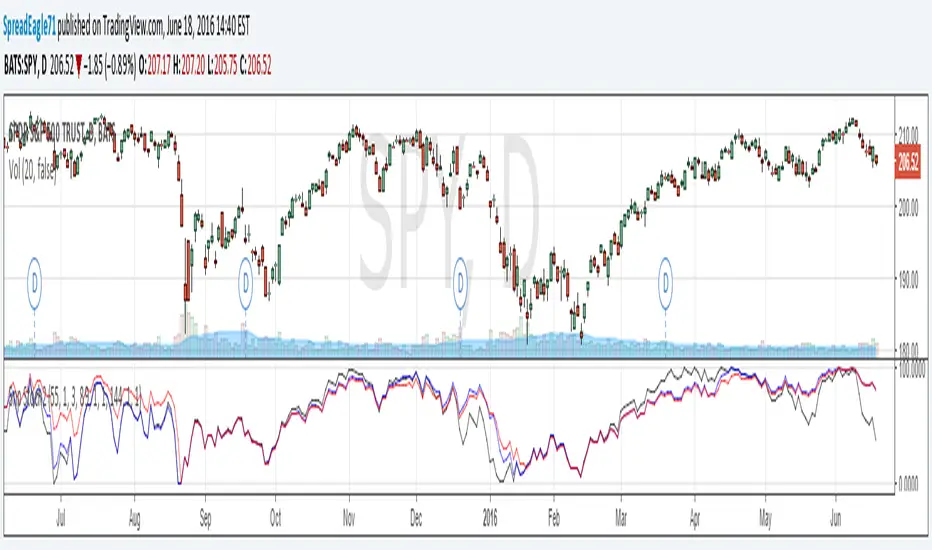
Amplitude IndicatorHello Traders,
Amplitude is the measurement of the difference between the variable's extreme values.
This indicator is based on the Balance of Power (close-open)/(high-low).
Instead of taking the value of a single candlestick, exponential moving averages are used in the formula.
On it's lowest settings (1,2) it's exactly the same as the Balance of power, by adjusting the smoothing you can seen the highs and lows in momentum of the chosen period. (highly adjustable RSI)
By adding a simple moving average (Signal Line) it turns into a cross-over type, like MACD with a histogram.
This indicator is doesn't have a default or 'best' setting, instead I use the Fibonacci numbers as input. (1,2,3,5,8,13,21,34,55,89,144).
Depending on its settings this indicator is well suited for binary options, trend and reversal trading.
Cheers, Indicat...
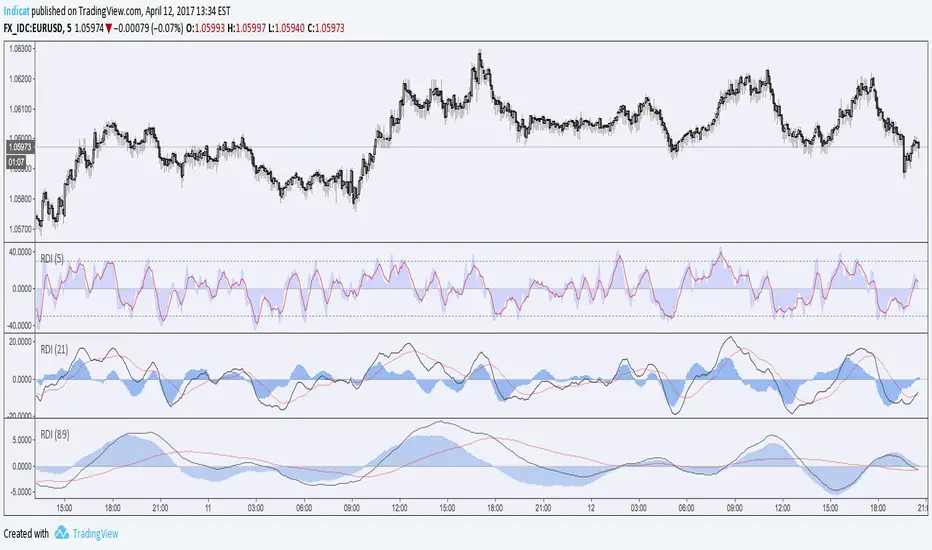
RSI featuring MACD on the Relative Divergence IndexHello Traders,
This Indicator uses RSI output to form a MACDish type of indicator.
Raw RSI output is smoothed with a linear regression curve to form the indicator line.
The signal line is a simple moving average of the same output, the histogram or momentum is the difference between the signal and indicator line, just as MACD
The outer level lines are switched off in MACD modus, because they will 'compress' this indicator, removing them also allows the zero line to 'float'
If you change the length of this indicator you also have to re-adjust the outer level lines, if used.
I recommend this indicator especially on higher lengths (55 or 89) in so you won't get whipped out by a early cross-over or 'false' divergence.
Cheers Indicat...
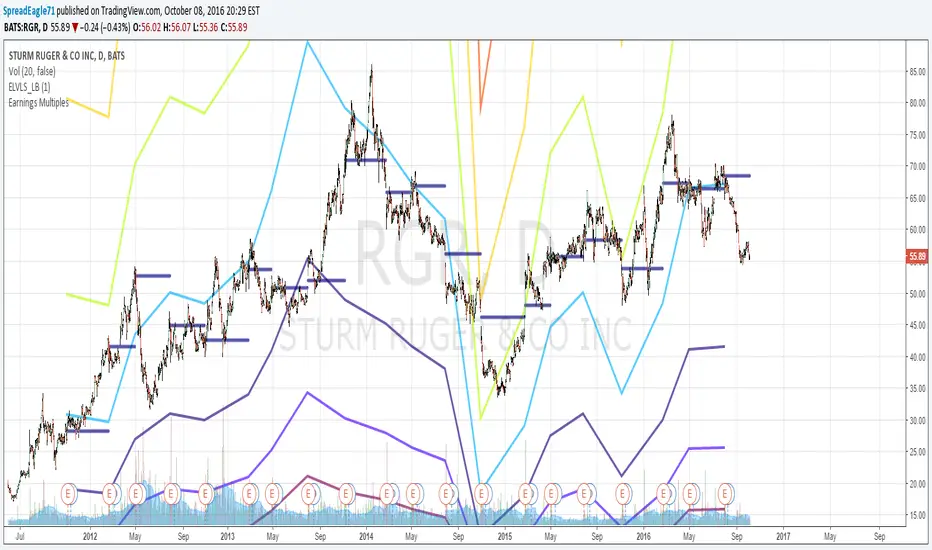
Earnings MultiplesMultiplies Quarterly Earnings x 13, x 21, x 34, x 55, x 89, x 144, x 233.
Yes its a fibonacci sequence.
"Goldilocks zone" seems to be in the 55x - 89x area.
Also when companies become profitable, the indicator looks like a "starburst".
Sniper Stochastics 2 Sniper Stochastics 2 is like the other one - a triple stochastics consisting of different lengths, in this case 55,89,144.
One thing I noticed was that the stochastics lines can be a kind of divergence detector with the slow (red), medium (blue) and fast(black) lines making breakaways once they converge.
For example, if the lines are together and the black line starts to diverge upwards, it means that there is a positive divergence which will happen quickly and then end. The blue and the red lines are longer term divergences.
I wanted to share this one and the unique and interesting use of divergences with this indicator.
GC Magic Overlay V2This script is based on Guppy method (www.guppytraders.com
) , it was introduced to me by fellow trader @nmike. I am using this script in conjunction to Clones ,Harmonic and other tools.
Script Function:
a. Script plots the fast and slow Exponential moving averages as ribbons.
EMA's used
EMA (close): 25,30,35,40,45,50,55 (Green)
EMA (close): 89,99,109,119,129,139,149 (Red)
b. It draws the Circle dots in Pink for Sell and Black for Buy.
Script Parameters:
a. EMA : 2 emas for cross
b. Signal Exponential moving average
c. which time frame to Plot the above Signal Exponential
d. Show Guppy Slow - Red - Toggle to show red emas on chart
e. Show Guppy Fast - Green- Toggle to show green emas on chart
How to Trade:
a. Wait for the Pink/Black Dot to appear on Chart
b. Do not take trade immediately after the dot appears. Wait for the price to retrace back and touch the ema ribbons.This will keep you away from fake breakouts.
c. Rentries : in examples below
Examples:

Anchored Momentum [LazyBear]Anchored Momentum (AMOM), by Rudy Stefenel, is a modified momentum indicator to capture the relative momentum. AMOM uses SMA as the reference for deriving momentum, thereby anchoring it to that MA rather than "value of close n bars back".
Mr.Stefenel suggests using this like other oscillators -- crossing signal line, crossing zero, divergences.
For alerts, use "Momentum", "Signal" and "ZeroLine" plots.
Configurable options:
- Momentum Period: Default is 10.
- Signal Period: Default is 8.
- Smooth Momentum: Default is FALSE. If TRUE, enables EMA(close) to be used rather than "close".
- Smoothing Period: Default is 7. If momentum smoothing is enabled, this period is used.
- Show Histogram: Default is FALSE. This is not histogram per se (indicator - signal), but is used for highlighting the crosses. Check out the histogram pane below to see an example.
- Enable Barcolors: Default is FALSE. If enabled, colors the price data (bars/candles) using histogram color.
More info:
Anchored Momentum, Stocks & Commodities V16:2 (89-98)
Complete list of all my indicators:
docs.google.com
