TradePro's 2 EMA + Stoch RSI + ATR StrategySaw TradePro's "NEW BEST HIGHEST PROFITING STRATEGY WITH CRAZY RESULTS - 2 EMA+ Stochastic RSI+ ATR", and was curious on the back testing results. This strategy is an attempt to recreate it.
This strategy uses 50 / 200 EMAs, Stochastic RSI and ATR.
Long Entry Criteria:
- 50 EMA > 200 EMA
- Price closes below 50 EMA
- Stochastic RSI has gone into oversold < 20
- Stochastic RSI crosses up while making higher low from previous cross up
Short Entry Criteria:
- 50 EMA < 200 EMA
- Price closes above 50 EMA
- Stochastic RSI has gone into overbought > 80
- Stochastic RSI crosses down while making lower high from previous cross down
Stop-loss is set to ATR stop-loss
Take Profit is 2x the risk
All parameters are configurable.
Enjoy~~
Cari dalam skrip untuk "ATR"

Short vs Long ATRSimple pinescript that compares a long ATR against short ATR and let you define a threshold in %

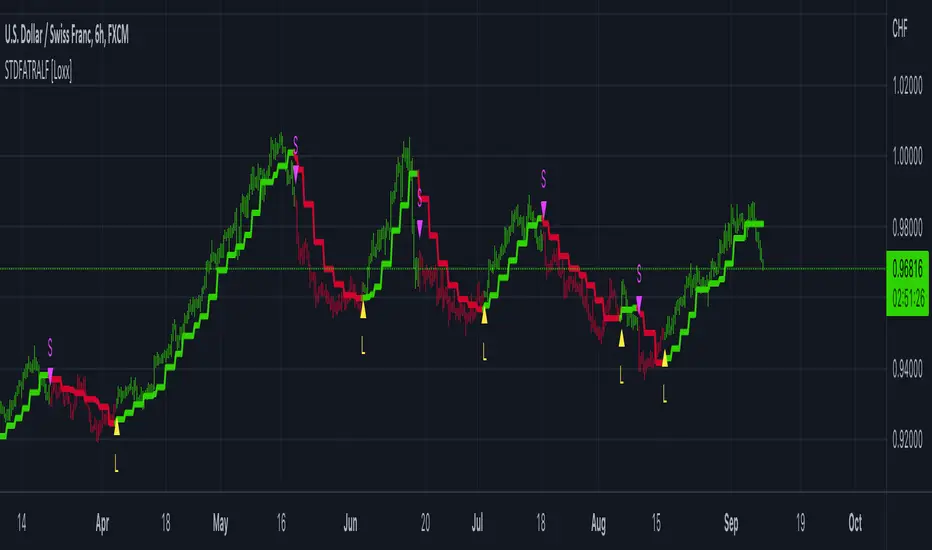
STD-Filtered, ATR-Adaptive Laguerre Filter [Loxx]STD-Filtered, ATR-Adaptive Laguerre Filter is a standard Laguerre Filter that is first made ATR-adaptive and the passed through a standard deviation filter. This helps reduce noise and refine the output signal. Can apply the standard deviation filter to the price, signal, both or neither.
What is the Laguerre Filter?
The Laguerre RSI indicator created by John F. Ehlers is described in his book "Cybernetic Analysis for Stocks and Futures". The Laguerre Filter is a smoothing filter which is based on Laguerre polynomials. The filter requires the current price, three prior prices, a user defined factor called Alpha to fill its calculation. Adjusting the Alpha coefficient is used to increase or decrease its lag and it's smoothness.
Included:
Bar coloring
Signals
Alerts
Loxx's Expanded Source Types
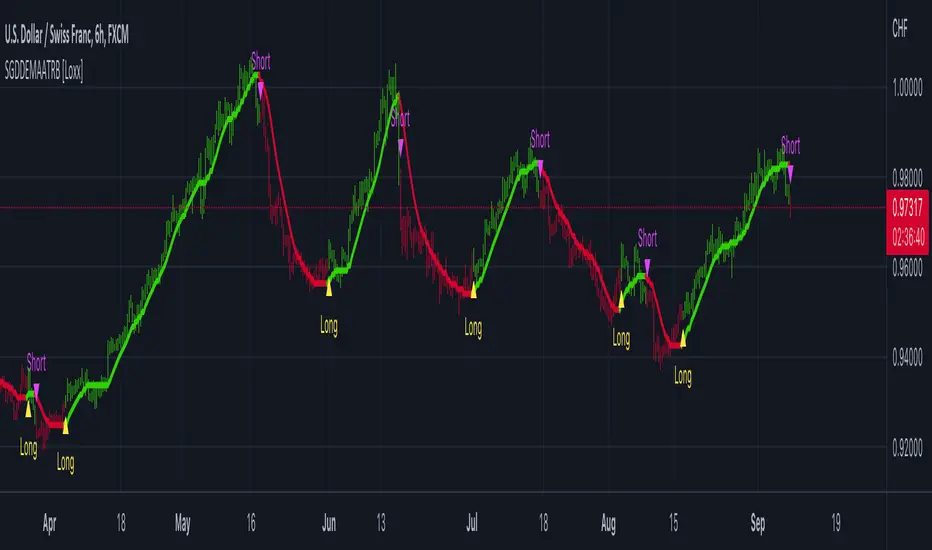
Step Generalized Double DEMA (ATR based) [Loxx]Step Generalized Double DEMA (ATR based) works like a T3 moving average but is less smooth. This is on purpose to catch more signals. The addition of ATR stepped filtering reduces noise while maintaining signal integrity. This one comes via Mr. Tools.
Theory:
The double exponential moving average (DEMA), was developed by Patrick Mulloy in an attempt to reduce the amount of lag time found in traditional moving averages. It was first introduced in the February 1994 issue of the magazine Technical Analysis of Stocks & Commodities in Mulloy's article "Smoothing Data with Faster Moving Averages". The way to calculate is the following :
The Double Exponential Moving Average calculations are based combinations of a single EMA and double EMA into a new EMA:
1. Calculate EMA
2. Calculate Smoothed EMA by applying EMA with the same period to the EMA calculated in the first step
3. Calculate DEMA
DEMA = (2 * EMA) - (Smoothed EMA)
This version:
For our purposes here, we are using Tim Tillson's (the inventor of T3) work, specifically, we are using the GDEMA of GDEMA for calculation (which is the "middle step" of T3 calculation). Since there are no versions showing that "middle step, this version covers that too. The result is smoother than Generalized DEMA, but is less smooth than T3 - one has to do some experimenting in order to find the optimal way to use it, but in any case, since it is "faster" than the T3 (Tim Tillson T3) and still smooth, it looks like a good compromise between speed and smoothness.
Usage:
You can use it as any regular average or you can use the color change of the indicator as a signal.
Included
Alerts
Signals
Bar coloring
Loxx's Expanded Source Types
KTP ATR , TR and DATR by Mitraj ThakkarThis indicator provides values of ATR, TR and DATR values side by side which makes it easy for user to compare it for current
candle and takes decision. It is not a complete system for trading but it aids in taking decision for entry and exit. for eg. ema crossover is formed for entry, we can take entry 5% of datr above pattern and keep stop loss 10% datr below pattern.
ATR stands for Average true range of last 14 candles.
TR stands for true range of each candle.
DATR stands for Daily Average True Range.

Jurik CFB Adaptive, Elder Force Index w/ ATR Channels [Loxx]Jurik CFB Adaptive, Elder Force Index w/ ATR Channels is a variation of Elder Force Index that better adapts to trends by calculating dynamic lengths for the traditional Elder Force Index calculation. ATR channels are added to show levels of price extremes or exhaustion of price either up or down. Elder Force Index is typically used for spotting reversals on the weekly timeframe.
What is the Elder Force Index?
Dr. Alexander Elder is one of the contributors to a newer generation of technical indicators. His force index is an oscillator that measures the force, or power, of bulls behind particular market rallies and of bears behind every decline.1
The three key components of the force index are the direction of price change, the extent of the price change, and the trading volume. When the force index is used in conjunction with a moving average, the resulting figure can accurately measure significant changes in the power of bulls and bears.1 In this way, Elder has taken an extremely useful solitary indicator, the moving average, and combined it with his force index for even greater predictive success.
What is Composite Fractal Behavior ( CFB )?
All around you mechanisms adjust themselves to their environment. From simple thermostats that react to air temperature to computer chips in modern cars that respond to changes in engine temperature, r.p.m.'s, torque, and throttle position. It was only a matter of time before fast desktop computers applied the mathematics of self-adjustment to systems that trade the financial markets.
Unlike basic systems with fixed formulas, an adaptive system adjusts its own equations. For example, start with a basic channel breakout system that uses the highest closing price of the last N bars as a threshold for detecting breakouts on the up side. An adaptive and improved version of this system would adjust N according to market conditions, such as momentum, price volatility or acceleration.
Since many systems are based directly or indirectly on cycles, another useful measure of market condition is the periodic length of a price chart's dominant cycle, (DC), that cycle with the greatest influence on price action.
The utility of this new DC measure was noted by author Murray Ruggiero in the January '96 issue of Futures Magazine. In it. Mr. Ruggiero used it to adaptive adjust the value of N in a channel breakout system. He then simulated trading 15 years of D-Mark futures in order to compare its performance to a similar system that had a fixed optimal value of N. The adaptive version produced 20% more profit!
This DC index utilized the popular MESA algorithm (a formulation by John Ehlers adapted from Burg's maximum entropy algorithm, MEM). Unfortunately, the DC approach is problematic when the market has no real dominant cycle momentum, because the mathematics will produce a value whether or not one actually exists! Therefore, we developed a proprietary indicator that does not presuppose the presence of market cycles. It's called CFB (Composite Fractal Behavior) and it works well whether or not the market is cyclic.
CFB examines price action for a particular fractal pattern, categorizes them by size, and then outputs a composite fractal size index. This index is smooth, timely and accurate
Essentially, CFB reveals the length of the market's trending action time frame. Long trending activity produces a large CFB index and short choppy action produces a small index value. Investors have found many applications for CFB which involve scaling other existing technical indicators adaptively, on a bar-to-bar basis.
What is Jurik Volty used in the Juirk Filter?
One of the lesser known qualities of Juirk smoothing is that the Jurik smoothing process is adaptive. "Jurik Volty" (a sort of market volatility ) is what makes Jurik smoothing adaptive. The Jurik Volty calculation can be used as both a standalone indicator and to smooth other indicators that you wish to make adaptive.
What is the Jurik Moving Average?
Have you noticed how moving averages add some lag (delay) to your signals? ... especially when price gaps up or down in a big move, and you are waiting for your moving average to catch up? Wait no more! JMA eliminates this problem forever and gives you the best of both worlds: low lag and smooth lines.
Ideally, you would like a filtered signal to be both smooth and lag-free. Lag causes delays in your trades, and increasing lag in your indicators typically result in lower profits. In other words, late comers get what's left on the table after the feast has already begun.

Saty ATR LevelsThis indicator uses the previous period close and +/- 1 ATR to display significant day, multiday, swing, and position trading levels including:
- Trigger clouds for possibly going long/short @ 23.6 fib
- Mid-range level at 61.8 fib
- Full range level at +/- 1 ATR (from previous close)
- Extension level at 161.8 fib
Additionally, a convenient info table is provided that shows trend, range utilization, and numerical long/short values.
This indicator is most beneficial when you combine it with price, volume, and trend analysis. For educational content please check out the indicator website at atrlevels.com.
I am constantly improving this indicator, please use this one if you want to continue to get new features, bug fixes, and support.

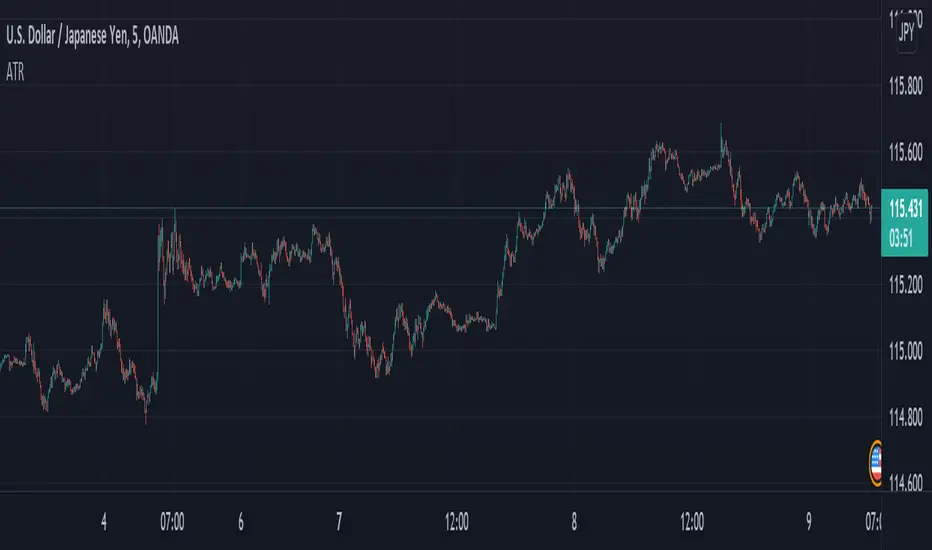
Minimalistic ATRI have a thing for efficiency, as I'm sure many of you do as well. One could say we are minimalist. As such, wasting precious chart space is absolutely unacceptable. Such precious commodity should only be used for things that are pleasing to the eye and mind. This minimalistic ATR filter will give you all the functions a regular ATR provide, without all the clutter of plotting on the chart. Enjoy
The height of cultivation always runs to simplicity.
8X Trend ATR SAR Dingue V58X Trend ATR SAR Dingue V5 - This is the updated version for Pine Script 5.
8x indicator into 1 :
2x ATR indicator - 3x Trend indicator - 3x SAR indicator
Trends are helpful to spot reversal and support resistance, especially on bigger time frames.
This indicator gives you a global view of various trends all at once. You can easily turn them On or Off as to not clog the screen.
Each trend is also color-coded to visualize quickly the position of the price compared to it.
You can customize lengths, adjust line sizes, have the start of a new trend marked with a circle, fill in colors.
'Tool tips' explain other settings and if you have any questions, feel free to ask in the comments below.
Thank you for the feedback and check all my ‘Dingue’ indicators.

[TTI] ATR channelsHISTORY AND CREDITS
Used by John Carter in his indicator’s toolbox. The ATR channels or the Keltner Channels represent the railroads or the natural movement of stocks.
WHAT IT DOES
Movements between the the The first multiplier lines (white) represent standard movement for the timeframe you are trading. Movements between the second multiplier (green/red lines) represent a 2stdv move of the stock in a single direction. Once a stock starts reaching the 3rd multiplier lines there’s an exponential chance that it will revert to the mean (cyan line)
Additionally, we have added the Institutional lines. These are thought in a Small Account Mastery class 2019 by John Carter, as the levels heavily watched by institutions. The default settings represent what John is teaching but they can be further customised.
HOW TO USE IT
ATRs channels or Keltner Channels can be great source for target or stop losses and can be used as a indicator for confluence with other technical tools like the Fibonacci lines.

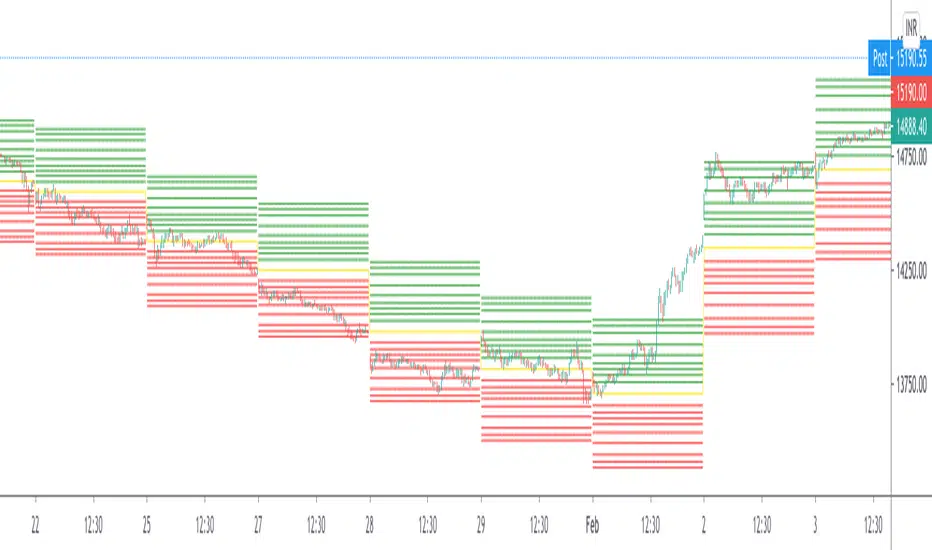
Rectangular ATR LevelsHelpful in forming Support resistance Judgements
Rectangular ATR Levels
is calculated using multipliers of the ATR value at the Previous Day's Close and plotting them on current day price movements as levels
Enjoy!
Running Bound based on ATR multiplierThis script basically uses default ATR and then
Multiplies with ATR multiplier (3 for crypto and 2 for forex) - you can change the values from the settings if you like
Adds/subtracts from the current price
And tries to find a bound on both side of price
[JRL] ATR Pivot PointsThis indicator plots pivot points with support and resistance lines based on average true range (ATR). ATR is one of the best volatility and trading range predictors, so it can be very useful for finding confluence in any strategy.

MACD Strategy with trailing ATR stopThis is a trend based strategy that uses EMA and SMA intersection for determining the direction of the trend and MACD for the entry signal. At the same time, the strategy uses ATR, which is working as a trailing stop.
The strategy entry will work when the Trend ribbon will turn green and MACD line will crossover the signal line. This strategy also takes into account the pyramiding and allows to enter the second time if the signal will repeat itself.
There are 3 exit points. The first 10% of the position will be closed when the price will increase by 1%. The second portion of 50% will be closed when the price reaches 5% Take profit target. The remaining 40 % of the position will wait for the exit signal which will occur when the price closes below the ATR line.
The strategy is using a fixed amount in dollars, each time the entry occurs the strategy will enter with 100$ in the order.
The strategy can be applied to other crypto assets. However, they will require input changes.
Best of luck with your trading.

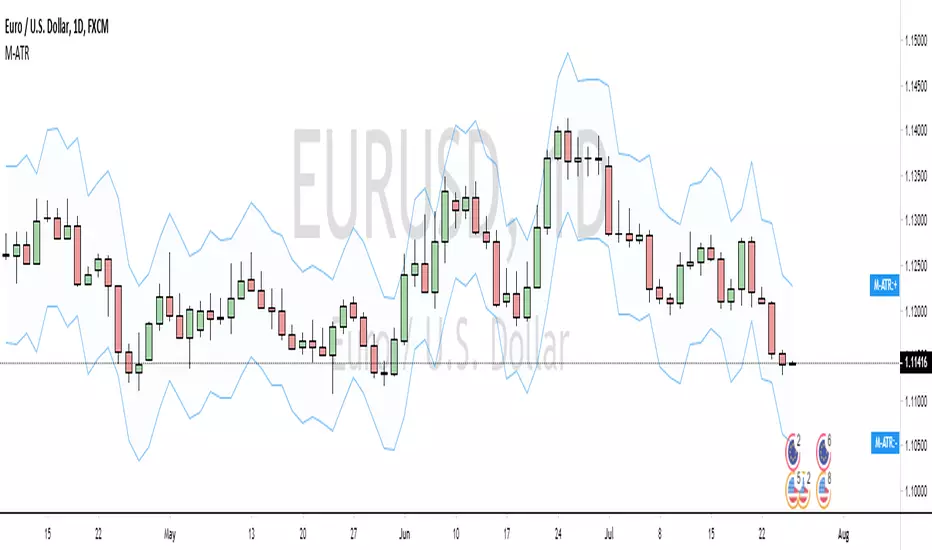
2 Candles Inside ATR2 agitated candles falling inside ATR range, awaiting possibly a big move.
Buy / Sell signals at combined high / low can be used as order with other as stop loss.
Counter trade, when this minimal stop loss is hit, is also as useful. However, wait till the SL candle closes, before opening position on the other side.
Works quite well on 15 mins chart, with settings of ATR duration 25 and multiplier 0.6. These settings are configurable, so feel free.

Show ATR and 1st hour high+low1. Shows TR at daily bars
2. Shows ATR lines intraday: 100% and 75% (customizable)
3. Shows hint with ATR for current day and percent passed
4. Show high and low of the 1st hour

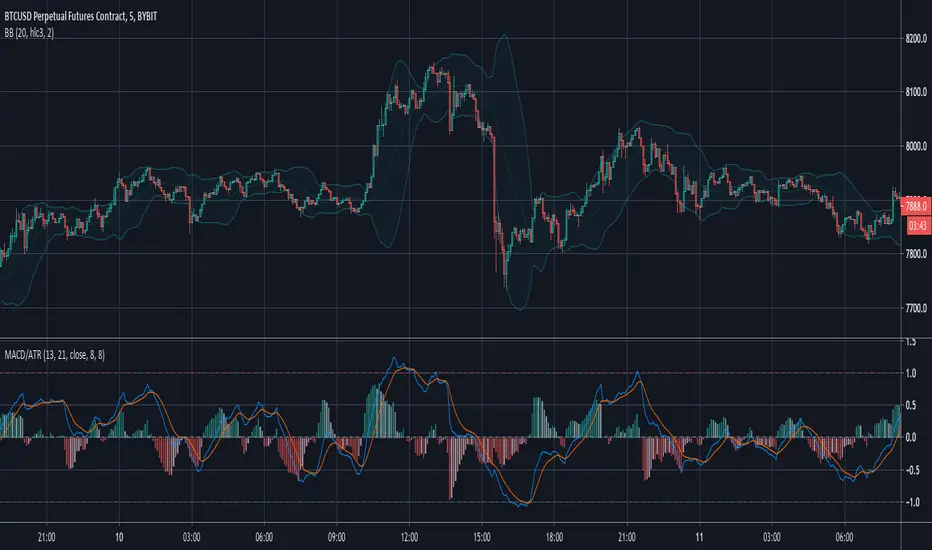
MACD/ATRThis indicator is a restricted MACD .
I reached this with a little trick: I devided it by ATR . This way it is most of the time inside the -1..1 range. It depends on the length of the ATR's period. If it is greater, the probability of outliers is greater.
With this indicator you can use cerain levels of MACD and its histogram as a trigger.
Share with me if you found it useful.
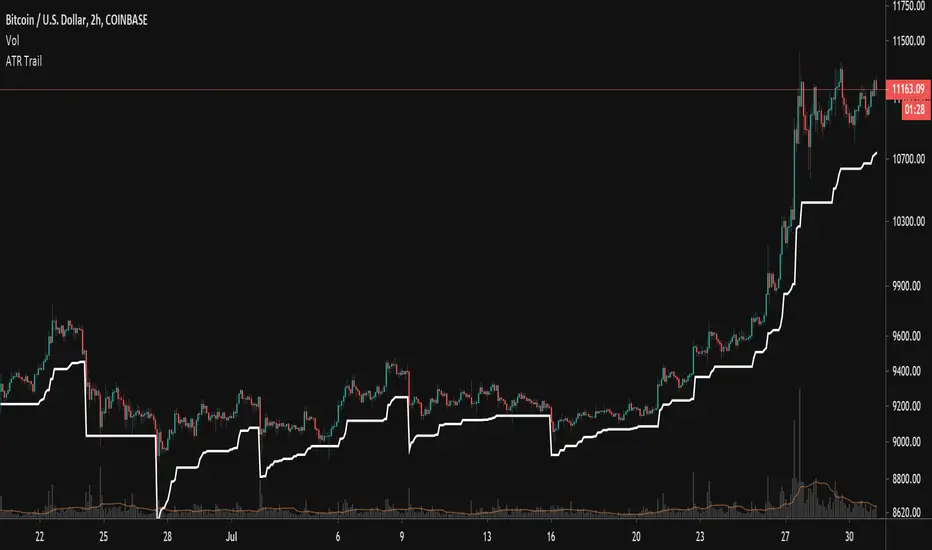
Trailing ATR StopsThis script plots a trailing stop of the ATR multiplied by a user-defined number. Since it is meant to be used as a trailing stop, the value doesn't fluctuate with the price as a normal ATR indicator does, but stays fixed unless price moves away from it. In that case it follows the price. If price crosses the stop level, it resets itself based on current price and starts trailing all over again.
User Settings:
Support - Use for a trailing stop while long
Resistance - Use for a trailing stop while short
Both - Acts like a channel and can spot periods of lower volatility
Double EMA + ATR Trend FollowerThis indicator consists of a fast and slow EMA (default lengths are 50 and 9 periods) and an upper and lower ATR band. When combined, this combination gives traders an accurate picture of both trend strength and direction.
Users can modify the lengths of the fast and slow EMA , as well as the multipliers and length for the upper and lower ATR bands.

Maximum ATR BandsSlight modification on my previous script "ATR-Overlay"
This script plots the max value of the ATR in a given period.
Really straight forward, but has given me better stop-loss levels on trade entries.
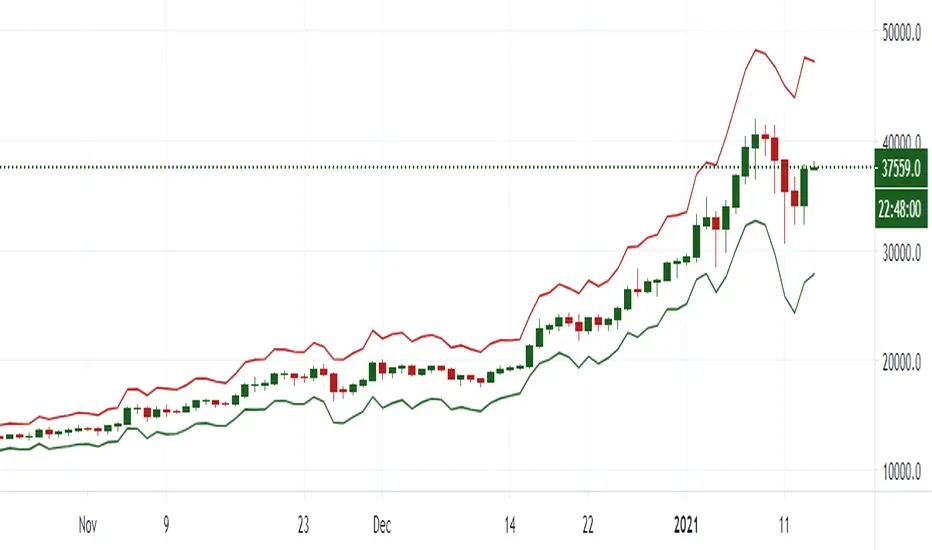
GG ATR bands
ATR plotted above and below price with a multiplier. Defaults to 2x ATR. Makes it easier to use ATR for stop or take profit.
HMA ATR RangeIn Alan's books he talks about his 'range indicator' which is the HMA and ATR to give buy / hold / sell signals. This is my version as he doesnt give the formula.
It is the HMA with the ATR added and subtracted and plotted above & below the HMA to create a range.
According to Alan's terminology: HMA = Central Cord, SL = Lower deviation, TP = Upper deviation

pooya ATRthis is modified ATR for signal strength test
with custom ATR in multi time chart
comment your opinion...
