ATR Trailing Stop by GideonMATR Trailing Stop Indicator
This ATR Trailing Stop Indicator is designed for traders who wish to enhance their exit strategies by leveraging volatility-based stops. It offers a systematic approach to trend management and risk control, enabling traders to capture extended trends while protecting their capital during market reversals. Works on Indian Indices as well.
Overview:
The ATR Trailing Stop indicator is a dynamic trend-following tool that adjusts stop levels based on market volatility. By incorporating the Average True Range (ATR), the indicator provides a flexible exit strategy that adapts to changing market conditions, helping traders lock in profits during trends and limit losses during reversals.
How It Works:
True Range and ATR Calculation:
The indicator first calculates the True Range (TR) for each bar, defined as the maximum of:
The difference between the high and low,
The absolute difference between the high and the previous close, and
The absolute difference between the low and the previous close.
Using the TR values, the ATR is computed over a user-defined period (default is 14 bars) with an option to use either a Simple Moving Average (SMA) or an Exponential Moving Average (EMA) as the smoothing method.
Trailing Stop Determination:
Two potential stop levels are calculated:
For an uptrend, the stop is determined as:
Stop = Close – (Multiplier × ATR)
For a downtrend, the stop is:
Stop = Close + (Multiplier × ATR)
The indicator maintains a persistent trailing stop that dynamically adjusts:
In an uptrend, the trailing stop only moves upward (or remains flat) to secure gains.
In a downtrend, it only moves downward, thereby protecting the position from excessive losses.
A reversal in trend is identified when the price crosses the trailing stop level, at which point the indicator flips the trend and resets the stop level accordingly.
Rationale:
Utilizing the ATR for trailing stops ensures that the stop levels are directly influenced by market volatility. This dynamic adjustment helps accommodate the natural price fluctuations of the market, providing a more adaptive risk management tool compared to fixed stop-loss levels. The approach is particularly useful in volatile markets where traditional static stops might be triggered prematurely.
Customization:
Key parameters that can be adjusted include:
ATR Period: The number of bars used to calculate the ATR.
ATR Multiplier: The factor that determines how far the trailing stop is set from the current price.
Smoothing Method: Option to choose between SMA and EMA for ATR calculation, allowing traders to tailor the sensitivity of the indicator to their specific trading style.
Cari dalam skrip untuk "ATR"

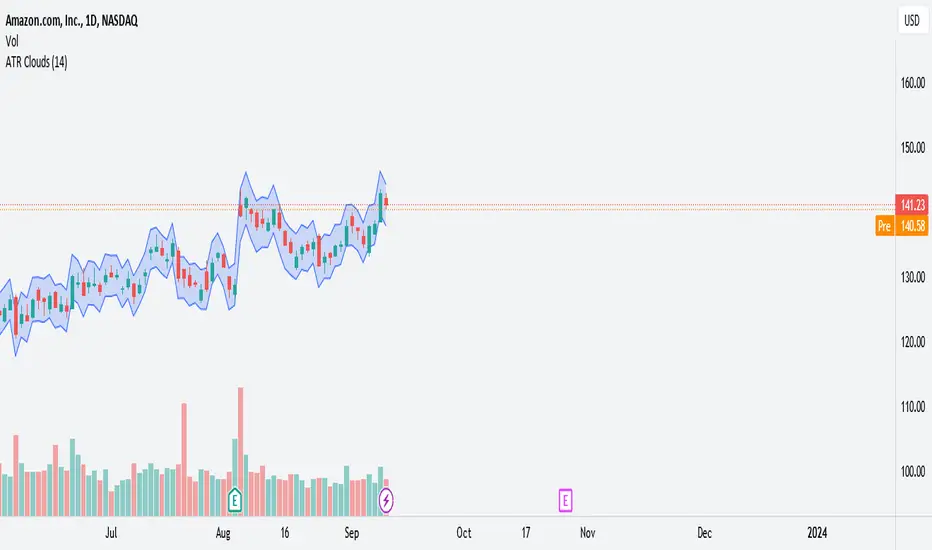
ATR Clouds*Updated with Version 5*
ATR Clouds
The "ATR Clouds" indicator provides a visual representation of the stock's volatility based on the Average True Range (ATR) calculation. It operates by plotting two bands around the closing price of a stock, using the ATR as a measure of volatility.
Features:
ATR Calculation: The Average True Range is a commonly used metric to understand the volatility of an asset. The indicator calculates the ATR over a user-defined period, with the default being 14 periods.
ATR Bands: Using the ATR value, the script defines two bands:
Upper Band: This is calculated by adding the ATR value to the closing price of the stock. It represents a higher volatility boundary.
Lower Band: This is derived by subtracting the ATR value from the closing price. It indicates a lower volatility boundary.
Cloud Visualization: The space between the upper and lower bands is shaded to create a "cloud" on the chart. This cloud gives traders a clear visual cue of the stock's current volatility range. The cloud has an 80% transparency, allowing the underlying price chart to remain visible.
Customization: Users have the ability to adjust the period for the ATR calculation based on their preferences.
Usage:
Traders can use the ATR Clouds indicator to get a sense of the stock's volatility. Wider clouds indicate periods of higher volatility, while narrower clouds suggest lower volatility. This can be beneficial for se
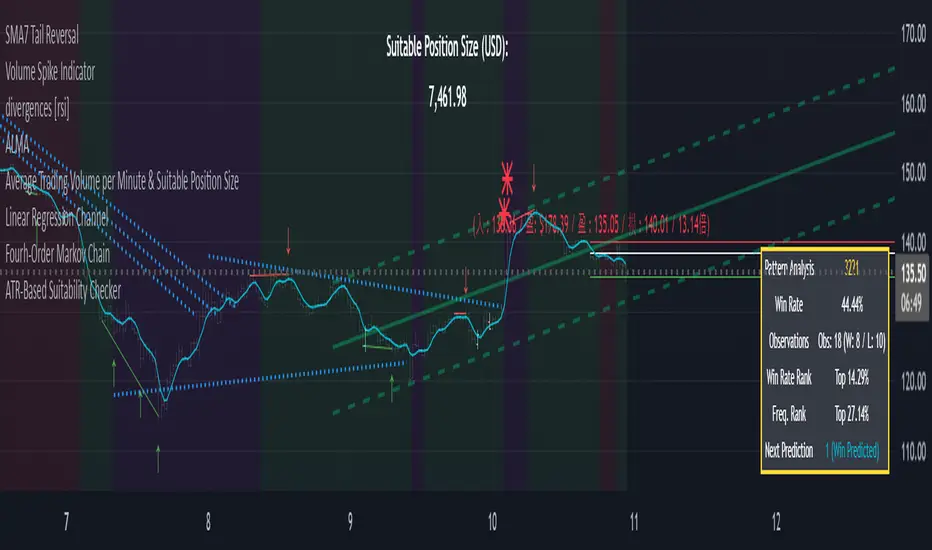
ATR-Based Suitability CheckerPurpose:
This indicator helps traders identify the most suitable timeframe for trading by comparing fees to market volatility (ATR). Instead of filtering out specific assets or strategies, it focuses on finding optimal trading conditions for the selected timeframe. It is designed to adapt dynamically, ensuring that traders can align their approach with the current market environment.
Key Features:
Dynamic ATR Analysis: Measures volatility using the Average True Range (ATR) and evaluates how fees impact potential profitability across timeframes.
Fee-to-ATR Ratio: Calculates the proportion of fees to ATR, highlighting conditions where fees are too large relative to price movements.
Visual Feedback: **Red Background:** Indicates unsuitable trading conditions where fees dominate. **Green Background:** Highlights suitable conditions for trading efficiency. Markers provide quick visual identification of suitability.
Custom Transparency: Enables users to adjust the background’s transparency for better chart visibility.
How to Use:
Timeframe Optimization: When volatility rises, price movements become larger, making shorter timeframes more suitable for trading. Conversely, during periods of low volatility, longer timeframes are preferable to avoid overtrading within a narrow price range.
Spot & Leverage Trading: For spot trading, this tool identifies conditions where fees (e.g., 0.25%-0.3%) might excessively impact profitability. For instance, if ATR is comparable to fees, the trading environment may not be ideal. In leveraged trading, the indicator helps assess whether the current volatility supports your chosen leverage level, ensuring that leverage does not amplify undue risks.
Efficiency Focus: The indicator emphasizes finding a balance between market conditions and your trading strategy. Not all timeframes need to be "suitable" at all times; instead, it highlights the best opportunities based on current market dynamics. Utilize the suitability ratio across different timeframes to guide and adjust your trading strategies effectively.
Input Parameters:
ATR Length: Defines the period for ATR calculation (default: 14).
Fee Percentage (%): Trading fee as a percentage of the closing price (default: 0.1%).
Unsuitable Threshold (% of 1 ATR): Sets the maximum acceptable fee-to-ATR ratio for suitable conditions (default: 20%).
Background Transparency (0-100): Adjusts the opacity of the background highlight (default: 80).
Who Should Use This:
This tool is ideal for traders seeking to align their strategy with market conditions by finding the most suitable timeframe. It applies to both spot and leveraged markets, helping optimize efficiency while managing fees and volatility.
Notes:
The ATR-Based Suitability Checker is a supplementary tool. Combine it with other forms of analysis for comprehensive decision-making.
Regularly adjust the parameters to match your trading preferences and market conditions.
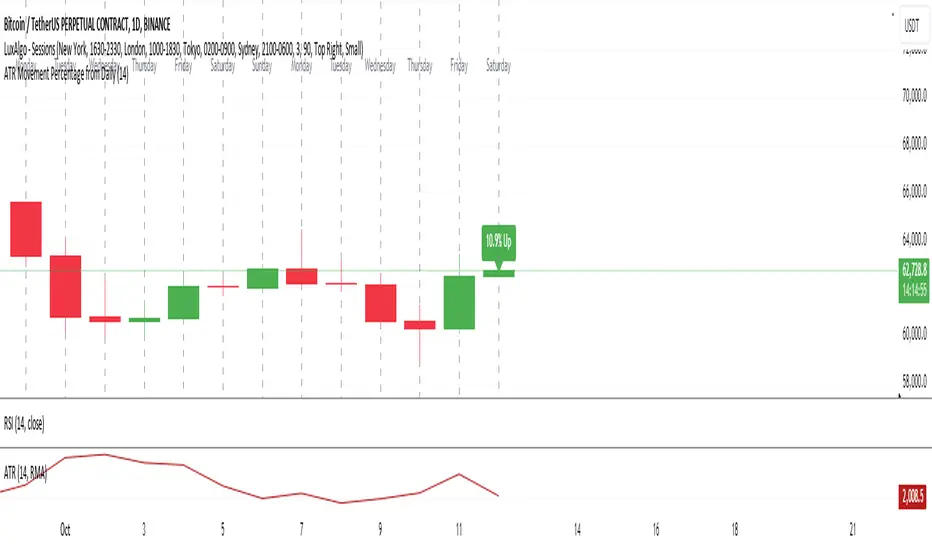
ATR Movement Percentage from Daily (Bal)Script Description: ATR Movement Percentage from Daily
The script titled "ATR Movement Percentage from Daily" is designed to help traders analyze the price movement of an asset in relation to its daily volatility, as represented by the Average True Range (ATR). Here's a breakdown of how the script works:
Key Features of the Script:
ATR Calculation:
The script allows the user to input the length of the ATR calculation (default is 14 periods).
It retrieves the daily ATR value using the request.security function, ensuring that the ATR is based on the daily timeframe, regardless of the current chart's timeframe.
Price Movement Calculation:
It calculates the opening price of the current day using request.security to ensure it is aligned with the daily timeframe.
It retrieves the current closing price and computes the price change from the opening price.
Movement Percentage:
The percentage of price movement relative to the daily ATR is calculated. This value helps traders understand how significant the current price movement is compared to the expected volatility for the day.
Direction of Movement:
The script determines the direction of the price movement (upward or downward) based on whether the price change is positive or negative.
Dynamic Label Display:
A label is created and updated to show the movement percentage and direction on the chart.
If the price movement is upward, the label is displayed in green; if downward, it is shown in red.
The label position updates with each new bar, keeping it relevant to the current price action.
Plotting Daily ATR:
The daily ATR value is plotted on the chart as a blue line, providing a visual reference for traders to see the volatility levels in relation to price movements.
Conclusion:
This script is particularly useful for traders who want to assess market conditions based on volatility. By understanding how much the price has moved in relation to the daily ATR, traders can make informed decisions about entry and exit points, and adjust their risk management strategies accordingly. The dynamic labeling feature enhances the usability of the script, allowing for quick visual assessments of market behavior.
ATR/ADR Support and Resistance LevelsATR/ADR Support and Resistance Levels Indicator
This script is designed to provide traders with precise ATR (Average True Range) and ADR (Average Daily Range) support and resistance levels. It can be effectively used to identify price breakouts or rejections near these critical lines and assist in confirming trend retests.
How It Works:
Support and Resistance Lines: The script plots ATR/ADR-based support and resistance lines, which can be toggled on or off.
Daily Data Integration: It incorporates daily open and close prices to enhance the accuracy of the support and resistance levels.
Clear Visuals: The indicator uses distinct colors for support (green) and resistance (red) levels, providing clear visual cues.
Default Settings: The default settings are optimized for most trading environments. Adjusting the ATR/ADR Length can fine-tune the indicator's responsiveness to market movements.
Key Features:
ATR & ADR Calculation: Choose between using ATR, ADR, or both. ATR is recommended for most scenarios.
Customizable Lengths: Adjust the ATR/ADR Length to refine the average calculation to your preference, with 14 being the standard value.
EMA for Market Bias: The EMA helps determine the ticker bias. It is colored green when the market is above the average price and red when it is below. This allows you to more easily determine whether or not the ADR/ATR levels are valid.
Versatile Usage: Suitable for various trading types, ensuring broad applicability across different market conditions.
How to Use:
ATR vs ADR: You should use ADR if you are day trading AND do not want to include gap data in the levels. It is recommended you use ATR.
Bounces off Levels: When price bounces off of a support/resistance level, it is very likely that price will respect this level. This indicates that price is unlikely to move beyond the ticker's average volatility. You should wait for an additional bounce to confirm.
Breakthroughs of Levels: When price breaks through a support/resistance level, it is very likely that price will continue beyond this level. This indicates that price has moved beyond that ticker's average volatility. You should wait for a bounce off the level to confirm.
This indicator is a valuable tool for traders seeking to enhance their technical analysis with support and resistance levels based on ATR and ADR calculations. It is perfect for identifying key price points and understanding market trends.

ATR with MAOVERVIEW
The Average True Range Moving Average (ATRMA) is a technical indicator that gauges the amount of volatility currently present in the market, relative to the historical average volatility that was present before. It adds a moving average to the Average True Range (ATR) indicator.
This indicator is extremely similar to the VOXI indicator, but instead of measuring volume, it measures volatility. Volume measures the amount of shares/lots/units/contracts exchanged per unit of time. Volatility, on the other hand, measures the range of price movement per unit of time.
The purpose of this indicator is to help traders filter between non-volatile periods in the market from volatile periods in the market without introducing subjectivity. It can also help long-term investors to determine market regime using volatility without introducing subjectivity.
CONCEPTS
This indicator assumes that trends are more likely to start during periods of high volatility, and consolidation is more likely to persist during periods of low volatility. The indicator also assumes that the average true range (ATR) of the last 14 candles is reflective of the current volatility in the market. ATR is the average height of all the candles, where height = |high - low|.
Suppose the ATR of the last 14 candles is greater than a moving average of the ATR(14) of the last 20 candles (this occurs whenever the indicator's filled region is colored BLUE). In that case, we can assume that the current volatility in the market is high.
Suppose the ATR of the last 14 candles is less than the moving average of the ATR(14) of the last 20 candles (this occurs whenever the indicator's filled region is colored RED). In that case, we can assume that the current volatility in the market is low.
HOW DO I READ THIS INDICATOR?
If the ATR line is above the ATR MA line (indicated by the blue color), the current volatility is greater than the historical average volatility.
If the ATR line is above the ATR MA line (indicated by the red color), the current volatility is less than the historical average volatility.

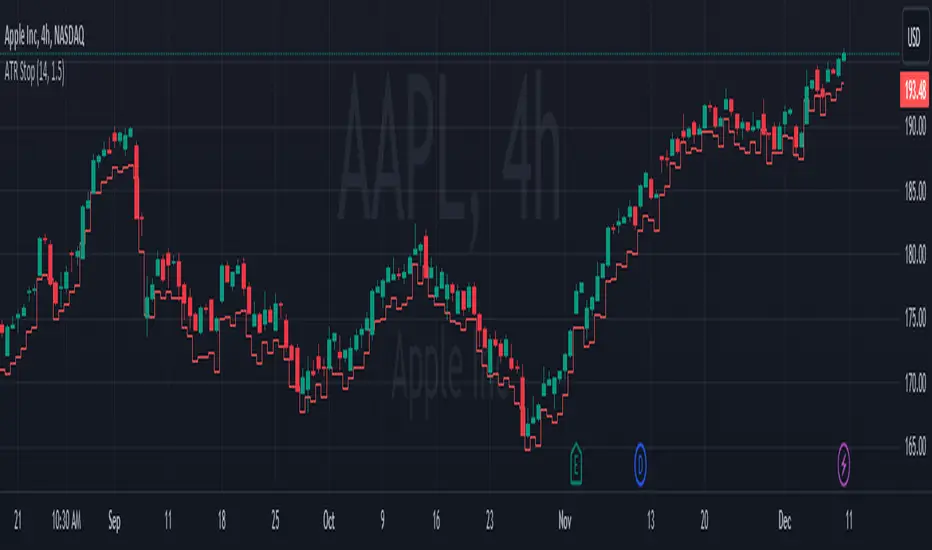
ATR Trailing Stop by tactical trade 22 Oct 2024Description:
The ATR Dual Trailing Stop indicator is a versatile and powerful tool designed to help traders visualize dynamic support and resistance levels based on the Average True Range (ATR). This indicator plots two separate ATR-based trailing stops with customizable settings, providing a comprehensive view of potential market reversals and trend strength.
Key features:
Two ATR Trailing Stops: The first stop uses customizable ATR settings (default: 10-period ATR with a 3x multiplier), while the second stop uses an alternate configuration (default: 21-period ATR with a 7x multiplier).
Multi-Timeframe ATR Calculation: Regardless of the chart's time frame, the ATR is calculated based on a user-selected time frame (e.g., daily), allowing for consistent stop-loss levels even in lower time frames like 5-minute or 15-minute charts.
Visual Cues: The indicator clearly plots two trailing stop lines in different colors, making it easy to track the market’s volatility-based support and resistance areas.
No Buy/Sell Signals: This is purely a trailing stop indicator with no embedded buy/sell signals, giving traders the flexibility to use it with their preferred entry/exit strategies.
This indicator is especially useful in highly volatile markets where precise trailing stop levels are essential for managing risk and maximizing profit potential. The dual ATR configuration helps traders adapt to changing market conditions by providing two levels of stop placement: a shorter-term and a longer-term trailing stop.

ATR+StdTR Band and Trailing StopThis Pine Script code plots the "ATR+StdTR Band and Trailing Stop," serving as a tool for volatility-based risk management and trend detection. While bands are typically set using a multiple of ATR, this script uses StdTR (the True Range standard deviation) and sets the band width based on ±(ATR + n times StdTR). StdTR is a great tool for detecting price volatility and anomalies, allowing traders to adapt to rapid changes in extreme market conditions. This helps traders proactively manage risk during sudden market fluctuations.
The following features are provided:
Table Display
A table is shown on the chart, allowing traders to visually track the current ATR value, StdTR (σ), and the long/short stop-loss levels (±ATR ± nσ). This enables real-time monitoring of risk management data.
Band Plots
The script plots bands that combine ATR with StdTR (nσ).
The upper and lower bands are calculated using the previous candle’s closing price (the source is customizable) and are plotted as ±(ATR + nσ), providing a clear visual of the price range.
ATR ± nσ Trailing Stop
The trailing stop dynamically adjusts the stop-loss levels based on price movements. In an uptrend, the stop-loss rises, while in a downtrend, it lowers, helping traders lock in profits while minimizing losses during significant reversals.
Breakout Detection
Breakouts are detected when the price exceeds the upper band or drops below the lower band. A visual marker (X) is displayed on the chart, allowing traders to quickly recognize when the price has moved beyond normal volatility ranges, making it easier to respond to trend formations or reversals.
Customization Points:
The ATR period and StdTR (n) are fully customizable.
The source for ATR band calculation can be adjusted, allowing traders to choose from close, open, high, low, etc.
The table’s display position and design (text color, size, etc.) can be customized to present the information clearly and effectively.

ATR StopThe "ATR Stop" indicator is designed to provide traders with insights into potential stop levels based on Average True Range (ATR) calculations specifically tailored for profitable (green candles) and unprofitable (red candles) price movements. This tool aims to assist traders in identifying potential stop levels that adjust dynamically based on the volatility of distinct market conditions.
The indicator functions by calculating two types of ATR: one for profitable movements and the other for unprofitable movements. The Average True Range is calculated separately for green and red candles, allowing users to assess potential stop levels more accurately based on the nature of price movements.
Key features of the "ATR Stop" indicator include:
Custom ATR Calculation: It calculates the ATR for profitable (green) and unprofitable (red) movements separately, considering only specific candle types based on their closing price relative to their opening price.
Dynamic Multiplier: Users can adjust the multiplier to fine-tune the sensitivity of the ATR-based stop levels, accommodating different risk preferences and market conditions.
Clear Visualization: The indicator plots the ATR levels for profitable (green) and unprofitable (red) movements one candle ahead on the chart, providing a visual representation of potential stop levels.
To use the indicator effectively, traders can adjust the ATR length and multiplier parameters based on their trading strategies and risk management preferences. By considering distinct price movements, this tool can assist in setting more informed stop levels in varying market conditions.
Please note that while the "ATR Stop" indicator can be a valuable addition to a trader's toolbox, it should be used in conjunction with other technical analysis tools and risk management strategies to make well-informed trading decisions.
ATR + Momentum Shifts w/Take ProfitThis script is a technical analysis indicator designed to assist in identifying potential entry points and setting take profit levels in trading. It combines the Average True Range (ATR) indicator, momentum shifts, and customizable take profit levels to provide insights into potential market movements.
Differences from Currently Published Ones:
This script is unique due to its use of a combination of elements:
ATR and Momentum: The script combines the ATR indicator to provide dynamic support and resistance levels with the momentum indicator to identify shifts in the underlying momentum.
Customizable Take Profit Levels: It offers the ability to set take profit levels based on customizable multipliers of the ATR, helping traders manage potential profits.
How to Use:
ATR Bands: The script plots upper and lower ATR bands as potential dynamic support and resistance levels.
Shift Arrows: Arrows are plotted below bars for potential long entry opportunities (green triangle) and above bars for potential short entry opportunities (yellow triangle).
Take Profit Levels: The script also plots take profit levels both above and below the source price based on the ATR multipliers set in the inputs.
Markets and Conditions:
This script can be used across various financial markets, including stocks, forex, commodities, and cryptocurrencies. It's most effective in trending markets where momentum shifts can signal potential reversals or continuation of trends. Traders should consider the following conditions:
Trend Confirmation: Look for momentum shifts in the direction of the prevailing trend for higher probability setups.
Volatility: Higher volatility can amplify ATR movements and subsequently affect the placement of ATR bands and take profit levels.
Risk Management: Always implement proper risk management strategies to protect your capital.
Additional Considerations:
Customization: Traders can adjust input parameters like ATR length, momentum length, and take profit multipliers to match their trading style and market conditions.
Combining with Other Indicators: Consider using this indicator in conjunction with other technical indicators or chart patterns for confirmation.

Daily ATR%If You are using a percentage of the Daily Average True Range in determining your stop placement,
this quick indicator is for You.
excerpt from investopedia.com/articles/trading/06/stopplacement.asp
ATR % Stop Method
The ATR% stop method can be used by any type of trader because the width of the stop is determined by the percentage of average true range (ATR). ATR is a measure of volatility over a specified period of time. The most common length is 14, which is also a common length for oscillators such as the relative strength index (RSI) and stochastics. A higher ATR indicates a more volatile market, while a lower ATR indicates a less volatile market. By using a certain percentage of ATR, you ensure that your stop is dynamic and changes appropriately with market conditions.
For example, for the first four months of 2006, the GBP/USD average daily range was around 110 to 140 pips. A day trader may want to use a 10% ATR stop - meaning that the stop is placed 10% x ATR pips from the entry price.In this instance, the stop would be anywhere from 11 to 14 pips from your entry price. A swing trader might use 50% or 100% of ATR as a stop. In May and June of 2006, daily ATR was anywhere from 150 to 180 pips. As such, the day trader with the 10% stop would have stops from entry of 15 to 18 pips while the swing trader with 50% stops would have stops of 75 to 90 pips from entry.

ATR x2 AUTODescription:
This indicator automatically plots ATR-based horizontal levels for each of the most recent candles, helping traders visualize potential stop-loss hunting zones, breakout areas, or price reaction points.
It works by taking the Average True Range (ATR) over a customizable period and multiplying it by a user-defined factor (default: ×2). For each of the last N candles (default: 5), it calculates and draws:
Below green candles (bullish) → A horizontal line placed ATR × multiplier below the candle’s low.
Above red candles (bearish) → A horizontal line placed ATR × multiplier above the candle’s high.
Doji candles → No line is drawn.
Each line extends to the right indefinitely, allowing traders to monitor how price reacts when returning to these ATR-based levels. This makes the tool useful for:
Identifying likely stop-loss clusters below bullish candles or above bearish candles.
Anticipating liquidity sweeps and fakeouts.
Supporting breakout or reversal strategies.
Key Features:
Customizable ATR length, multiplier, number of recent candles, and line thickness.
Separate colors for bullish and bearish candle levels.
Automatic real-time updates for each new bar.
Clean overlay on the main price chart.
Inputs:
ATR Length → Period used for ATR calculation.
Multiplier → Factor applied to the ATR distance.
Number of Candles → How many recent candles to track.
Line Thickness and Colors → Full visual customization.
Usage Tip:
These levels can be combined with key market structure points such as support/resistance, trendlines, or the 200 EMA to anticipate high-probability price reactions.

ATR Multiples from LOD/HODAn indicator that plots ATR (Average True Range) multiples from the current Low of Day (LOD) and High of Day (HOD). The indicator should:
Calculate the Low of Day (LOD) and High of Day (HOD) dynamically for the current trading session.
Use the ATR (Average True Range), with a customizable length, as the base measurement.
Plot multiple levels above the LOD and below the HOD, based on user-defined ATR multiples (e.g., 1x ATR, 2x ATR, 3x ATR, etc.).
Customizable Inputs:
ATR Length
ATR Multiples (Up to 5 levels)
Line color and style for each level
Display the ATR multiples on the chart as horizontal lines extending throughout the trading session.

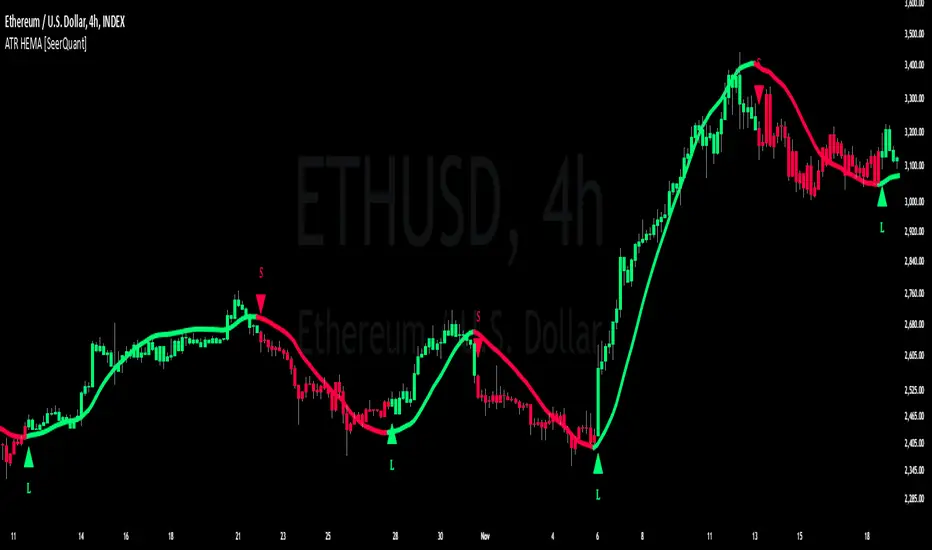
ATR HEMA [SeerQuant]What is the ATR Holt Moving Average (HEMA)?
The ATR Holt Moving Average (HEMA) is an advanced smoothing technique that incorporates the Holt exponential smoothing method. Unlike traditional moving averages, HEMA uses two smoothing factors (alpha and gamma) to forecast both the current trend and the trend change rate. This dual-layer approach improves the responsiveness of the moving average to both stable trends and volatile price swings.
When paired with the Average True Range (ATR), the HEMA becomes even more powerful. The ATR acts as a volatility filter, defining a "neutral zone" where minor price fluctuations are ignored. This allows traders to focus on significant market movements while reducing the impact of noise.
⚙️ How the Code Works
The ATR Holt Moving Average (HEMA) combines trend smoothing with volatility filtering to provide traders with dynamic signals. Here's how it functions step by step:
User Inputs and Customization:
Traders can customize the lengths for HEMA's smoothing factors (alphaL and gammaL), the ATR calculation length, and the neutral zone multiplier (atrMult).
The src input allows users to choose the price source for calculations (e.g., hl2), while the col input offers various color themes (Default, Modern, Warm, Cool).
Holt Exponential Moving Average (HEMA) Calculation:
Alpha and Gamma Smoothing Factors:
alpha controls how much weight is given to the current price versus past prices.
gamma smooths the trend change rate, reducing noise. The HEMA formula combines the current price, the previous HEMA value, and a trend adjustment (via the b variable) to create a smooth yet responsive average. The b variable tracks the rate of change in the HEMA over time, further refining the trend detection.
ATR-Based Neutral Zone:
If the change in HEMA (hemaChange) falls within the neutral zone, it is considered insignificant, and the trend color remains unchanged.
Color and Signal Detection:
Bullish Trend: The color is set to bull when HEMA rises above the neutral zone.
Bearish Trend: The color is set to bear when HEMA falls below the neutral zone.
Neutral Zone: The color remains unchanged, signalling no significant trend.
🚀 Summary
This indicator enhances traditional moving averages by combining the Holt smoothing method with ATR-based volatility filtering. The HEMA adapts to market conditions, detecting trends and transitions while filtering out insignificant price changes. The result is a versatile tool for:
The ATR Holt Moving Average (HEMA) is ideal for traders seeking a balance between responsiveness and stability, offering precise signals in both trending and volatile markets.
📜 Disclaimer
The information provided by this script is for educational and informational purposes only and does not constitute financial, investment, or trading advice. Past performance of any trading system or indicator, including this one, is not indicative of future results. Trading and investing in financial markets involve risk, and it is possible to lose your entire investment.
Users are advised to perform their own due diligence and consult with a licensed financial advisor before making any trading or investment decisions. The creator of this script is not responsible for any trading or investment decisions made based on the use of this script.
This script complies with TradingView's guidelines and is provided as-is, without any guarantee of accuracy, reliability, or performance. Use at your own risk.
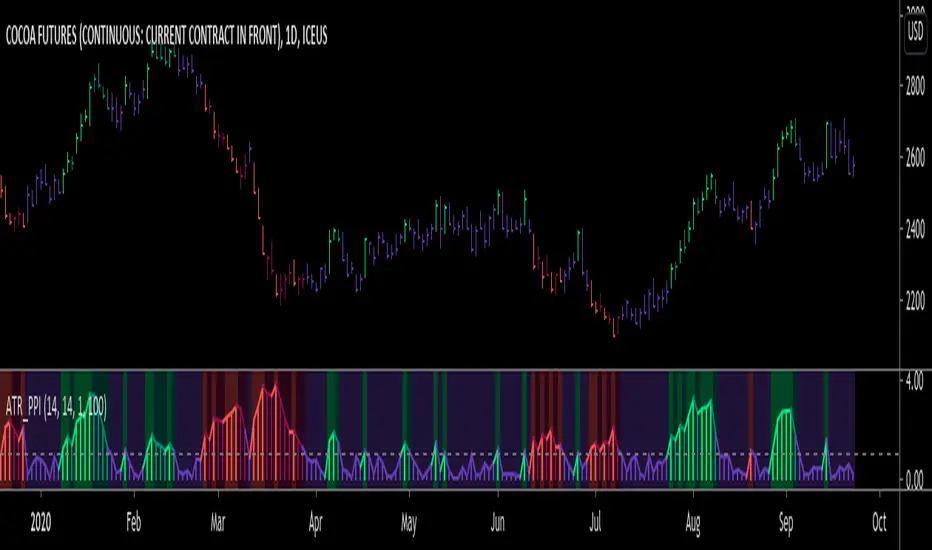
ATR Pivot Point Index [racer8]Description:
ATR Pivot Point Index (ATR_PPI) is based on the theory of mean reversion.
I was inspired to create this indicator after watching a particular YouTube video on the UKspreadbetting channel.
In this video, the trader being interviewed mentioned that he would exit when price is too far from the moving average.
In other words, he exits when he thinks price will revert back to the moving average (mean reversion).
I'm not sure what period moving average he used, so I set it to the standard 14 periods.
I wanted to quantify his strategy so that the user can consistently exit a trade at a fixed distance away from the moving average.
For this indicator, this distance is in ATR units.
This strategy of exiting is known as the mean reversion exit strategy.
Alternatively, if the user wishes to, this indicator can also be used as an entry indicator (Trend entry strategy).
---------------------------------------------------------------------------------------------------------------------------------------------------------------------------------
Parameters:
1. Sma Period - controls length of moving average (Affects histogram).
2. Atr Period - controls length of Atr, doesn't have much affect on indicator (Affects histogram).
3. Atr Pivot Point Level - controls horizontal line, it determines how far away in Atr units you want to exit/enter from the sma for every trade.
---------------------------------------------------------------------------------------------------------------------------------------------------------------------------------
Interpreting signals:
(Trend entry strategy) When histogram is...
Green - enter long
Red - enter short
Purple - No signal
(Mean reversion exit strategy) When histogram is...
Green - exit long
Red - exit short
Purple - No signal
---------------------------------------------------------------------------------------------------------------------------------------------------------------------------------
Calculation:
Distance = Absolute value of (current close - moving average(14))
ATR_units = Distance / ATR(14) ...........Plot as histogram.
Add horizontal line set at (2)*ATR .......Plot line.
Is histogram > line?
Yes, histogram color is green/red.
No, histogram color is purple.
Note: For mean reversion exit strategy, I recommend HIGHER Atr Pivot Point Level values. Vice versa for trend entry strategy.
Enjoy :)
ATR-limited Donchian ChannelThe ATR-limited Donchian Channel is a modified version of the classic Donchian Channel that adapts more quickly to changing market conditions.
While a traditional Donchian Channel is based only on the highest high and lowest low over a given lookback period, this version introduces an ATR-based constraint that prevents the channel lines from extending too far away from price. This makes the channel more responsive and reduces lag compared to the standard Donchian Channel.
How it works
The upper band is based on the highest high of the last N candles, but it cannot exceed a maximum distance of ATR × Factor above the current median price (midpoint of high and low).
The lower band is based on the lowest low of the last N candles, but it cannot drop more than ATR × Factor below the median price.
If the Donchian Channel would normally extend further than this ATR-limited boundary, the line is capped and marked in blue .
Otherwise, the upper band is drawn in red and the lower band in green .
A middle line is also plotted as the average of the modified upper and lower bands.
An optional offset allows you to shift the channel backward or forward in time for easier visual alignment.
Why use this version?
Faster reaction: By constraining the channel with ATR, the indicator adapts quicker to volatility changes and avoids long periods of overextended levels.
Noise control: ATR filtering prevents extreme spikes or outlier highs/lows from stretching the channel unnecessarily.
Visual clarity: Color-coding highlights when ATR filtering is active, making it easy to distinguish capped vs. natural Donchian levels.
Typical use cases
Trend-following breakout systems, but with volatility-aware limits.
Identifying dynamic support and resistance zones that adjust to market conditions.
Filtering false breakouts by monitoring when the Donchian channel is capped by ATR.
✅ This indicator is designed for traders who want the structure of a Donchian Channel but with an adaptive, volatility-sensitive adjustment that makes it react faster and more reliably than the classic version.

ATR-Multiple from 50SMAThis indicator provides a nuanced view of price extension by calculating the distance between the current price and its 50-period Simple Moving Average. This distance is not measured in simple percentage terms but is quantified in multiples of the Average True Range (ATR), offering a volatility-adjusted perspective on how far an asset has moved from its mean.
The primary goal is to help traders identify potentially overextended conditions, which can often precede price consolidation or reversals. As a general guideline, when an asset's price stretches to multiples of 7 ATRs or more above its 50-day SMA, it often enters a zone where significant profit-taking may occur. By visualizing this extension, the indicator can serve as a powerful tool for gauging when to consider taking profits on existing long positions. Furthermore, it can act as a cautionary signal, helping traders avoid initiating new long positions in assets that are already significantly stretched and may be poised for a pullback.
Features
Volatility-Adjusted Extension
Measures the distance from the 50 SMA in terms of ATR multiples, providing a more standardized way to compare extension across different assets and time periods.
Daily Timeframe Consistency
By default, the indicator uses the daily SMA and ATR for its calculations, regardless of the chart's current timeframe. This ensures a consistent and meaningful measure of extension rooted in the daily trend.
Histogram Visualization
Displays the result as a clear histogram in a separate pane, making it easy to track the extension level over time and identify historical extremes.
Dynamic Color-Coding
The histogram bars are color-coded to visually highlight different levels of extension. The colors shift as the price moves further from the mean, providing an intuitive at-a-glance reading.
Key Threshold Markers
Includes pre-set horizontal lines at the 7 and 10 ATR multiples to clearly mark the zones of potential profit-taking and extreme extension, respectively.
Built-in Alerts
Comes with configurable alert conditions that can notify you when the price reaches the "profit-taking" threshold (7 ATRs) or the "extreme extension" threshold (10 ATRs).
Customization Options
MA & ATR Periods
You can adjust the length for the Simple Moving Average (default 50) and the Average True Range (default 14) to suit your specific analytical needs.
Timeframe Source
A toggle allows you to switch between always calculating using daily data (the default and recommended setting) or using the data from the current chart's timeframe.
Color Display Style
You can choose between a smooth color gradient that transitions elegantly with the extension level or a distinct, step-based color display for a clearer visual separation of the defined zones.
Full Color Scheme Control
Every visual element is fully customizable. You can change the colors for the regular extension, the "get ready," "profit-taking," and "extreme" levels, as well as the horizontal reference lines.

ATRs in Days📌 ATR in Days
This script tracks how price moves in relation to ATR over multiple days, providing a powerful volatility framework for traders.
🔹 Key Features:
✅ 4 ATRs in 5 Days – Measures if a stock has moved 4x its ATR within the last 5 days, identifying extreme volatility zones.
✅ Daily ATR Calculation – Tracks average true range over time to gauge market conditions.
✅ Clear Table Display – Real-time ATR readings for quick decision-making.
✅ Intraday & Swing Trading Compatible – Works across multiple timeframes for day traders & swing traders.
📊 How to Use:
Look for stocks that exceed 4 ATRs in 5 days to spot extended moves.
Use ATR as a reversion or continuation signal depending on market structure.
🚀 Perfect for traders looking to quantify volatility & structure trades effectively!

ATR Adaptive EMA (AEMA)In the world of trading, it's essential to stay ahead of the curve and adapt to the ever-changing market conditions. One of the key aspects of successful trading is using the right tools to analyze and predict market trends. Traditional moving averages, such as the exponential moving average (EMA), have been a staple of technical analysis for decades. However, the limitations of fixed EMA lengths have prompted traders to look for more adaptable and dynamic alternatives. This is where our innovative Adaptive EMA Length Indicator, based on ATR, comes into play.
An Overview of the Adaptive EMA Length Indicator
Our Adaptive EMA Length Indicator is a powerful and versatile tool that utilizes the Average True Range (ATR) to dynamically determine the ideal EMA length based on current market conditions. This unique approach offers traders an edge by providing a more accurate representation of market trends, enabling them to make more informed trading decisions.
Key Features of the Adaptive EMA Length Indicator
Utilizing ATR for Enhanced Volatility Analysis: The Average True Range (ATR) is a well-established measure of market volatility. By incorporating ATR in our indicator, we ensure a more accurate representation of market conditions, allowing traders to better adapt their strategies to the prevailing volatility levels.
Customizable Parameters: Our Adaptive EMA Length Indicator allows traders to adjust key parameters, such as minimum and maximum EMA lengths, ATR length, outlier length, and outlier deviation level. This level of customization gives traders the ability to fine-tune the indicator according to their trading style and preferences.
Versatile Application Across Markets: The Adaptive EMA Length Indicator is designed to work with various financial markets, including stocks, commodities, and cryptocurrencies. Its versatility makes it a valuable addition to any trader's toolkit, regardless of their chosen market.
How to Use the Adaptive EMA Length Indicator
Set your preferred parameters: Begin by adjusting the minimum and maximum EMA lengths, ATR length, outlier length, and outlier deviation level to fit your trading style.
Apply the indicator to your chosen market: Add the Adaptive EMA Length Indicator to your chart and observe the dynamic EMA line adjusting based on current market conditions.
Use the dynamic EMA for trade entry and exit points: Monitor the EMA line in relation to the price action. When the price crosses the EMA line from below, consider it a potential buy signal. Conversely, when the price crosses the EMA line from above, it could indicate a sell signal. However, it's crucial to consider other technical analysis tools and market factors before making any trading decisions.
Continuously assess and adjust: As with any trading strategy, it's essential to keep monitoring market conditions and adjusting your parameters accordingly. Stay vigilant and be prepared to adapt your strategy as needed.
Our Adaptive EMA Length Indicator, based on ATR, offers a revolutionary approach to determining the ideal EMA length. By providing a more accurate representation of market trends, this innovative tool empowers traders to make better-informed decisions and stay ahead of the market. Try it out for yourself and see why it's a game-changer for traders seeking adaptable, dynamic, and effective trading strategies.

ATR Stop Loss and Take Profit FinderThe purpose of this tool is to help the trader determine a safe stop loss price and take profit which dynamically changes due to ATR (Average True Range)
This tool uses the concept of
ATR (Average True Range)
Risk Reward Ratio (Money Management method)
How is ATR Stop Loss and Take Profit Finder working
Step 1 ) Tool will calculate TR(True Range
Step 2) Then the TR will be used to find the Average value of X time frame, using 5 math models: RMA SMA EMA WMA and LSMA
Step 3) The value from Step 2 will be multiplied by the factor, and the result is ATR
After we got ATR Value, the Tool will find 2 lines: Upper Band and Lower Band which will function as a Stoploss value for both Short and Long trade
ATR Stop Loss and Take Profit Finder will be using Upper Band and Lower Band to calculate Take profit price. A trader can set their Target Risk Reward Ratio by setting
How to use ATR Stop Loss and Take Profit Finder
ATR Stop Loss and Take Profit Finder is not an indicator, it is only a tool to help the trader quickly find their stop loss/take profit price. t
For open long position, We comment trade to switch mode of 'Type of open Position to be long. Same as short which is need to be changed to short

ATR Daily Levels Band NakitxuAverage True Range
What Is the Average True Range (ATR)?
The average true range (ATR) is a technical analysis indicator, that measures market volatility by decomposing the entire range of an asset price for that period.
The true range indicator is taken as the greatest of the following: current high less the current low; the absolute value of the current high less the previous close; and the absolute value of the current low less the previous close.
The ATR is then a moving average, generally using 14 days, of the true ranges.
This script is an especial request of a TradingView user.
Shows 5 levels based on ATR daily, plotted in wherever timeframe you are using:
level 1: prv day ATR + prv day close
level 2: prv day ATR + prv day high
level 3: level 2 - prv day ATR
level 4: prv day close - prv day ATR
level 5: prv day low - prv day
Only show the levels if you are in a timeframe daily or lower than daily.

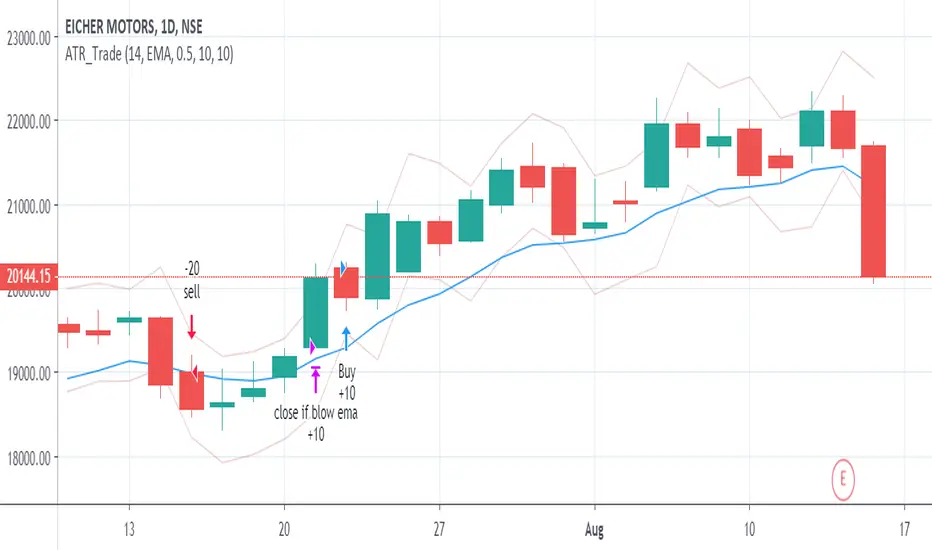
ATR_Trade_strategyATR Based Strategy
Identify the ATR range on Daily Chart.
ATR HIGH= Previous Close +ATR
ATR Low =Previous Close - ATR
Long when Close is above ATR High
Short when Close is below ATR Low
Exit when close moves below EMA(10) OR
a user-selected max loss
Average True Range Percentage (ATRP)ATR measures volatility, but you can't compare one instrument vs. another with it because the ATR value will be different depending on the price of the instrument. I went searching for something like ATR but with percentages, so you could compare one stock vs. another to find who is more volatile and found this .
It was exactly what I was looking for, so decided to re-create it in TradingView. Enjoy!
Description
Average True Range Percent (ATRP) expresses the Average True Range (ATR) indicator as a percentage of a bar’s closing price.
How this indicator works
ATRP is used to measure volatility just as the Average True Range (ATR) indicator is. ATRP allows securities to be compared, where ATR does not.
ATR measures volatility at an absolute level, meaning lower priced stock will have lower ATR values than higher price stocks. ATRP displays the indicator as a percentage, to allow for securities trading at different prices per share to be compared.
Calculation
ATRP = (Average True Range / Close) * 100
