ATR Volatility Breakout - Daily (Minimal) - SyTheInvestorGuycolor-coded TradingView Pine Script that highlights the background green/red on days when these ATR breakout conditions
Cari dalam skrip untuk "ATR"
ATR Dynamische Candles 1.2 (by Droes)This script visualizes ATR values as candles to the right of the last candle at today's high and today's low.
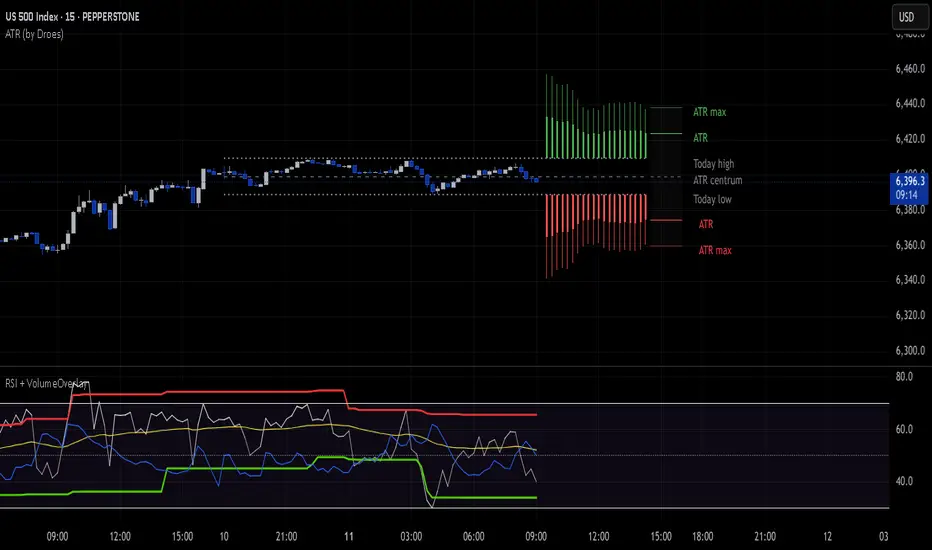
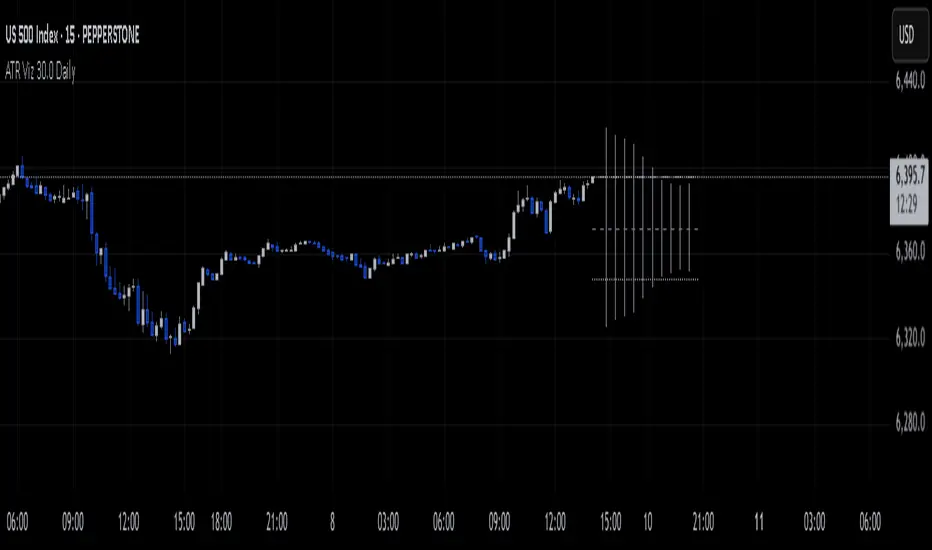
ATR Daily Viz V30.0This script visualizes ATR values as candles to the right of the last candle at today's high and low.
This is the first version.

ATR Daily Viz V30.0This script visualizes ATR values as candles to the right of the last candle at today's high and low.
This is the first version.
ATR % Oscillator - DolphinTradeBot1️⃣ Overview
🔸 This is a simplified version of ATR and TR that shows volatility as percentage changes , making it easier to compare two symbols.
🔸 The indicator compares the volatility of two different assets by calculating the percentage-based price ranges and their moving averages .
📌 This is especially useful for pair traders, as it helps identify which symbol is more volatile, allowing for strategic decisions based on relative movement rather than overall market direction.
2️⃣ How Is It Work?
🔸 For each symbol, it calculates the absolute percentage difference between either:
• Close and Open (net price change), or
• High and Low (daily price range).
🔸 The results are visualized as column bars — the taller the bar, the higher the volatility.
🔸 It also plots a moving average line (SMA) based on the selected range length.
📌 These calculations are independent of the chart you're on — they work purely based on the two selected symbols.
If no symbols are selected, it defaults to using the current chart's symbol.
3️⃣ How to Use It?
With this indicator, you can:
🔸 Compare the volatility between two assets.
🔸 Detect sudden volatility spikes that may signal upcoming momentum.
🔸 Support spread, arbitrage, or correlation-based strategies .
🔸 See which symbol is gaining market attention (a larger difference = more activity).
Example: Compare BTC vs ETH to see which one is dominating in terms of price action or volatility.
4️⃣⚙️ Settings
🔸 Symbol Settings
• Symbol-1 / Symbol-2: Choose the two assets to compare.
• Checkboxes: Enable/disable visibility for each symbol's data.
🔸 Calculation Settings
• Range Average: The number of bars used for the moving average.
• Calculation Source:
- Close-Open: Measures net price movement.
- High-Low: Measures total price range.

ATR 3x Multiplier StrategyBeta version
Volatility and Candle Spikes in Trading
Volatility
Volatility refers to the degree of variation in the price of a financial asset over time. It measures how much the price fluctuates and is often associated with risk and uncertainty in the market. High volatility means larger price swings, while low volatility indicates more stable price movements.
Key aspects of volatility:
Measured using indicators like Average True Range (ATR), Bollinger Bands, and Implied Volatility (IV).
Influenced by factors such as market news, economic events, and liquidity.
Higher volatility increases both risk and potential profit opportunities.
Candle Spikes
A candle spike (or wick) refers to a sudden price movement that forms a long shadow or wick on a candlestick chart. These spikes can indicate strong buying or selling pressure, liquidity hunts, or stop-loss triggers.
Types of candle spikes:
Bullish Spike (Long Lower Wick): Indicates buyers rejected lower prices, pushing the price higher.
Bearish Spike (Long Upper Wick): Suggests sellers rejected higher prices, pushing the price lower.
Stop-Loss Hunt: Market makers may trigger stop-losses by creating artificial spikes before reversing the price.
News-Induced Spikes: Economic data releases or unexpected events can cause sudden price jumps.
Understanding volatility and candle spikes can help traders manage risk, spot entry/exit points, and avoid false breakouts. 🚀📈

ATR Daily BandThis indicator draws an upper and lower band for each day. It uses the Average True Range calculation (with configurable lookback) and places the band at 1ATR above and 1ATR below the daily open.
I use this indicator as a simple gauge to tell how significant price movement is, and get a feel for the daily volatility. Due to the fractal nature of price action, it can be difficult to determine if a price movement is significant while zoomed in on a single intraday chart. Using this indicator, I can tell if the price action is approaching the ATR or if it's just staying within the band.
Strategies: Useful for both mean reversion and momentum strategies. It's up to you to decide how this metric will fit into your trading strategy. I currently use this indicator to look for mean reversion setups, but that is due to the current market conditions and my personal trading style.


ATR Trend FollowingThe script filters stocks on the basis of ATR. If the stock has moved above 7 times the ATR from the lows, the system generates buy signal and continues till the stock drops by 2 ATR. It is a good system in trending markets however in sideways consolidating markets, the system must be avoided. In trending markets it can generate good returns with significant Risk to Reward Ratio. Use it in confirmation with other trend depicting indicators is expected to generate better results.

ATR Range ProbabilityUse ATR for measure range probability reversal or target line calculate by close price +- %ATR
Default line and table show -100 to 100%, And the rest can add in setting tab max 200%
- This release measure base on TF D, Line and Table appear on TF D and lower
- Table show range %ATR ,data and difference form current price ,
- line price and text need to be update.

ATR khakestarIt gives you average atr in multi time frames and you can use it to measure moves in price legs.

ATR vs Daily DeltaThis indicator follows the idea of the average true range indicator, but splits red candles from green candles. It also displays daily deltas as a histogram chart. Finally, it allows you to "normalize" the indicator, which displays period percentage moves (shown in decimal form) instead of period deltas, and calculates the ATR from those percentages instead of period deltas.

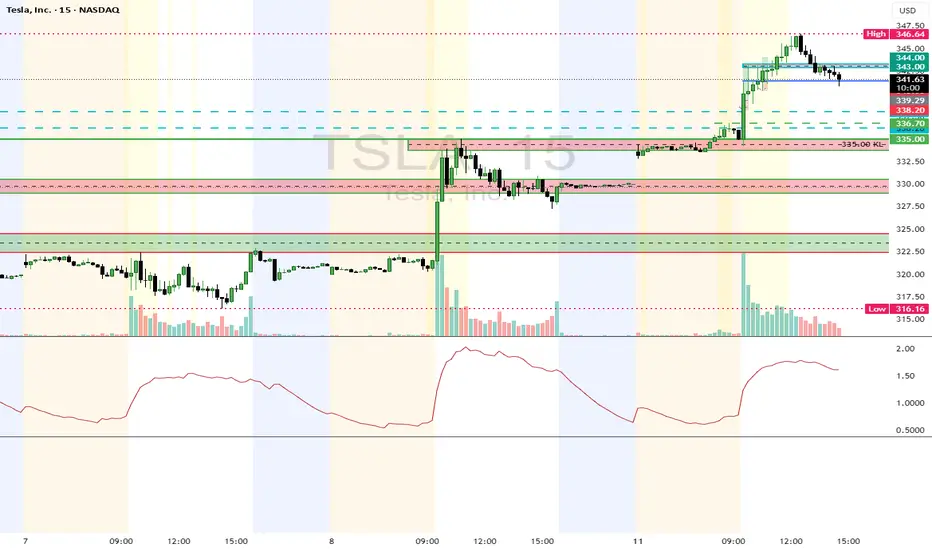
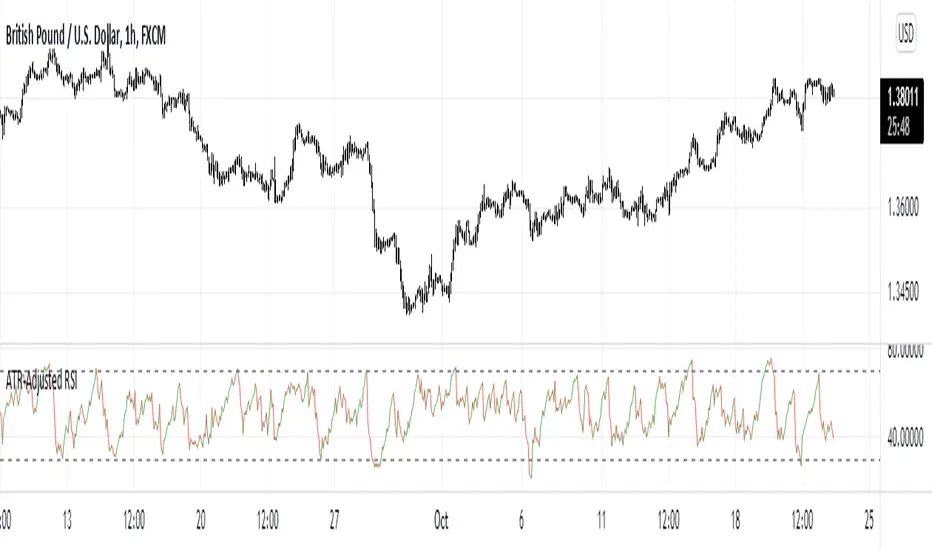
ATR-Adjusted RSIThis indicator adjusts the RSI values using the Average True Range. It is used the same way as a normal RSI.
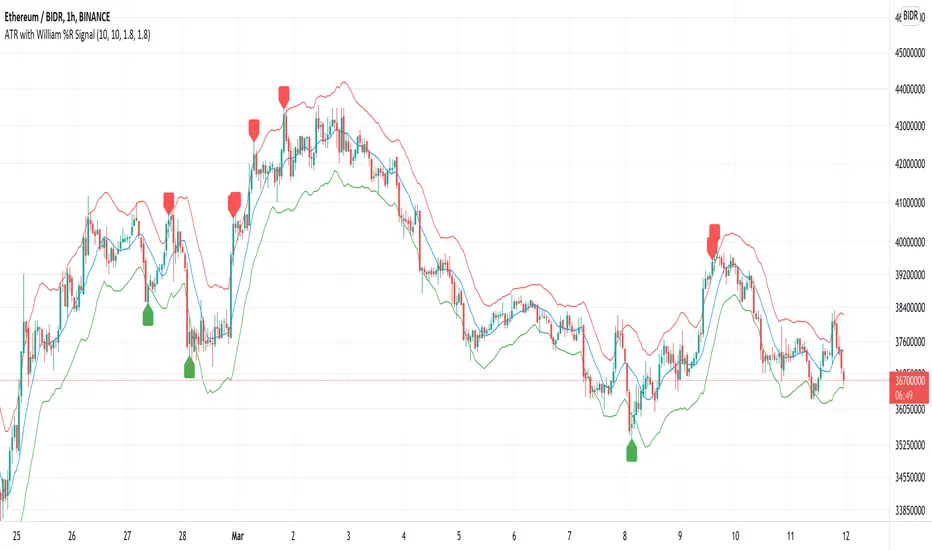
ATR-%RThis indicator uses a combines the "Williams %R" and "ATR_Normalized" indicators to find potential price tops and bottoms, as suggested by simultaneous extreme values on both of the aforementioned indicators.

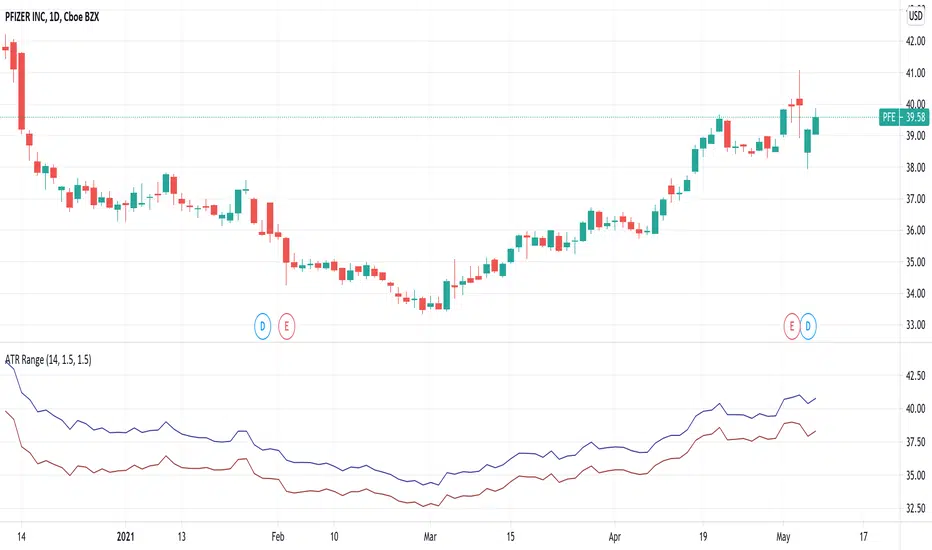
ATR RangeUseful in case you use Average True Range to determine Shows Stop Loss and Take Profit price levels.
For example, if you want to put Stop Loss with a distance of 1.5xATR and Take Profit 2xATR for a long trade, put 1.5 as Lower Factor and 2 as Upper Factor. Lower and Upper prices will show price levels for SL and TP respectively.
ATR Volatility Stop by CanUk101Attempts to put a line on the chart that can trigger a stop alert. Based on ATR volatility.
A work in progress, feel free to help improve it.

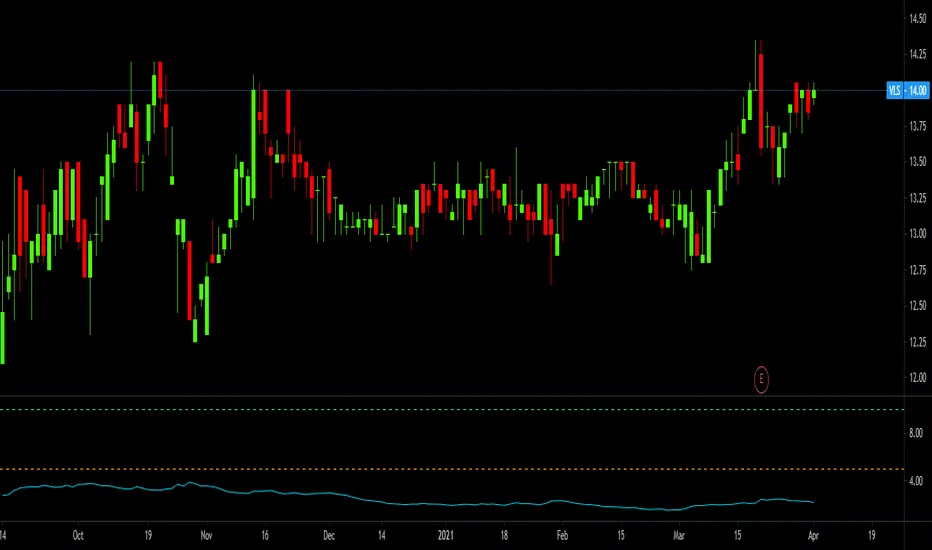
ATR PercentAverage True Range in Percent to price
- 2 customizable horizontal line: to be used as custom levels.
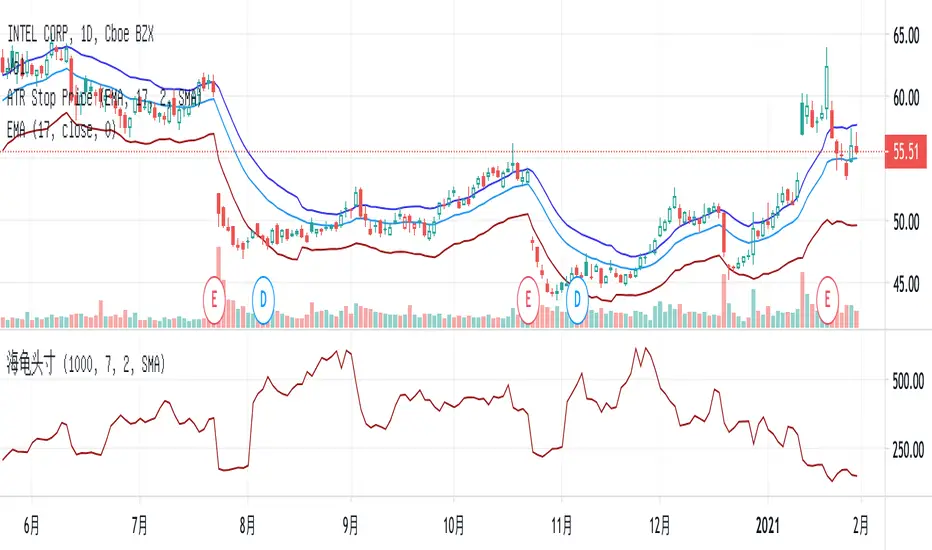
ATR Stop PriceSet stop price and add-position price according to the cost and current ATR.
You may set an alert with the condition when the stock price crossing down the Stop Price.
Example:
stock price: $150
volatility multiple: 2
current ATR: $3
stop price = $150 - $3 * 2 = $144
add-position price = $150 + $3 * 2 / 2 = $153
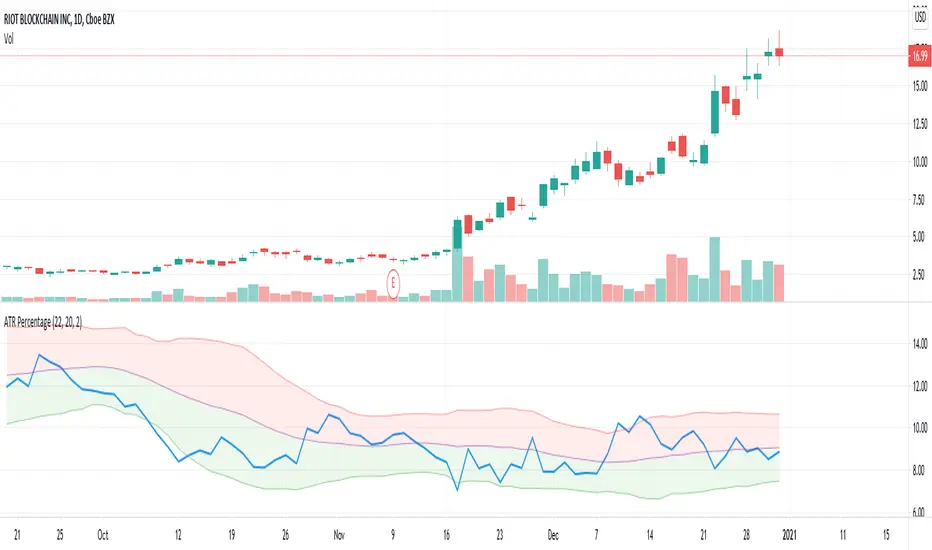
ATR PercentageThis indicator plots ATR as percentage of close price. Also applying bollinger bands on it to visualize it is relatively high or low.
ATR-Based Moving Average EnvelopesSimple MA envelopes, but the distance which the MA is projected is dependent on ATR. User chooses MA length, ATR length. Additionally, there is a multiplier which can be used to project the bands additional X amount of ATR.

ATR COG (Joy Bangla)Notes:
Black crosses indicate squeeze. It means an impending move once squeeze is released
Price tends to go from red dot to green dot to red dot to green dot to red dot in an endless cycle. We wait for the price bar to not touch the dots before we make a move
If the price goes between the dots and the lines, it means it is likely overheated/oversold respectively
If the price moves above the top line, it means the market is super overbought
If the price moves below the bottom line, it means the market is super oversold
This is an updated version 4 script from Lazy Bear's code as found from here
The update is there to ensure we can have alerts successfully set on Trading View

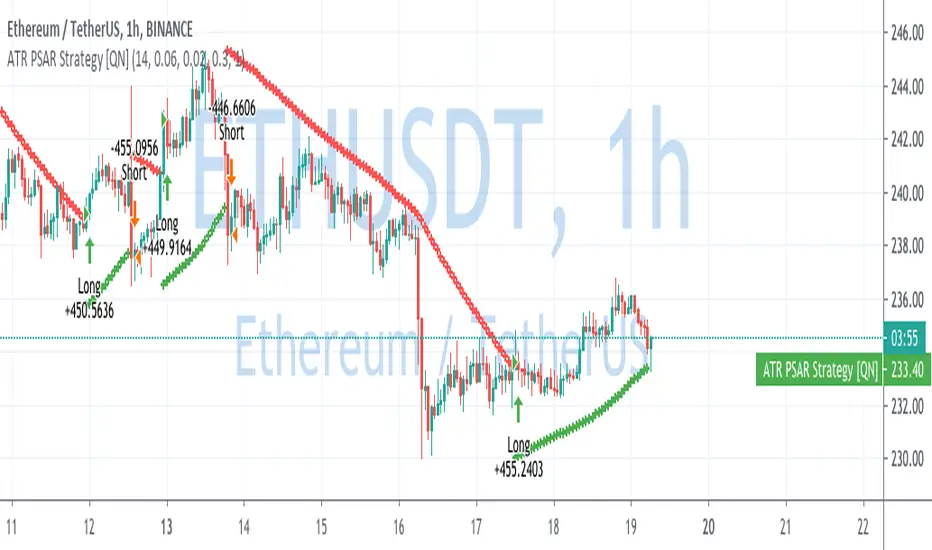
ATR Parabolic SAR Strategy [QuantNomad]I created a version of Parabolic SAR when I accelerate it not based on the difference from the extreme point but based on current ATR. So the idea is that for a more volatile market it should move faster.
Performance is calculated based on 25% equity invested and 0.1% commission.
What do you think about it? Does it make sense to do something like that?
Do you have in mind other ways I can accelerate it when the market starts to be more volatile?
Disclaimer
Please remember that past performance may not be indicative of future results.
Due to various factors, including changing market conditions, the strategy may no longer perform as good as in historical backtesting.
This post and the script don’t provide any financial advice.