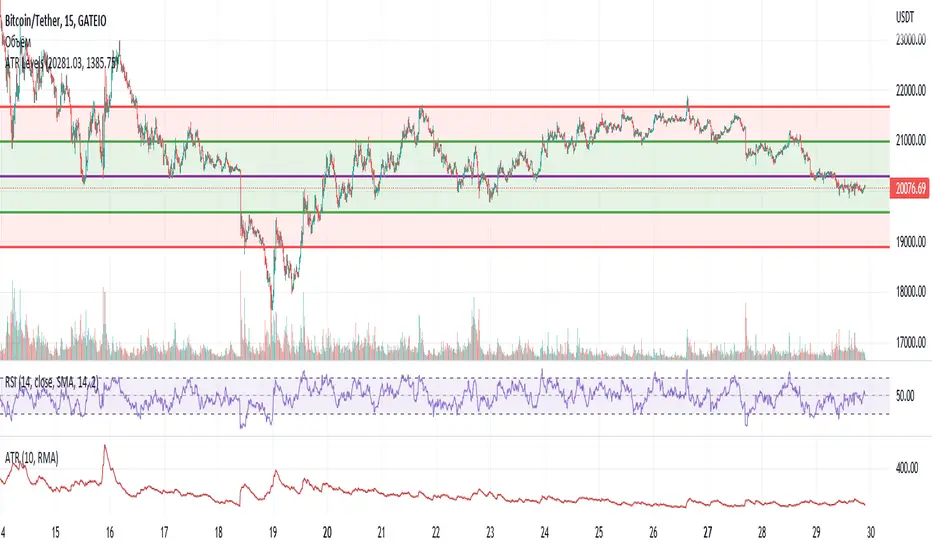
ATR LevelsATR Levels
The indicator plots levels based on the ATR indicator
Initial data required for the indicator:
- Open price
- ATR
Levels are calculated as follows:
1. Open price +100% ATR
2. Open price +50% ATR
3. Open price
4. Open price -50% ATR
5. Open price -100% ATR
For visual convenience:
The area between levels 1-2 and 4-5 is filled with red
Zone between levels 2-4 - filled with green
Уровни среднего истинного диапазона
Индикатор строит уровни, основанные на индикаторе ATR (Средний истинный диапазон)
Исходные данные, необходимы для индикатора:
- Цена открытия
- ATR (Средний истинный диапазон)
Уровни рассчитываются следующим образом:
1. Цена открытия +100% ATR
2. Цена открытия +50% ATR
3. Цена открытия
4. Цена открытия -50% ATR
5. Цена открытия -100% ATR
Для удобства визуального восприятия:
Зона между уровнями 1-2 и 4-5 заполнена красным цветом
Зона между уровнями 2-4 - заполнена зеленым цветом
Cari dalam skrip untuk "ATR"
[mya] ATR FilteredATR Filtered for NNFX trading.
A classic Average True Range (ATR) indicator with a simple feature to filter out the spikes.
The ATR value is the tool to determine your TP and SL on daily time-frame, specifically in the NNFX way of trading.
VP mentions in his podcast that when the ATR spikes up you have 2 options: 1. wait 14 candles for the ATR to normalize, 2. use the ATR value prior to the spike.
ATR spikes are easy to spot (thus easy to exclude) for an itraday flash crash.
On the other hand when volatility increases over several candles (as in the Covid-19 shock) it can be difficult to determine which ATR value to base your TP/SL on.
In definition of standard deviation, 95.4% of the value will fall within the 2 sigma bands. Therefore the rest 4.6% can be filtered out as an extreme value (a spike).
The ATR in this indicator will plot the standard ATR value in normal condition, then when the ATR spike happens it will stay at the highest value at the point, when the ATR exceeded its 2 sigma band.
The filtering will reset when the ATR comes back down below the extended highest value.
*Disclaimer: Use at your own risk. I am not a programmer, just another guy trying to beat this game. Let's go get it.

ATR by Time [QuantVue]"ATR by Time" incorporates time-specific volatility patterns by calculating the Average True Range (ATR) over a customizable period and comparing it to historical ATR values
at specific times of the day.
The Average True Range (ATR) is a popular technical indicator that measures market volatility by decomposing the entire range of an asset price for that period.
By taking the ATR at certain times of the day and comparing it to the current bar's ATR, traders can gain several potential advantages:
Volatility Pattern Recognition: Different times of the trading day often exhibit different levels of volatility. For instance, markets might be more volatile at the open and close compared to midday. By tracking ATR at specific times, traders can recognize these patterns and better predict periods of high or low volatility.
Risk Management: Understanding volatility trends throughout the day helps in better risk management. During periods of high expected volatility (indicated by higher ATR compared to the historical average), traders can adjust their stop-loss levels and position sizes accordingly to protect their capital.
Trend Confirmation and Divergence: This indicator can help confirm trends or identify potential reversals. For example, if the current ATR consistently exceeds the average ATR at specific times, it may confirm a strong trend. Conversely, if the current ATR falls below the historical average, it could signal a potential slowdown or reversal.
This indicator will work on all markets on all time frames. User can customize ATR length as well as the lookback period.
This script utilizes TradingView's RelativeValue library and averageAtTime function, which is used to compare a current data point in a time interval to an average of data points with corresponding time offsets across historical periods. Its purpose is to assess the significance of a value by considering the historical context within past time intervals.
Give this indicator a BOOST and COMMENT your thoughts!
We hope you enjoy.
Cheers!

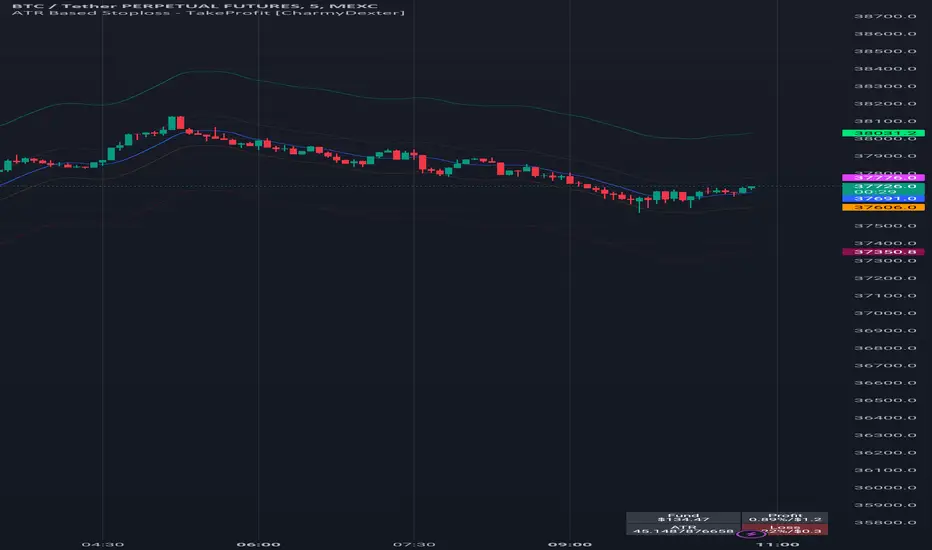
ATR Based Stoploss - TakeProfit [CharmyDexter]
This script combines the power of Average True Range (ATR) and a Moving Average (MA) to dynamically set stop-loss and take-profit levels. It introduces a volatility surge condition and includes a risk management table for comprehensive trade insights.
1) **Originality:**
- This script is original in its approach to combining Average True Range (ATR) with a Moving Average (MA) to create a dynamic stop-loss and take-profit strategy. The addition of a volatility surge condition and the inclusion of a risk management table further contribute to its uniqueness.
2) **Functionality:**
- The script aims to provide traders with a dynamic stop-loss and take-profit strategy based on ATR, incorporating a volatility surge condition and a moving average. The risk management table displays crucial information, including the fund size, potential profit/loss, ATR values, and risk.
3) **Operation:**
- The script uses ATR to calculate volatility, identifying surges in volatility. It adjusts the stop-loss and take-profit levels based on the average of ATR during these surge periods. The moving average acts as a trend indicator, and the script dynamically adjusts stop-loss and take-profit levels accordingly.
4) **Usage:**
- Traders can use this script by applying it to their preferred financial instrument's chart. The script automatically plots the moving average and dynamically adjusts stop-loss and take-profit levels based on ATR and volatility surges. Users can observe the levels on the chart for potential trade management.
5) **Concepts:**
- The script employs concepts of ATR for volatility, moving average for trend identification, and a dynamic adjustment mechanism during volatility surges. Risk management is incorporated by calculating potential profit/loss percentages based on user-defined risk.
6) **Mashup Explanation:**
- The script combines ATR, moving average, and volatility conditions to create a comprehensive strategy. ATR determines the market's volatility, the moving average serves as a trend indicator, and volatility surges trigger dynamic adjustments to stop-loss and take-profit levels. The risk management table enhances the script's utility.
7) **Line Descriptions:**
- Blue Line (Moving Average): Indicates the trend direction.
- Lime Line (Long Take Profit): Represents the level for taking profit in a long position.
- Maroon Line (Short Take Profit): Represents the level for taking profit in a short position.
- Fuchsia Line (Short Stop Loss): Represents the level for setting a stop loss in a short position.
- Orange Line (Long Stop Loss): Represents the level for setting a stop loss in a long position.
8) **Line Usage:**
- Use the blue line for trend identification.
- When taking long positions, the close should be above the blue line.
- For long positions, the lime line is a potential take-profit level, and the orange line is a potential stop-loss level.
- For short positions, the maroon line is a potential take-profit level, and the fuchsia line is a potential stop-loss level.
- The risk management table provides insights into fund size, potential profit/loss, ATR values, and risk.
Note: The profit/loss calculations in this script may not be entirely accurate due to factors like market execution. Market execution may not always occur at the exact levels specified by the script due to slippage or delays in order processing. This can impact the realized profit or loss compared to the calculated levels.
It is crucial to note that this ATR Based Stop-loss - Take-Profit indicator is merely one tool among many that traders can employ to establish trading targets. Additional technical indicators are essential for taking trades and making informed decisions.
Commented-out sections for alerts and shape plotting are provided, allowing for visual and auditory notifications if desired.
It's crucial for traders to be aware of these factors and use the script as a tool within a broader trading strategy. Additionally, regular monitoring and adjustments based on real-time market conditions are recommended to enhance the accuracy of profit/loss assessments.
ATR TRex [ipooya]To appreciate dear Mr.Khakestar efforts I have converted his mt4 ATR formula to pine script. All credits go to him.
you can view the ATR result of each candle in the past:
The first black number is the ATR of the M1 chart.
The second black number is the ATR of the M5chart.
The third black number is the ATR of the M15 chart.
The fourth black number is the ATR of the H1 chart.
The fifth black number is the ATR of the H4 chart.
The sixth black number is the ATR of the Daily chart.
The seventh black number is the ATR of the Weekly chart.
**and the second number of every line is live ATR ( current ATR candle)
What makes this ATR formula so different?
This formula invented by Mr.Khakestar and it shows the power of the price to move in each cycle of the chart. We can use it in RTM strategy and Price Action trading. To learn how to use it you need to learn TRex strategy (Presented by Mr.Khakestart for free in Persian).

ATR Stop-Loss with Fibonacci Take-Profit [jpkxyz]ATR Stop-Loss with Fibonacci Take-Profit Indicator
This comprehensive indicator combines Average True Range (ATR) volatility analysis with Fibonacci extensions to create dynamic stop-loss and take-profit levels. It's designed to help traders set precise risk management levels and profit targets based on market volatility and mathematical ratios.
Two Operating Modes
Default Mode (Rolling Levels)
In default mode, the indicator continuously plots evolving stop-loss and take-profit levels based on real-time price action. These levels update dynamically as new bars form, creating rolling horizontal lines across the chart. I use this mode primarily to plot the rolling ATR-Level which I use to trail my Stop-Loss into profit.
Characteristics:
Levels recalculate with each new bar
All selected Fibonacci levels display simultaneously
Uses plot() functions with trackprice=true for price tracking
Custom Anchor Mode (Fixed Levels)
This is the primary mode for precision trading. You select a specific timestamp (typically your entry bar), and the indicator locks all calculations to that exact moment, creating fixed horizontal lines that represent your actual trade levels.
Characteristics:
Entry line (blue) marks your anchor point
Stop-loss calculated using ATR from the anchor bar
Fibonacci levels projected from entry-to-stop distance
Lines terminate when price breaks through them
Includes comprehensive alert system
Core Calculation Logic
ATR Stop-Loss Calculation:
Stop Loss = Entry Price ± (ATR × Multiplier)
Long positions: SL = Entry - (ATR × Multiplier)
Short positions: SL = Entry + (ATR × Multiplier)
ATR uses your chosen smoothing method (RMA, SMA, EMA, or WMA)
Default multiplier is 1.5, adjustable to your risk tolerance
Fibonacci Take-Profit Projection:
The distance from entry to stop-loss becomes the base unit (1.0) for Fibonacci extensions:
TP Level = Entry + (Entry-to-SL Distance × Fibonacci Ratio)
Available Fibonacci Levels:
Conservative: 0.618, 1.0, 1.618
Extended: 2.618, 3.618, 4.618
Complete range: 0.0 to 4.764 (23 levels total)
Multi-Timeframe Functionality
One of the indicator's most powerful features is timeframe flexibility. You can analyze on one timeframe while using stop-loss and take-profit calculations from another.
Best Practices:
Identify your entry point on execution timeframe
Enable "Custom Anchor" mode
Set anchor timestamp to your entry bar
Select appropriate analysis timeframe
Choose relevant Fibonacci levels
Enable alerts for automated notifications
Example Scenario:
Analyse trend on 4-hour chart
Execute entry on 5-minute chart for precision
Set custom anchor to your 5-minute entry bar
Configure timeframe setting to "4h" for swing-level targets
Select appropriate Fibonacci Extension levels
Result: Precise entry with larger timeframe risk management
Visual Intelligence System
Line Behaviour in Custom Anchor Mode:
Active levels: Lines extend to the right edge
Hit levels: Lines terminate at the breaking bar
Entry line: Always visible in blue
Stop-loss: Red line, terminates when hit
Take-profits: Green lines (1.618 level in gold for emphasis)
Customisation Options:
Line width (1-4 pixels)
Show/hide individual Fibonacci levels
ATR length and smoothing method
ATR multiplier for stop-loss distance

ATR/DTR with Custom Percentage DisplayThis Pine Script indicator provides a detailed view of the Average True Range (ATR) and Daily True Range (DTR), along with additional calculated metrics to assist in analyzing price volatility. The key features of the indicator include:
ATR Calculation:
The ATR is calculated over a user-defined timeframe, allowing traders to assess average market volatility over a specific period.
DTR Calculation:
The DTR represents the absolute range (high - low) of the current or chosen timeframe, providing insights into the day's price movement.
ATR/DTR Percentage:
This metric calculates the DTR as a percentage of the ATR, showing how the daily range compares to the average range, with dynamic coloring to highlight when it exceeds a user-defined threshold.
Custom Percentage of ATR:
Users can input a custom percentage to calculate and display a corresponding value of the ATR. For example, entering 15% will compute and display 15% of the ATR in the indicator’s table.
Dynamic Table Display:
The indicator outputs all these metrics in a well-organized table that is overlaid on the chart. The table includes:
ATR
DTR
ATR/DTR percentage
The user-defined percentage of ATR
Customizable Features:
Color Coding: The table dynamically changes its background color when the ATR/DTR percentage exceeds a user-defined threshold.
Placement Options: The table's position on the chart can be adjusted (e.g., bottom-right, top-center) for optimal visibility.
Use Case:
This indicator is ideal for traders who want a deeper understanding of market volatility and prefer visual representation of how current price movements compare to historical averages. It is especially useful for:
Setting volatility-based stop-loss levels.
Identifying high-volatility trading opportunities.
Tailoring strategies around price movement patterns.

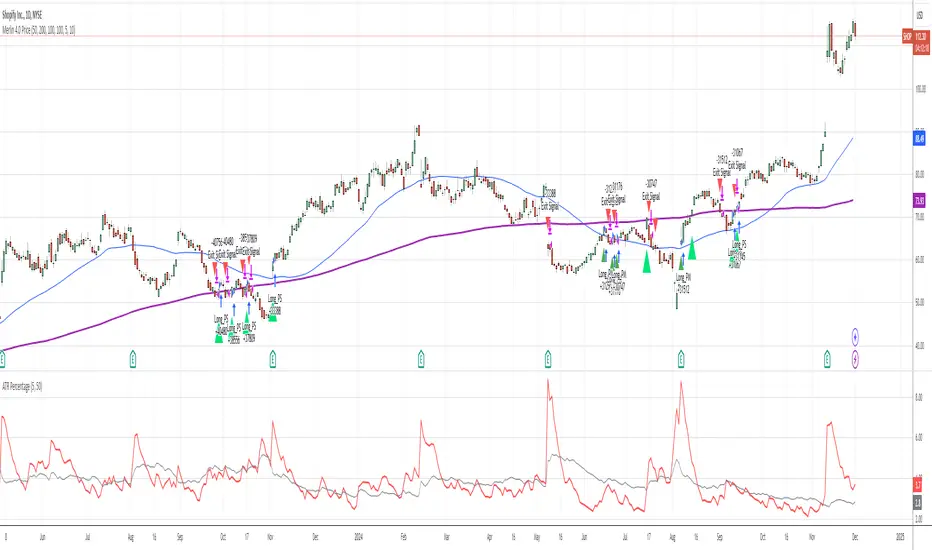
ATR PercentageThe ATR is a great indicator, but for me, it does not define the volatility of an asset I am looking at well enough. So I've adjusted it to be displayed as the usual ATR and a percentage of the closing prince (which to me tells a better story). I find this useful if I am looking through many assets and have to create a quick picture of volatility.
Indicator Definition: The script starts by defining an indicator named "ATR Percentage" that will be displayed in a separate pane (not overlayed on the price chart).
Input for ATR Period: The user can set the period for calculating the ATR through an input field.
ATR Calculation: The ta.atr function calculates the Average True Range based on the specified period.
ATR Percentage Calculation: The ATR value is converted to a percentage of the current closing price using (atrValue / close) * 100.
Plotting:
The script plots both the ATR value and its percentage on the chart.
A horizontal line at zero is added for reference.
Label Display: An optional label displays the current ATR percentage at every 10th bar to avoid cluttering the chart.
Background Color: A light blue background is added to visually separate the ATR indicator from other indicators.
ATR Oscillator - Index (Average True range Oscillator)The purpose of converting the ATR value indicator to an oscillator;
It is known that the ATR value is not between the two specified values. So it is not compressed between 0 and 100 like RSI and %B etc. Therefore, conditions such as "A condition if ATR value is X, B condition if ATR value is Y" cannot be created. In order to create these conditions, the max and min value range of the ATR value must be determined. This indicator converts the ATR values into a percentage number according to the maximum and minimum ATR values in the period you will choose. Max value is 100, min value is 0. The considered ATR value, on the other hand, corresponds to the % of the difference between the max and min value in the selected period.
In this way, conditions such as "If the ATR Oscillator value is greater than 10 or 20 or 30" can now be created, or the value of another indicator can be calculated based on the ATR Oscillator value. For example; Let's say we want the standard deviation of BBand to change according to the value of the ATR Oscillator. If BBand Standard Deviation is 3 if ATRO value is 100, BBand Standard Deviation is 2 if ATRO value is 0, and BBand Standard Deviation is 2.5 when ATRO value is 50;
We can encode it as BBand_Std_Dev=((ATRO*0.01)+2 )
If the ATRO value is between .... and ...., you can make improvements such as plot color X.

ATR Trading SetupThis simple script base on function of ATR Trailing Stop (aka SuperTrend) to plot Trading Setup on chart with detail as below:
1. Type of Average True Range (ATR)
+ The function calculate ATR may base on 1 of 3 type of Average: RMA, SMA, EMA
2. Trading Setup
2.1 Long setup
+ SuperTrend is upTrend
+ Entry Long at (or below) last value ATR Trailing Stop of Previous Trend (DownTrend)
+ Stop loss at first value ATR Trailing Stop of now Trend (upTrend)
+ Take profit at first value ATR Trailing Stop of Previous Trend (downTrend)
+ Move stop loss follow ATR Trailing Stop (green dot)
2.1 Short setup
+ SuperTrend is downTrend
+ Entry Short at (or above) last value ATR Trailing Stop of Previous Trend (upTrend)
+ Stop loss at first value ATR Trailing Stop of now Trend (downTrend)
+ Take profit at first value ATR Trailing Stop of Previous Trend (upTrend)
+ Move stop loss follow ATR Trailing Stop (red dot)

ATR Adjusted RSIATR Adjusted RSI Indicator
By Nathan Farmer
The ATR Adjusted RSI Indicator is a versatile indicator designed primarily for trend-following strategies, while also offering configurations for overbought/oversold (OB/OS) signals, making it suitable for mean-reversion setups. This tool combines the classic Relative Strength Index (RSI) with a unique Average True Range (ATR)-based smoothing mechanism, allowing traders to adjust their RSI signals according to market volatility for more reliable entries and exits.
Key Features:
ATR Weighted RSI:
At the core of this indicator is the ATR-adjusted RSI line, where the RSI is smoothed based on volatility (measured by the ATR). When volatility increases, the smoothing effect intensifies, resulting in a more stable and reliable RSI reading. This makes the indicator more responsive to market conditions, which is especially useful in trend-following systems.
Multiple Signal Types:
This indicator offers a variety of signal-generation methods, adaptable to different market environments and trading preferences:
RSI MA Crossovers: Generates signals when the RSI crosses above or below its moving average, with the flexibility to choose between different moving average types (SMA, EMA, WMA, etc.).
Midline Crossovers: Provides trend confirmation when either the RSI or its moving average crosses the 50 midline, signaling potential trend reversals.
ATR-Inversely Weighted RSI Variations: Uses the smoothed, ATR-adjusted RSI for a more refined and responsive trend-following signal. There are variations both for the MA crossover and the midline crossover.
Overbought/Oversold Conditions: Ideal for mean reversion setups, where signals are triggered when the RSI or its moving average crosses over overbought or oversold levels.
Flexible Customization:
With a wide range of customizable options, you can tailor the indicator to fit your personal trading style. Choose from various moving average types for the RSI, modify the ATR smoothing length, and adjust overbought/oversold levels to optimize your signals.
Usage:
While this indicator is primarily designed for trend-following, its OB/OS configurations make it highly effective for mean-reverting setups as well. Depending on your selected signal type, the relevant indicator line will change color between green and red to visually signal long or short opportunities. This flexibility allows traders to switch between trending and sideways market strategies seamlessly.
A Versatile Tool:
The ATR Adjusted RSI Indicator is a valuable component of any trading system, offering enhanced signals that adapt to market volatility. However, it is not recommended to rely on this indicator alone, especially without thorough backtesting. Its performance varies across different assets and timeframes, so it’s essential to experiment with the parameters to ensure consistent results before applying it in live trading.
Recommendation:
Before incorporating this indicator into live trading, backtest it extensively. Given its flexibility and wide range of signal-generation methods, backtesting allows you to optimize the settings for your preferred assets and timeframes. Only consider using it on it's own if you are confident in its performance based on your own backtest results, and even then, it is not recommended.

ATR Bands (MA Distance)ATR Bands (MA Distance) plots volatility-based bands at a multiple of ATR away from a selected moving average.
Unlike percentage envelopes or standard deviation bands, this indicator measures distance from the moving average using ATR, representing the market’s normal “breathing range” rather than statistical probability.
Key Features
The center line is a selectable moving average (EMA, SMA, RMA/Wilder, or WMA).
Upper and lower bands are calculated as:
Moving Average ± ATR × Multiplier
Band width automatically adapts to changing market volatility.
Designed for consistent use across different markets and timeframes without parameter re-optimization.
Non-repainting: all values are calculated only from confirmed historical bars.
Intended Use
ATR Bands (MA Distance) is best used as a context and preparation tool , not as a direct entry or exit signal.
Typical use cases include:
Identifying areas where price is extended relative to its recent volatility.
Visualizing normal vs. stretched price distance from the moving average.
Supporting range-based analysis or trade preparation when combined with other indicators (e.g., oscillators).
Important Notes / How NOT to Use
This indicator does NOT generate buy or sell signals by itself .
Touching or crossing a band does not imply an automatic reversal.
In strong trending markets, price may stay outside the bands for extended periods.
ATR Bands should not be interpreted as overbought/oversold levels on their own.
This indicator does NOT repaint. Once a bar is closed, its values will not change.
For best results:
Use ATR Bands as a preparation zone, then wait for confirmation from your own entry logic.
Disable or ignore band-based mean-reversion ideas during strong trend conditions.
Concept Summary (Short)
ATR Bands (MA Distance) visualize how far price has moved from its moving average in terms of volatility, without repainting and without relying on percentage deviation or statistical assumptions.
Optional Short Description (Preview)
Volatility-based, non-repainting ATR bands plotted at a distance from a moving average.
Designed for market context and trade preparation — not standalone signals.

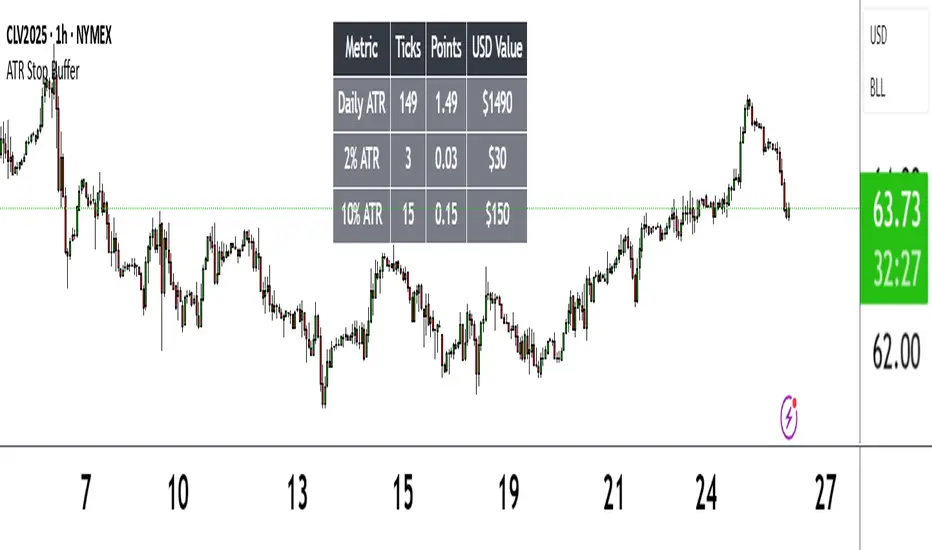
ATR Stop BufferThe ATR Stop Buffer indicator calculates the Daily Average True Range (ATR) and converts it into ticks based on the symbol's minimum price movement. It then displays the full ATR, 2% of ATR, and 10% of ATR in a clean table format, rounded up for simplicity. This tool is ideal for traders who want to set volatility-based stop-loss levels or buffers for their trades.
Key Features:
- Uses a 14-period Daily ATR for robust volatility measurement.
- Converts ATR into ticks for precise application across different instruments.
- Table display with toggle option for flexibility.
- Perfect for risk management and trade planning.
How to Use:
1. Add the indicator to your chart.
2. Use the table values to adjust your stop-loss distances (e.g., 2% ATR for tight stops, 10% ATR for wider buffers).
3. Toggle the table off if you only need the values occasionally.
Note: Works best on instruments with defined tick sizes (e.g., futures, forex, stocks).
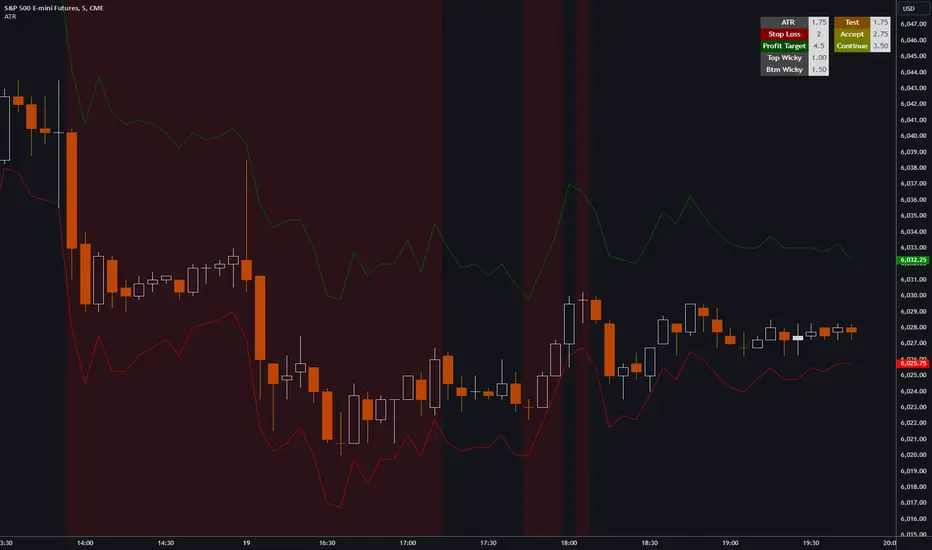
ATR, Chop, Profit Target and Stop Loss TableThe ATR Table indicator is a versatile tool that helps traders visually and quantitatively manage risk, identify market conditions, and set profit targets and stop-loss levels. It is designed to enhance decision-making by incorporating key volatility and chop (market consolidation) signals into a comprehensive table format.
Key Features:
Average True Range (ATR) Calculation : The indicator computes the ATR over a user-defined period (default 14). ATR helps to measure market volatility, providing insights into how much an asset's price typically moves within a given period.
Stop Loss and Profit Target Calculation : You can configure stop-loss and profit target levels using multipliers based on the ATR. This allows dynamic risk management that adjusts to market volatility:
Stop Loss : Defined as a multiple of the ATR to help control losses.
Profit Target : Also based on a multiple of the ATR to lock in gains. The user can specify whether they are trading long or short, and the indicator adjusts the levels accordingly.
Customizable Plot Lines : The indicator can display the Stop Loss and Profit Target levels directly on the chart. Users can toggle these lines on or off and customize their colors.
Chop Signa l: The indicator highlights potential consolidation periods (chop) using a wick-based analysis. It calculates the highest upper or lower wick values and compares them to the ATR to detect periods of indecision or consolidation.
Table Display : When these wick values exceed the ATR by a user-defined multiplier, the corresponding table rows are highlighted.
Background Alerts : Optionally, users can activate background color changes on the chart to visually alert them when chop conditions are detected.
Customizable Table Layout : A table displaying the key values (ATR, Stop Loss, Profit Target, Upper/Lower Wickiness) is placed on the chart. You can choose the table's position, adjust its color scheme, and decide which rows to display.
Chop Background Customization : For users who prefer more visual cues, the indicator allows you to enable or disable background shading when chop conditions are met. You can also choose the color of this background for better customization.
ATR profit and loss linesWhat is ATR?
Taking a candlestick, the following 3 transactions are calculated:
1-The difference between the high of the day and the low of the day
2-The difference between today's high and yesterday's close
3-The difference between today's low and yesterday's close
Atr takes the average of these 14-day candlesticks after making their calculations and it predicts how high or low a candle can go and these give us support and resistance helps with points
If you have noticed a rise in your chart and have no idea how high it will go, you can use Atr profit and loss lines.
The red zone is the stop point, the blue zones are the snow zones.
Must be used with macd. macd is validator.
There is an increase in your chart, you opened the atr profit and loss lines upwards and if macd gives you an increase, it is recommended that you enter the trade at that time. It is recommended to increase your loss line 1 step in the direction of profit every 2 profit breaks on atr profit and loss lines.
ATR Nedir?
Bir mum barı ele alınarak şu 3 işlem hesaplanır:
1-Günün yükseği ile günün düşüğü farkı
2-Günün yükseği ile dünün kapanışının farkı
3-Günün düşüğü ile dünkü kapanışın farkı
ATR ise 14 günlük bu mum barlarının hesaplarını yaptıktan sonra ortalamasını alır ve bir mumum ne kadar yükselip düşebileceği konusunda tahmin verir ve bunlar bize destek ve direnç noktaları konusunda yardımcı olur
Eğer grafiğinizde bir yükseliş farketmişseniz ne kadar yükseleceği konusunda fikriniz yoksa Atr kar zarar çizgilerini kullanabilirsiniz.
Kırmızı bölge durdurma noktası,mavi bölgeler kar bölgeleridir.
Macd ile birlikte kullanılmalıdır.macd doğrulayıcıdır.
Grafiğinizde yükseliş var,atr kar zarar çizgilerini yukarı yönlü açtınız ve macd size yükseliş veriyorsa işte o sırada işleme girmeniz tavsiye edilir.atr kar zarar çizgilerinde her 2 kar kırılımında bir zarar çizginizi kar yönünde 1 kademe arttırmanız önerilir

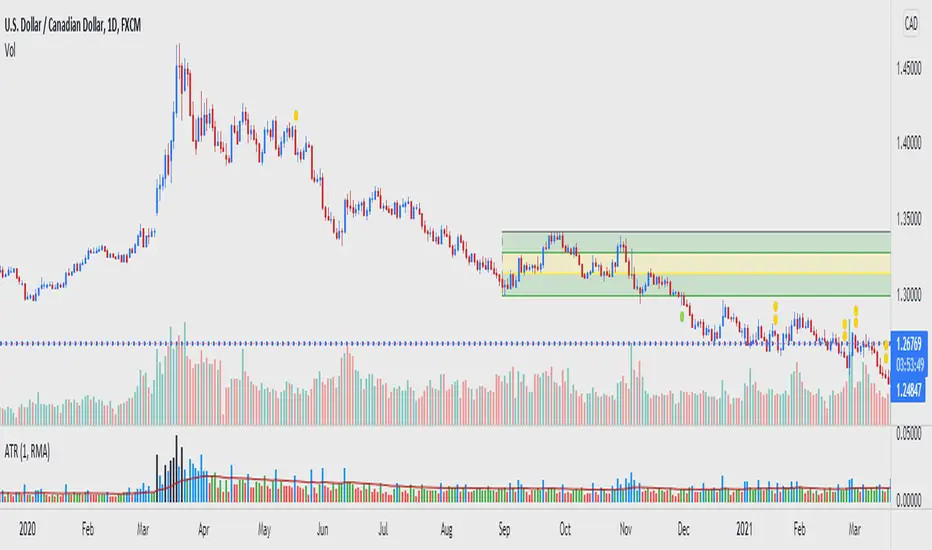
ATR BandsIn many strategies, it's quite common to use a scaled ATR to help define a stop-loss, and it's not uncommon to use it for take-profit targets as well. While it's possible to use the built-in ATR indicator and manually calculate the offset value, we felt this wasn't particularly intuitive or efficient, and could lead to the potential for miscalculations. And while there are quite a few indicators that plot ATR bands in some form or another already on TV, we could not find one that actually performed the exact way that we wanted. They all had at least one of the following gaps:
The ATR offset was not configurable (usually hard-coded to be based off the high or low, while we generally prefer to use close)
It would only print a single band (either the upper or lower), which would require the same indicator to be added twice
The ATR scaling factor was either not configurable or only stepped in whole numbers (often time fractional factors like 1.5 yield better results)
To that end, we took to making this enhanced version to meet all of the above requirements. While we were doing so, we decided to take this opportunity to also make some non-functional enhancements as well:
Updated the indicator to the most recent version of Pine
Updated the indicator definition to allow alternate (non-chart) timeframe usage
Made the input types explicitly defined to improve consistency
Updated the inputs with appropriate minimum values and step sizes where appropriate
Separated settings into logical groups
Added helptext to the indicator settings noting usage and common settings values
Explicitly titled the on-chart plots of the ATR bands so that they can more easily be identified and referenced in other indicators/scripts, as well as the Data Window
Food for thought : When looking at some of the behaviors of these ATR bands, you can see that when price first levels out, you can draw a "consolidation zone" from the first peak of the upper ATR band to the first valley of the lower ATR band that price will generally respect. Look for price to break and close outside of that zone. When that happens, price will usually (but not always) make a notable move in that direction, which can be used as either a potential trigger or as an additional confluence with other indicators/price action.
Finally, while we have made what we feel are some noteworthy updates and enhancements to this indicator, and have every intention of continuing to do so as we find worthy opportunities for enhancement, credit is still due to the original author: AlexanderTeaH

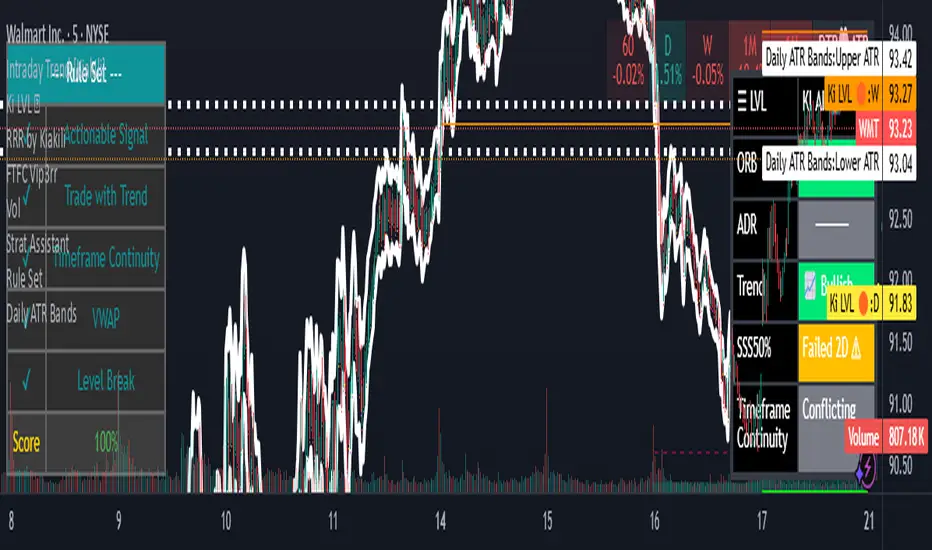
Daily ATR BandsATR Finder – Volatility Scanner for Smarter Trade Setups
The ATR Finder is a precision tool designed to help traders quickly identify high-volatility assets using the Average True Range (ATR) – a key metric in assessing market momentum and potential breakout zones. By automatically scanning and highlighting tickers or candles with elevated ATR values relative to their recent historical range, this indicator helps you filter for setups that are more likely to experience significant price moves.
Whether you're a day trader seeking intraday momentum or a swing trader looking for setups with strong follow-through potential, the ATR Finder cuts through the noise and visually signals which assets are "on the move." It can be paired with other indicators or price action tools to create a high-conviction trading strategy focused on volatility expansion.
Key Features:
Dynamic ATR Calculation over a user-defined period
Visual Alerts or Color-Coding for above-threshold volatility spikes
Supports Multiple Timeframes for both short- and long-term volatility analysis
Great for spotting breakout opportunities, gap continuations, or trend reversals
Use the ATR Finder to stay ahead of price action and build a watchlist that moves with purpose. Perfect for scalpers, breakout traders, and anyone who respects the power of volatility.
ATR TREXTry to visualize TREX method.
-4 types of candle based on TR :
1. Spinning ( Candle < 0.8*ATR )
2. Standard ( 0.8*ATR < Candle < 1.2*ATR )
3. Long bar ( 1.2*ATR < Candle < 2.5*ATR )
4. Spike ( 2.5*ATR < Candle )
ATR length is different base on FRACTAL timeframes.
you can now find what is type of candle as colored ATR.
-Time frames :
1 Min
5 Min
15 Min
1 Hour
4 Hour
1 Day
1 Week
1 Month
I am working on TREX method and this indicator will change and improve . (V1.0)
Br
Amin
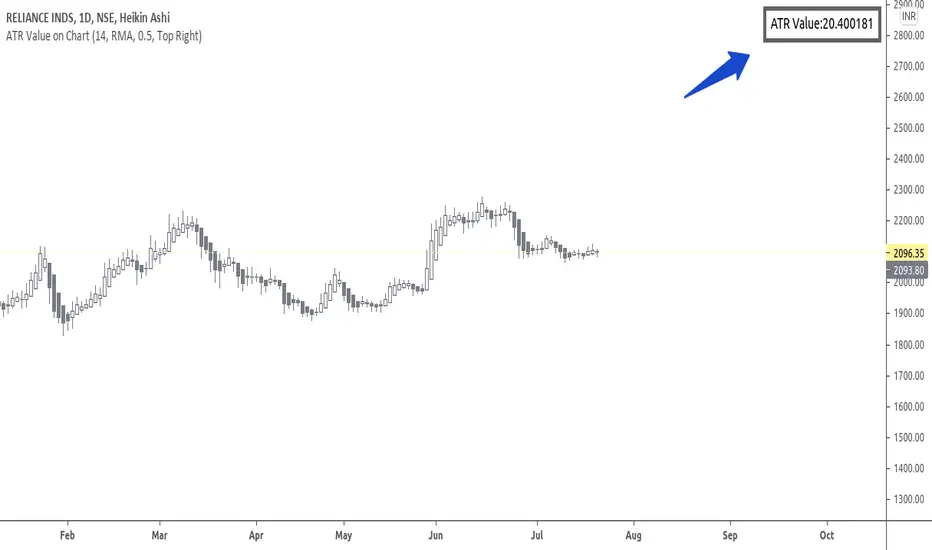
ATR Value on ChartHi Friends & TradingView community.
Greetings to you.
Many traders use ATR to set Stop loss.
The built in ATR indicator plots the ATR values as a line. However, many traders do not want the ATR to be plotted on their charts, but are only interested in the ATR value as such.
This script does that - it just prints the latest ATR with your set Multiplier value on the chart. I have used the built-in ATR indicator and made necessary additions to the code.
I hope this script proves useful to traders.
Queries / feedback welcome.
All the best.
ATR 1Day Upper Lower BoundsThis script is useful as a guide to get into positions.
The 1day ATR has upper and lower bounds, however its typically used to determine if a trend is long or short. And the trend reverses when the price action close crosses the directional trend limit.
This script is different in that it always shows both the upper and lower ATR ranges.
Also, its default time resolution is the 1day and this has been selected for BTC, as the chart shows when this indicator can be useful.
The indicator overlays anytime frame equal to or lower than 1 day.
The 1 Day ATR upper and lower limits are a good guide.
If the price action crosses the 1 Day ATR, there is a reasonable chance the price is likely to correct to be within the 1Day ATR bounds.
So, if the price goes above the top ATR line, consider getting into a short position.
Similarly, if the price goes below the lower ATR line, consider getting into a long position.
If you look at the attached chart, there are several times when this is a very good trading signal for BTC.

ATR For Stop Loss (Overlay)This script is an enhancement of ATR Indicator.
It is used to determine the stop loss position by using the ATR indicator, in conjunction with the low of the candle.
Formula = Stop Loss = Lowest(Lowest Length) - (ATR Multiplier * ATR (Smoothing, Length))
However, the user needs to manually identify the swing low for a better stop loss placement.
Parameter Information :
- Length : Period to calculate the average true range.
- Smoothing : The method used for averaging.
- ATR Multiplier : Multiplier factor to determine the Stop Loss from the lowest reference point. (1 ATR Multiplier means the stop loss would be = Low - ATR)
- Lowest Length : A total number of candle to determine the lowest reference point. (1 means only using the latest candle's low as a lowest reference point)
Have fun and good luck!
ATR TRex [SHK]To appreciate dear Mr.Khakestar efforts i have converted his mt4 ATR formula to pine script. All credits goes to him.
Plots
You can enable plots from the settings tab and then disable five first plots from the style tabs (finally save as default). Then you can view the ATR result of each candle in the past:
Green number is the HL range of the candle.
Red number is the ATR of the candle.
First black number is the ATR of the 4H chart.
Second black number is the ATR of the 1D chart.
Third black number is the ATR of the 1W chart.
What makes this ATR formula so different?
This formula invented by Mr.Khakestar and it shows the power of the price to move in each cycle of the chart. We can use it in RTM strategy and Price Action trading. To learn how to use it you need to learn TRex strategy (Presented by Mr.Khakestart for free in Persian).

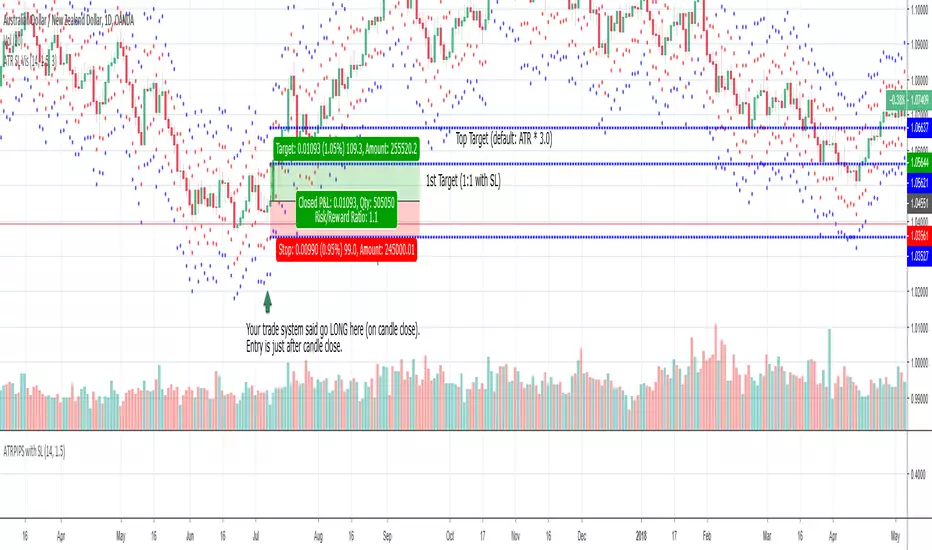
ATR SL Visualization (on chart)This indicator plots 2 sets of dots (and lines) based on your chosen ATR multiplier (Average True Range).
Generally, when trading on the daily timeframe a good rule of thumb is to use the ATR * 1.5 (the default setting of this indicator).
I created this indicator to quickly test other indicators but I also find it helpful in live trading.
How to use this indicator:
Your trade system provides an entry signal. The red dot (can be connected line in options) would be used as the stop loss for either a long or short.
Then the dot on the other side would be your first 1:1 target.
The blue line is the same ATR multiplier as a target (default but can be modified).
Using an additional tool like the horizontal ray can be helpful to see the exact location the SL might be hit or where the target might hit.
When drawing your ray ensure you’re using the right entry candle.
For instance, in a long scenario you would typically be entering a trade after your signal candle closes. So draw the ray at the point in price on the next candle for both stop loss and target.
Also use these dots (lines) as guides provides an easy way to plot SL and targets if you want to use the Long or Short tool.
For my trade systems I don’t use price targets (I exit when structure or indicators reveal to exit) but I do find it helpful to graph when testing. When something moves in my favor either the ATR or the ATR * 1.5 I take profit and typically move up my stop loss to break even or trailing.
The other strategy that could be possible but have not tested is as long as the SL is making a new high moving up a hard stop to the ATR SL each day the trade goes in your favor.
This should be obvious but if you want to use just the true ATR edit the multiplier to be 1.0