Q-TrendQ-Trend is an multipurpose indicatorm that can be used for swing- and trend-trading equally on any timeframe (non-volatile markets are better for this thing).
Settings:
Trend period - used to calculate trend line in the special moments(will explain below);
ATR Multiplier - changes sensitivity. The higher the multiplier = the more sensitive it is.
Also option to smooth source data (helps get cleaner signals, as always).
How to use?
Signals are given on the chart. Also ou can use trend line as S/R line.
The idea behind:
Terms:
SRС = Source
TL = trend line;
MP = ATR multiplier;
ATR = ATR :)
TL = (highest of source P-bars back + lowest of source P-bars back) / 2
Epsilon = MP * ATR
I was thinking for a week about combining volatility and relation between highest and lowest price point. That why I called indicator Q-Trend = Quantitative Trend , as I was trying to think about price in a mathematical way.
Okay, time to go philosophical:
1) TL is shows good price trend, but as it is slow enough and not enough informative, we need add additional conditions to produce signals.
2) Okay, so what can we add as conditions? We need to take volatility into account, as it is crucial in the moments of market uncertainty. So let's use ATR (Average True Range) somehow. My idea is that if SRC breaks TL + ATR , then it means that there will be upmove and we update our TL . Analogically for SRC breaking TL - ATR (breaks are crosses of TL +- ATR lines) .
Conclusion:
- if SRC breaks TL + ATR , it is a BUY signal and update of trend line;
- if SRC breaks TL - ATR , it is a SELL signal and update of trend line;
I think that such indicator already exisits on TradingView, as I've already saw something similar, but long ago, so please don't report, if such thing already exists.
But if not, then I hope, that you will gain some profits with Q-Trend :)
I will continue my work on this thing, so stay tuned.
Trade with your own risks and have your profits!
Wish you all the best!
- Tarasenko Fyodor
Cari dalam skrip untuk "ATR"

Pro Minimalist ATR (Black)The script I provided is a tool that automatically calculates and displays volatility "zones" around the average price. Here is the plain English explanation of what it is doing and why:
1. The Anchor: 20 DMA (The "Fair Value")
The script starts by calculating the 20-Day Moving Average (20 DMA).
What it represents: Think of this as the "fair price" or the "center of gravity" for the market over the last month.
In the script: It looks at the closing price of the last 20 candles, adds them up, and divides by 20. This is your baseline.
2. The Ruler: ATR (The "Volatility")
Next, it measures the Average True Range (ATR) over the last 14 days.
What it represents: This measures the "energy" or "noise" of the market. If candles are huge, the ATR is high. If candles are tiny, the ATR is low.
Why we use it: Using a fixed number (like $50) doesn't work because stocks move differently. ATR adapts to the current market mood.
3. The Zones: +1, +2, -1, -2
The script then takes that "center" (20 DMA) and adds/subtracts the "ruler" (ATR) to create four distinct levels:
+1 ATR: This is the "Upper Normal" limit. Price hanging here is bullish but normal.
+2 ATR: This is the "Extreme" limit. Statistically, price rarely stays above this line for long without snapping back. This is often an overbought signal.
-1 ATR: This is the "Lower Normal" limit.
-2 ATR: This is the "Extreme" discount. If price hits this, it is statistically stretched far below its average.
4. The Visuals: "Clean" Labeling
Finally, the script focuses on presentation:
No Lines: It specifically avoids drawing lines all over your history to keep your chart clean.
Dynamic Labels: It creates text labels only on the very last bar (the current moment). It constantly deletes the old label and draws a new one as the price moves, so it looks like the text is "floating" next to the current price.
Axis Marking: It forces marks onto the right-hand price scale (display=display.price_scale) so you can see the exact price levels (e.g., 154.20) without having to guess.

Trinity ATR Real Move DetectorTrinity ATR Real Move Detector
This ATR Energy Table indicator is one of the simplest yet most powerful filters you can have on a chart when trading short-dated or 0DTE options or swing trades on any timeframe from 1-minute up to 4-hour. Its entire job is to answer the single most important question in intraday and swing trading: “Does the underlying actually have enough short-term explosive energy right now to make a directional position worth the theta and the spread, or is this just pretty candles that will die in ten minutes?”
Most losing 0DTE and short-dated option trades happen because people buy or sell direction on a “nice-looking” breakout or pullback while the underlying is actually in low-energy grind mode. The premium decays faster than the move develops, and you lose even when you’re “right” on direction. This little table stops that from ever happening again.
Here’s what it does in plain English:
Every bar it measures two things:
- The current ATR on whatever timeframe you are using (1 min, 3 min, 5 min, 10 min, etc.). This tells you how big the average true range of the last 14 bars has been — in other words, how violently the stock or index is actually moving right now.
- The daily ATR (14-period on the daily chart). This is your benchmark for “normal” daily movement over the last two–three weeks.
It then multiplies the daily ATR by a small number (the multiplier you set) and compares the two. If the short-term ATR is bigger than that percentage of the daily ATR, the table turns bright green and says “ENOUGH ENERGY”. If not, it stays red and says “NOT ENOUGH”.
Why this works so well:
- Real explosive moves that carry for 0DTE and 1–3 DTE options almost always show a short-term ATR spike well above the recent daily average. Quiet grind moves never do.
- The comparison is completely adaptive — on a high-vol day the threshold automatically rises, on a low-vol day it automatically drops. You never have to guess if “2 points on SPY is big today”.
- It removes emotion completely. You simply wait for green before you even think about clicking buy or sell on an option.
Key settings and what to do with them:
- Energy Multiplier — this is the only number you ever touch. It is expressed as a decimal (0.15 = 15 % of the daily ATR). Lower = more signals, higher = stricter and higher win rate. The tooltip gives you the exact sweet-spot numbers for every popular timeframe (0.09 for 1-minute scalping, 0.13 for 3-minute, 0.14–0.16 for 5-minute, 0.15–0.19 for 10-minute, etc.). Just pick your timeframe once and type the number — done forever.
- ATR Length — leave it at 14. That’s the standard and works perfectly.
- Table Position — move the table to wherever you want on the chart (top-right, bottom-right, bottom-left, top-left).
- Table Size — make the text Tiny, Small, Normal or Large depending on how much screen space you have.
How this helps you make money and stop losing it:
- On most days you will see red 80–90 % of the time — that’s good! It is forcing you to sit on your hands instead of overtrading low-energy chop that eats premium.
- When it finally flips green you know institutions are actually pushing size right now — follow-through probability jumps from ~40 % to 65–75 % depending on the stock and timeframe.
- You stop buying calls on every green candle and puts on every red candle. You only strike when the market is genuinely “awake”.
- Over a week you take dramatically fewer trades, but your win rate and average winner size go way up — which is exactly how consistent intraday option profits are made.
In short, this tiny table is the closest thing to an “edge on/off switch” that exists for short-dated options. Red = preserve capital and go do something else. Green = pull the trigger with confidence. Use it religiously and you’ll immediately feel the difference in your P&L.

Triple ATR Adaptive MAs + VWAP Option + Clouds + Candle Trend V2Another one of my experiences ... combining things...
📘 Indicator Description – Triple ATR Adaptive Moving Averages with VWAP Influence
This indicator plots three adaptive moving averages whose behavior changes dynamically based on market volatility (ATR) and optionally VWAP deviation.
Because they adapt in real time to both volatility and VWAP pressure, their movement, slope, and reaction speed differ significantly from traditional moving averages.
🔶 1. ATR-Adaptive Moving Averages
Each of the three MAs uses a custom adaptive formula:
ATR (Average True Range) is measured over a chosen period.
Higher ATR → more volatility → the MA becomes more reactive and moves closer to price.
Lower ATR → stable market → the MA becomes smoother and slower.
This creates a volatility-aware smoothing factor, making the MA expand, contract, and respond to market conditions in ways a classic SMA, EMA, or HMA cannot.
🔷 2. Optional VWAP Influence
Each MA has an independent toggle allowing it to be influenced by VWAP.
When enabled:
The MA is gently “pulled” toward VWAP.
The strength of this attraction is determined by the VWAP Influence parameter (0–1).
This causes the moving averages to behave differently from normal MAs:
In trending markets, the ATR and price push the MA away from VWAP.
In mean-reverting or balanced conditions, VWAP pulls the MA back toward fair value.
The result is an MA that reflects both trend pressure and fair-value pressure.
🔶 3. Visual Behavior: Non-Traditional Movement
Because each MA is simultaneously influenced by volatility, trend magnitude, and VWAP deviation, their shape is often very distinct from normal moving averages.
They may:
Respond faster during high volatility
Flatten out earlier during consolidation
Curve toward VWAP when price becomes extended
Separate or compress depending on ATR strength
This is intentional and essential, since the goal is to show:
✔ Volatility expansion
✔ Trend exhaustion
✔ Overextended price relative to VWAP
✔ Dynamic trend confirmation
Rather than simply smoothing past price.
🔷 4. Three Independent Adaptive Lines
Each of the three moving averages has:
Its own ATR length
Its own sensitivity multiplier
Its own optional VWAP influence
Its own color and trail
This allows the user to combine:
a fast volatility-adaptive trend line
a mid-range adaptive baseline
a slow adaptive long-trend MA
All adapting independently to volatility and VWAP conditions.
🔶 5. Optional Candle Coloring
The indicator can color candles according to trend strength derived from the fast/slow MAs.
Stronger trends produce more vivid colors. Neutral or conflicting trends produce softer colors.
This adds a visual layer to identify:
Trend direction
Trend strength
Volatility state
Market compression
at a glance.
📌 Summary
This indicator does not behave like standard SMAs or EMAs because each line dynamically adapts to:
🔸 ATR (volatility)
🔸 VWAP (fair value)
This makes the indicator extremely responsive to market conditions while still reducing noise during stable phases.
It provides a more realistic, context-aware, and intelligent representation of price behavior compared to traditional moving averages.

Adaptive ATR% Grid + SuperTrend + OrderFlipDescription:
This indicator combines multiple technical analysis tools to identify key price levels and trading signals:
ATR% Grid – automatic plotting of support and resistance levels based on current price and volatility (ATR). Useful for identifying potential targets and entry/exit zones.
SuperTrend – a classic trend indicator with an adaptive ATR multiplier that adjusts based on average volatility.
OrderFlip – identifies price reversal points relative to a moving average with ATR-based sensitivity, optionally filtered by OBV and DMI.
MTF Confirmation – multi-timeframe trend verification using EMA to reduce false signals.
Signal Labels – "LONG" and "SHORT" labels appear on the chart with an offset from the price for better visibility.
JSON Alerts – ready-to-use format for automated alerts, including price, SuperTrend direction, Fair Zone, and ATR%.
Features:
Fully compatible with Pine Script v6
Lines and signals are fixed on the chart, do not shift with new bars
Configurable grid, ATR, SuperTrend, and filter parameters
Works with MTF analysis and classic indicators (OBV/DMI)
Usage:
Best used with additional indicators and risk management strategies. ATR% Grid is ideal for both positional trading and intraday setups.
перевод на русский
Описание:
Этот индикатор объединяет несколько методов технического анализа для выявления ключевых уровней цены и сигналов на покупку/продажу:
Сетка ATR% (ATR% Grid) – автоматическое построение уровней поддержки и сопротивления на основе текущей цены и волатильности (ATR). Позволяет видеть потенциальные цели и зоны входа/выхода.
SuperTrend – классический трендовый индикатор с адаптивным множителем ATR, который корректируется на основе средней волатильности.
OrderFlip – определение моментов разворота цены относительно скользящей средней с учетом ATR, с возможностью фильтрации по OBV и DMI.
MTF-подтверждение – проверка направления тренда на нескольких таймфреймах с помощью EMA, чтобы снизить ложные сигналы.
Сигнальные метки – на графике появляются "LONG" и "SHORT" с отступом от цены для наглядности.
JSON Alerts – готовый формат для автоматических уведомлений, включающий цену, направление SuperTrend, Fair Zone и ATR%.
Особенности:
Поддержка Pine Script v6
Линии и сигналы закреплены на графике, не двигаются при обновлении свечей
Настраиваемые параметры сетки, ATR, SuperTrend и фильтров
Совместимость с MTF-анализом и классическими индикаторами OBV/DMI
Рекомендации:
Используйте в сочетании с другими индикаторами и стратегиями управления риском. Сетка ATR% отлично подходит для позиционной торговли и интрадей.
ATR% Grid – automatic plotting of support and resistance levels based on current price and volatility (ATR). Useful for identifying potential targets and entry/exit zones.
SuperTrend – a classic trend indicator with an adaptive ATR multiplier that adjusts based on average volatility.

Multitime ATRMulti-Timeframe Supertrend (Multitime ATR) Indicator Description
This indicator, written in Pine Script v5, is a Multi-Timeframe (MTF) Supertrend tool. It provides a multi-faceted market analysis by simultaneously displaying the Supertrend lines from the current chart timeframe and three higher timeframes: the 1-Hour (1H), 4-Hour (4H), and 1-Day (1D).
📌 Key Features and Characteristics
Multi-Timeframe Display:
It overlays the Supertrend lines from the current timeframe, 1H, 4H, and 1D onto a single chart, totaling four timeframes.
By visualizing the higher timeframe trend lines (uptrends as support, downtrends as resistance), traders can determine where the price action on the current chart stands within the context of the larger, dominant trends.
Supertrend Logic:
The Supertrend calculation utilizes the Average True Range (ATR), based on a user-specified ATR Period and ATR Multiplier.
The Change ATR Calculation Method? input allows switching the ATR calculation between the standard ta.atr (EMA-based/smoothed) and ta.sma(ta.tr, Periods) (SMA-based) methods.
Visual Aids:
Trend Lines: Uptrend lines (support) and downtrend lines (resistance) for each timeframe are plotted with different colors and line weights (e.g., Main: Green/Red, 1H: Blue tones, 4H: Purple tones, 1D: Green/Dark Red tones).
Highlighter: A background coloring feature visually highlights the area between the price and the Supertrend lines according to the trend direction for each timeframe, making the trend immediately obvious. This can be controlled collectively by the Master Highlighter setting.
Trend Change Marks: Small circle plots (●) indicate the exact points of trend reversal for each higher timeframe, clearly signaling a shift.
Warning and Break Signals:
The indicator plots signal labels on the chart when the current price breaks (or nearly breaks) a higher timeframe trend line.
Warning (⚠️): Plotted when the price closes below an uptrend line.
Break (⚡): Plotted when the price closes above a downtrend line.
These signals are designed to reset after a certain period (coded as 3,600,000 milliseconds = 1 hour) to prevent continuous noise from repetitive breaks.
Alert Functionality:
In addition to the current timeframe's Buy/Sell signals, the indicator features robust alerts for the Warning/Break signals across the 1H, 4H, and 1D timeframes, ensuring that critical trend changes are not missed.
🛠️ Customization Options
The indicator's settings allow for detailed customization of the following parameters for each timeframe (Main, 1H, 4H, 1D) individually:
ATR Period (ATR Period)
ATR Multiplier (ATR Multiplier)
Visibility toggles for trend lines, signals, and highlighters.
Furthermore, the Master Control section enables simultaneous control over the display of the Highlighter, Signals, Up Trend Lines, and Down Trend Lines across all timeframes.
This indicator serves as a powerful tool for finding more reliable entry and exit points by integrating multi-timeframe trend analysis, which helps reduce false signals often encountered in single-timeframe trading.
Would you like me to elaborate on a specific section of the code, such as the request.security function or the signal logic?

DEMA Flow [Alpha Extract]A sophisticated trend identification system that combines Double Exponential Moving Average methodology with advanced HL median filtering and ATR-based band detection for precise trend confirmation. Utilizing dual-layer smoothing architecture and volatility-adjusted breakout zones, this indicator delivers institutional-grade flow analysis with minimal lag while maintaining exceptional noise reduction. The system's intelligent band structure with asymmetric ATR multipliers provides clear trend state classification through price position analysis relative to dynamic threshold levels.
🔶 Advanced DEMA Calculation Engine
Implements double exponential moving average methodology using cascaded EMA calculations to significantly reduce lag compared to traditional moving averages. The system applies dual smoothing through sequential EMA processing, creating a responsive yet stable trend baseline that maintains sensitivity to genuine market structure changes while filtering short-term noise.
// Core DEMA Framework
dema(src, length) =>
EMA1 = ta.ema(src, length)
EMA2 = ta.ema(EMA1, length)
DEMA_Value = 2 * EMA1 - EMA2
DEMA_Value
// Primary Calculation
DEMA = dema(close, DEMA_Length)
2H
🔶 HL Median Filter Smoothing Architecture
Features sophisticated high-low median filtering using rolling window analysis to create ultra-smooth trend baselines with outlier resistance. The system constructs dynamic arrays of recent DEMA values, sorts them for median extraction, and handles both odd and even window lengths for optimal smoothing consistency across all market conditions.
// HL Median Filter Logic
hlMedian(src, length) =>
window = array.new_float()
for i = 0 to length - 1
array.push(window, src)
array.sort(window)
// Median Extraction
lenW = array.size(window)
median = lenW % 2 == 1 ?
array.get(window, lenW / 2) :
(array.get(window, lenW/2 - 1) + array.get(window, lenW/2)) / 2
// Smooth DEMA Calculation
Smooth_DEMA = hlMedian(DEMA_Value, HL_Filter_Length)
🔶 ATR Band Construction Framework
Implements volatility-adaptive band structure using Average True Range calculations with asymmetric multiplier configuration for optimal trend identification. The system creates upper and lower threshold bands around the smoothed DEMA baseline with configurable ATR multipliers, enabling precise trend state determination through price breakout analysis.
// ATR Band Calculation
atrBands(src, atr_length, upper_mult, lower_mult) =>
ATR = ta.atr(atr_length)
Upper_Band = src + upper_mult * ATR
Lower_Band = src - lower_mult * ATR
// Band Generation
= atrBands(Smooth_DEMA, ATR_Length, Upper_ATR_Mult, Lower_ATR_Mult)
15min
🔶 Intelligent Flow Signal Engine
Generates binary trend states through band breakout detection, transitioning to bullish flow when price exceeds upper band and bearish flow when price breaches lower band. The system maintains flow state persistence until opposing band breakout occurs, providing clear trend classification without whipsaw signals during normal volatility fluctuations.
🔶 Comprehensive Visual Architecture
Provides multi-dimensional flow visualization through color-coded DEMA line, trend-synchronized candle coloring, and bar color overlay for complete chart integration. The system uses institutional color scheme with neon green for bullish flow, neon red for bearish flow, and neutral gray for undefined states with configurable band visibility.
🔶 Asymmetric Band Configuration
Features intelligent asymmetric ATR multiplier system with default upper multiplier of 2.1 and lower multiplier of 1.5, optimizing for market dynamics where upside breakouts often require stronger momentum confirmation than downside breaks. This configuration reduces false signals while maintaining sensitivity to genuine flow changes.
🔶 Dual-Layer Smoothing Methodology
Combines DEMA's inherent lag reduction with HL median filtering to create exceptional smoothing without sacrificing responsiveness. The system first applies double exponential smoothing for initial noise reduction, then applies median filtering to eliminate outliers and create ultra-clean flow baseline suitable for high-frequency and institutional trading applications.
🔶 Alert Integration System
Features comprehensive alert framework for flow state transitions with customizable notifications for bullish and bearish flow confirmations. The system provides real-time alerts on crossover events with clear directional indicators and exchange/ticker integration for multi-symbol monitoring capabilities.
🔶 Performance Optimization Framework
Utilizes efficient array management with optimized median calculation algorithms and minimal variable overhead for smooth operation across all timeframes. The system includes intelligent bar indexing for median filter initialization and streamlined flow state tracking for consistent performance during extended analysis periods.
🔶 Why Choose DEMA Flow ?
This indicator delivers sophisticated flow identification through dual-layer smoothing architecture and volatility-adaptive band methodology. By combining DEMA's reduced-lag characteristics with HL median filtering and ATR-based breakout zones, it provides institutional-grade flow analysis with exceptional noise reduction and minimal false signals. The system's asymmetric band structure and comprehensive visual integration make it essential for traders seeking systematic trend-following approaches across cryptocurrency, forex, and equity markets with clear entry/exit signals and comprehensive alert capabilities for automated trading strategies.

Adaptive CE-VWAP Breakout Framework [KedArc Quant]Description
A structured framework that unites three complementary systems into one charting engine:
Chandelier Exit (CE) – ATR-based trailing logic that defines trend direction, stop placement, and risk/reward overlays.
Swing-Anchored VWAP (SWAV) – a dynamically anchored VWAP that re-starts from each confirmed swing and adapts its smoothness to volatility.
Pivot S/R with Volume Breaks – confirmed horizontal levels with alerts when broken on expanding volume.
This script builds a single workflow for bias → trigger → managementwithout mixing unrelated indicators. Each module is internally linked rather than layered cosmetically, making it a true analytical framework—not.
Acknowledgment
Special thanks to Dynamic Swing Anchored VWAP by Zeiierman, whose swing-anchoring concept inspired a part of the SWAV module’s implementation and adaptation logic.
Support and Resistance Levels with Breaks by LuxAlgo for S/R breakout logic.
How this helps traders
Trend clarity – CE color-codes direction and provides evolving stops.
Context value – SWAV traces adaptive mean paths so traders see where price is heavy or light.
Action filter – Pivot+volume logic highlights true structural breaks, filtering false moves.
Discipline tool – Optional R:R boxes visualize risk and target zones to enforce planning.
Entry / Exit guidelines (for study purposes only)
Bias Use CE direction: green = long bias red = short bias
Entry
1. Breakout method– Trade in CE direction when a pivot level breaks on valid volume.
2. VWAP confirmation– Prefer breaks occurring around the nearest SWAV path (fair-value cross or re-test).
Exit
Stop = CE line / recent swing HL / ATR × (multiplier)
Target = R-multiple × risk (default 2 R)
Optional live update keeps SL/TP aligned with current CE state.
Core formula concepts
ATR Stop: Stop = High/Low – ATR × multiplier
VWAP calc: Σ(price × vol) / Σ(vol) anchored at swing pivot, adapted by APT (Adaptive Price Tracking) ratio ∝ ATR volatility.
Volume oscillator: 100 × (EMA₅ – EMA₁₀)/EMA₁₀; valid break when threshold %.
Input configuration (high-level)
Master Controls
Show CE / SWAV modules Theme & Fill opacity
CE Section
ATR period & multiplier Use Close for extremums
Show buy/sell labels Await bar confirmation
Risk-Reward overlay: R-multiple, Stop basis (CE/Swing/ATR×), Live update toggle
SWAV Section
Swing period Adaptive Price Tracking length Volatility bias (ATR-based adaptation) Line width
Pivot & Volume Breaks
Left/Right bar windows Volume threshold % Show Break labels and alerts
Best timeframes
Intraday: 5 m – 30 m for breakout confirmation
Swing: 1 h – 4 h for trend context
Settings scale with instrument volatility—adjust ATR period and volume threshold to match liquidity.
Glossary
ATR: Average True Range (volatility metric)
CE: Chandelier Exit (trailing stop/trend filter)
SWAV: Swing-Anchored VWAP (anchored mean price path)
Pivot H/L: Confirmed local extrema using left/right bar windows
R-multiple: Profit target as a multiple of initial risk
FAQ
Q: Does it repaint? A: No—pivots wait for confirmation and VWAP updates forward-only.
Q: Can modules be disabled? A: Yes—each section has its own toggle.
Q: Can it trade automatically? A: This is an indicator/study, not an auto-strategy.
Q: Is this financial advice? A: No—educational use only.
Disclaimer
This script is for educational and analytical purposes only.
It is not financial advice. Trading involves risk of loss. Past performance does not guarantee future results. Always apply sound risk management.

Volume Weighted Average True RangeThis indicator calculates a customizable version of the Average True Range (ATR), a tool for measuring market volatility. It enhances the standard ATR with volume weighting, a dual-smoothing process, normalization, and volatility pivot detection.
Key Features:
Volume Weighting: An option (Volume weighted) allows for volume to be incorporated into the volatility calculation. This provides a measure of "volume-adjusted" volatility that is more responsive to significant market activity.
Dual Smoothing Process: For noise reduction, the indicator employs a two-stage smoothing process. It first calculates a smoothed True Range (TR) over a user-defined period (TR Length) before applying the final ATR moving average (ATR Length & ATR Smooth).
Normalization (Percentage Volatility): An optional 'Normalize' mode calculates the ATR as a percentage of the price. This allows for consistent volatility comparison across different assets and over long time periods.
Volatility Pivot Detection: The indicator includes a built-in pivot detector that identifies significant turning points (highs and lows) in the ATR line itself, signaling potential shifts in volatility.
Note on Confirmation (Lag): Pivot signals are confirmed using a lookback method. A pivot is only plotted after the Pivot Right Bars input has passed. This is essential for ensuring the signal is non-repainting but introduces an inherent lag.
Multi-Timeframe (MTF) Capability:
MTF ATR Line: The ATR line itself can be calculated on a different timeframe, with standard options to handle gaps (Fill Gaps) and prevent repainting (Wait for...).
Limitation: The Pivot detection (Calculate Pivots) is disabled if a Higher Timeframe (HTF) is selected.
Integrated Alerts: Includes alerts that trigger when a new volatility pivot (high or low) is detected in the ATR line.
DISCLAIMER
For Informational/Educational Use Only: This indicator is provided for informational and educational purposes only. It does not constitute financial, investment, or trading advice, nor is it a recommendation to buy or sell any asset.
Use at Your Own Risk: All trading decisions you make based on the information or signals generated by this indicator are made solely at your own risk.
No Guarantee of Performance: Past performance is not an indicator of future results. The author makes no guarantee regarding the accuracy of the signals or future profitability.
No Liability: The author shall not be held liable for any financial losses or damages incurred directly or indirectly from the use of this indicator.
Signals Are Not Recommendations: The alerts and visual signals (e.g., crossovers) generated by this tool are not direct recommendations to buy or sell. They are technical observations for your own analysis and consideration.

Уровни SL/TP и значение ATR первого часаSession Range SL/TP Levels with Advanced ATR
Overview
The Session Range SL/TP Levels indicator is a comprehensive tool designed for session-based trading strategies, particularly for breakouts. It identifies the high and low of a user-defined time range (e.g., the Asian session) and uses a sophisticated, customizable Average True Range (ATR) calculation to project key Stop Loss (SL) and Take Profit (TP) levels.
This indicator helps traders visualize potential entry and exit points based on the volatility of a specific trading session, with all crucial data presented in a clean on-screen table.
Key Features
Customizable Trading Session: Define any time range to establish your core trading zone. The indicator will automatically find the high and low of this period.
Advanced ATR Calculation: The indicator uses an ATR calculated on a 5-minute timeframe for higher precision. You can customize:
The ATR length and smoothing method (RMA, SMA, EMA, WMA).
A unique percentage reduction from the ATR to create a more conservative volatility buffer.
Volatility-Based SL/TP Levels: Automatically calculates and plots multiple SL and TP levels for both long and short scenarios based on user-defined multipliers of the modified ATR.
Comprehensive On-Screen Display: A detailed on-screen table provides all critical data at a glance, including:
The original 5-min ATR value.
The modified ATR after the percentage reduction.
Three custom ATR-multiple values for quick reference.
All calculated SL and TP price levels for both Long and Short setups.
Copy-Friendly Data Logging: With a single click in the settings, you can print all calculated values into the Pine Logs panel, allowing for easy copying and pasting into other applications or trading journals.
How to Use
Define Your Session: In the settings, enter the time for the trading session you want to analyze (e.g., "0200-0300" for a part of the Asian session).
Identify the Range: The indicator will draw the high and low of this session once the time period is complete.
Plan Your Trade: The calculated levels provide potential targets for breakout trades.
For a Long Trade: If the price breaks above the session high, the green Take Profit lines (TP1, TP2, TP3) serve as potential exit points, while the Stop Loss (Long) level serves as a volatility-based stop.
For a Short Trade: If the price breaks below the session low, the red Take Profit lines serve as potential targets, with the Stop Loss (Short) level as the corresponding stop.
Reference the Table: Use the on-screen table to see the exact price levels and ATR values without needing to hover over the lines.
Trend Strength Index [Alpha Extract]The Trend Strength Index leverages Volume Weighted Moving Average (VWMA) and Average True Range (ATR) to quantify trend intensity in cryptocurrency markets, particularly Bitcoin. The combination of VWMA and ATR is particularly powerful because VWMA provides a more accurate representation of the market's true average price by weighting periods of higher trading volume more heavily—capturing genuine momentum driven by increased participation rather than treating all price action equally, which is crucial in volatile assets like Bitcoin where volume spikes often signal institutional interest or market shifts.
Meanwhile, ATR normalizes this measurement for volatility, ensuring that trend strength readings remain comparable across different market conditions; without ATR's adjustment, raw price deviations from the mean could appear artificially inflated during high-volatility periods (like during news events or liquidations) or understated in low-volatility sideways markets, leading to misleading signals. Together, they create a volatility-adjusted, volume-sensitive metric that reliably distinguishes between meaningful trend developments and noise.
This indicator measures the normalized distance between price and its volume-weighted mean, providing a clear visualization of trend strength while accounting for market volatility. It helps traders identify periods of strong directional movement versus consolidation, with color-coded gradients for intuitive interpretation.
🔶 CALCULATION
The indicator processes price data through these analytical stages:
Volume Weighted Moving Average: Computes a smoothed average weighted by trading volume
Volatility Normalization: Uses ATR to account for market volatility
Distance Measurement: Calculates absolute deviation between current price and VWMA
Strength Normalization: Divides price deviation by ATR for a volatility-adjusted metric
Formula:
VWMA = Volume-Weighted Moving Average of Close over specified length
ATR = Average True Range over specified length
Price Distance = |Close - VWMA|
Trend Strength = Price Distance / ATR
🔶 DETAILS Visual Features:
VWMA Line: Blue line overlay on the price chart representing the volume-weighted mean
Trend Strength Area: Histogram-style area plot with dynamic color gradient (red for weak trends, transitioning through orange and yellow to green for strong trends)
Threshold Line: Horizontal red line at the customizable Trend Enter level
Background Highlight: Subtle green background when trend strength exceeds the enter threshold for strong trend visualization
Alert System: Triggers notifications for strong trend detection
Interpretation:
0-Weak (Red): Minimal trend strength, potential consolidation or ranging market
Mid-Range (Orange/Yellow): Building momentum, watch for breakout potential
At/Above Enter Threshold (Green): Strong trend conditions, potential for continued directional moves
Threshold Crossing: Trend strength crossing above the enter level signals increasing conviction in the current direction
Color Transitions: Gradual shifts from warm (red/orange) to cool (green) tones indicate strengthening trends
🔶 EXAMPLES
Strong Trend Entry: When trend strength crosses above the enter threshold (e.g., 1.2), it identifies the onset of a powerful move where price deviates significantly from the mean.
Example: During a rally, trend strength rising from yellow (around 1.0) to green (1.2+) often precedes sustained upward momentum, providing entry opportunities for trend followers.
Consolidation Detection: Low trend strength values in red shades (below 0.5) highlight periods of low volatility and mean reversion potential.
Example: After a sharp sell-off, persistent red values signal a likely sideways phase, allowing traders to avoid whipsaws and wait for orange/yellow transitions as a precursor to recovery.
Volatility-Adjusted Pullbacks: In volatile markets, the ATR component ensures trend strength remains accurate; a dip back to yellow from green during minor corrections can indicate healthy pullbacks within a strong trend.
Example: Trend strength briefly falling to yellow levels (e.g., 0.8-1.1) after hitting green provides profit-taking signals without invalidating the overall bullish bias if the VWMA holds as support.
Threshold Alert Integration: The alert condition combines strength value with the enter threshold for timely notifications.
Example: Receiving a "Strong Trend Detected" alert when the area plot turns green helps confirm Bitcoin's breakout from consolidation, aligning with increased volume for higher-probability trades.
🔶 SETTINGS
Customization Options:
Lengths: VWMA length (default 14), ATR length (default 14)
Thresholds: Trend enter (default 1.2, step 0.1), trend exit (default 1.15, for potential future signal enhancements)
Visuals: Automatic color scaling with red at 0, transitioning to green at/above enter threshold
Alert Conditions: Strong trend detection (when strength > enter)
The Trend Strength Index equips traders with a robust, easy-to-interpret tool for gauging trend intensity in volatile markets like Bitcoin. By normalizing price deviations against volatility, it delivers reliable signals for identifying high-momentum opportunities while the gradient coloring and alerts facilitate quick assessments in both trending and choppy conditions.

Random Coin Toss Strategy📌 Overview
This strategy is a probability-based trading simulation that randomly decides trade direction using a coin-toss mechanism and executes trades with a customizable risk-reward ratio. It's designed primarily for testing entry frequency and risk dynamics, not predictive accuracy.
🎯 Core Concept
Every N bars (configurable), the strategy performs a pseudo-random coin toss.
Based on the result:
If heads → Buy
If tails → Sell
Once a position is opened, it sets a Stop-Loss (SL) and Take-Profit (TP) based on a multiple of the current ATR (Average True Range) value.
⚙️ Configurable Inputs
ATR Length Period for ATR calculation, determines volatility basis.
SL Multiplier SL distance = ATR × multiplier (e.g., 1.0 means 1x ATR) .
TP Multiplier TP distance = ATR × multiplier (e.g., 2.0 = 2x ATR) .
Entry Frequency Bars to wait between each new coin toss decision.
Show TP/SL Zones Toggle on/off for drawing visual TP and SL zones.
Box Size Number of bars used to define the width of the TP/SL boxes.
🔁 Entry & Exit Logic
Entry:
Happens only when no current position exists and it's the correct bar interval.
Entry direction is randomly decided.
Exit:
Positions exit at either:
Take-Profit (TP) level
Stop-Loss (SL) level
Both are calculated using the configured ATR-based distances.
🖼️ Visual Features
TP and SL zones:
Rendered as shaded rectangles (boxes) only once per trade.
Green box for TP zone, red box for SL zone.
Automatically deleted and redrawn for each new trade to avoid chart clutter.
ATR Display Table:
A minimal info table at the top-right shows the current ATR value.
Updates every few bars for performance.
🧪 Use Cases
Ideal for risk-reward modeling, strategy prototyping, and understanding how volatility-based SL/TP behavior affects results.
Great for backtesting frequency, RR tweaks (e.g., 2:5 or 3:1), and execution structure in random conditions.
⚠️ Disclaimer
Since the trade direction is random, this script is not meant for predictive trading but serves as a powerful experiment framework for studying how SL, TP, and volatility interact with random chance in a controlled, repeatable system.

Enhanced Range Filter Strategy with ATR TP/SLBuilt by Omotola
## **Enhanced Range Filter Strategy: A Comprehensive Overview**
### **1. Introduction**
The **Enhanced Range Filter Strategy** is a powerful technical trading system designed to identify high-probability trading opportunities while filtering out market noise. It utilizes **range-based trend filtering**, **momentum confirmation**, and **volatility-based risk management** to generate precise entry and exit signals. This strategy is particularly useful for traders who aim to capitalize on trend-following setups while avoiding choppy, ranging market conditions.
---
### **2. Key Components of the Strategy**
#### **A. Range Filter (Trend Determination)**
- The **Range Filter** smooths price fluctuations and helps identify clear trends.
- It calculates an **adjusted price range** based on a **sampling period** and a **multiplier**, ensuring a dynamic trend-following approach.
- **Uptrends:** When the current price is above the range filter and the trend is strengthening.
- **Downtrends:** When the price falls below the range filter and momentum confirms the move.
#### **B. RSI (Relative Strength Index) as Momentum Confirmation**
- RSI is used to **filter out weak trades** and prevent entries during overbought/oversold conditions.
- **Buy Signals:** RSI is above a certain threshold (e.g., 50) in an uptrend.
- **Sell Signals:** RSI is below a certain threshold (e.g., 50) in a downtrend.
#### **C. ADX (Average Directional Index) for Trend Strength Confirmation**
- ADX ensures that trades are only taken when the trend has **sufficient strength**.
- Avoids trading in low-volatility, ranging markets.
- **Threshold (e.g., 25):** Only trade when ADX is above this value, indicating a strong trend.
#### **D. ATR (Average True Range) for Risk Management**
- **Stop Loss (SL):** Placed **one ATR below** (for long trades) or **one ATR above** (for short trades).
- **Take Profit (TP):** Set at a **3:1 reward-to-risk ratio**, using ATR to determine realistic price targets.
- Ensures volatility-adjusted risk management.
---
### **3. Entry and Exit Conditions**
#### **📈 Buy (Long) Entry Conditions:**
1. **Price is above the Range Filter** → Indicates an uptrend.
2. **Upward trend strength is positive** (confirmed via trend counter).
3. **RSI is above the buy threshold** (e.g., 50, to confirm momentum).
4. **ADX confirms trend strength** (e.g., above 25).
5. **Volatility is supportive** (using ATR analysis).
#### **📉 Sell (Short) Entry Conditions:**
1. **Price is below the Range Filter** → Indicates a downtrend.
2. **Downward trend strength is positive** (confirmed via trend counter).
3. **RSI is below the sell threshold** (e.g., 50, to confirm momentum).
4. **ADX confirms trend strength** (e.g., above 25).
5. **Volatility is supportive** (using ATR analysis).
#### **🚪 Exit Conditions:**
- **Stop Loss (SL):**
- **Long Trades:** 1 ATR below entry price.
- **Short Trades:** 1 ATR above entry price.
- **Take Profit (TP):**
- Set at **3x the risk distance** to achieve a favorable risk-reward ratio.
- **Ranging Market Exit:**
- If ADX falls below the threshold, indicating a weakening trend.
---
### **4. Visualization & Alerts**
- **Colored range filter line** changes based on trend direction.
- **Buy and Sell signals** appear as labels on the chart.
- **Stop Loss and Take Profit levels** are plotted as dashed lines.
- **Gray background highlights ranging markets** where trading is avoided.
- **Alerts trigger on Buy, Sell, and Ranging Market conditions** for automation.
---
### **5. Advantages of the Enhanced Range Filter Strategy**
✅ **Trend-Following with Noise Reduction** → Helps avoid false signals by filtering out weak trends.
✅ **Momentum Confirmation with RSI & ADX** → Ensures that only strong, valid trades are executed.
✅ **Volatility-Based Risk Management** → ATR ensures adaptive stop loss and take profit placements.
✅ **Works on Multiple Timeframes** → Effective for day trading, swing trading, and scalping.
✅ **Visually Intuitive** → Clearly displays trade signals, SL/TP levels, and trend conditions.
---
### **6. Who Should Use This Strategy?**
✔ **Trend Traders** who want to enter trades with momentum confirmation.
✔ **Swing Traders** looking for medium-term opportunities with a solid risk-reward ratio.
✔ **Scalpers** who need precise entries and exits to minimize false signals.
✔ **Algorithmic Traders** using alerts for automated execution.
---
### **7. Conclusion**
The **Enhanced Range Filter Strategy** is a powerful trading tool that combines **trend-following techniques, momentum indicators, and risk management** into a structured, rule-based system. By leveraging **Range Filters, RSI, ADX, and ATR**, traders can improve trade accuracy, manage risk effectively, and filter out unfavorable market conditions.
This strategy is **ideal for traders looking for a systematic, disciplined approach** to capturing trends while **avoiding market noise and false breakouts**. 🚀

Post-Open Long Strategy with ATR-based Stop Loss and Take ProfitThe "Post-Open Long Strategy with ATR-Based Stop Loss and Take Profit" is designed to identify buying opportunities after the German and US markets open. It combines various technical indicators to filter entry signals, focusing on breakout moments following price lateralization periods.
Key Components and Their Interaction:
Bollinger Bands (BB):
Description: Uses BB with a 14-period length and standard deviation multiplier of 1.5, creating narrower bands for lower timeframes.
Role in the Strategy: Identifies low volatility phases (lateralization). The lateralization condition is met when the price is near the simple moving average of the BB, suggesting an imminent increase in volatility.
Exponential Moving Averages (EMA):
10-period EMA: Quickly detects short-term trend direction.
200-period EMA: Filters long-term trends, ensuring entries occur in a bullish market.
Interaction: Positions are entered only if the price is above both EMAs, indicating a consolidated positive trend.
Relative Strength Index (RSI):
Description: 7-period RSI with a threshold above 30.
Role in the Strategy: Confirms the market is not oversold, supporting the validity of the buy signal.
Average Directional Index (ADX):
Description: 7-period ADX with 7-period smoothing and a threshold above 10.
Role in the Strategy: Assesses trend strength. An ADX above 10 indicates sufficient momentum to justify entry.
Average True Range (ATR) for Dynamic Stop Loss and Take Profit:
Description: 14-period ATR with multipliers of 2.0 for Stop Loss and 4.0 for Take Profit.
Role in the Strategy: Adjusts exit levels based on current volatility, enhancing risk management.
Resistance Identification and Breakout:
Description: Analyzes the highs of the last 20 candles to identify resistance levels with at least two touches.
Role in the Strategy: A breakout above this level signals a potential continuation of the bullish trend.
Time Filters and Market Conditions:
Trading Hours: Operates only during the opening of the German market (8:00 - 12:00) and US market (15:30 - 19:00).
Panic Candle: The current candle must close negative, leveraging potential emotional reactions in the market.
Avoiding Entry During Pullbacks:
Description: Checks that the two previous candles are not both bearish.
Role in the Strategy: Avoids entering during a potential pullback, improving trade success probability.
Post-Open Long Strategy with ATR-Based Stop Loss and Take Profit
The "Post-Open Long Strategy with ATR-Based Stop Loss and Take Profit" is designed to identify buying opportunities after the German and US markets open. It combines various technical indicators to filter entry signals, focusing on breakout moments following price lateralization periods.
Key Components and Their Interaction:
Bollinger Bands (BB):
Description: Uses BB with a 14-period length and standard deviation multiplier of 1.5, creating narrower bands for lower timeframes.
Role in the Strategy: Identifies low volatility phases (lateralization). The lateralization condition is met when the price is near the simple moving average of the BB, suggesting an imminent increase in volatility.
Exponential Moving Averages (EMA):
10-period EMA: Quickly detects short-term trend direction.
200-period EMA: Filters long-term trends, ensuring entries occur in a bullish market.
Interaction: Positions are entered only if the price is above both EMAs, indicating a consolidated positive trend.
Relative Strength Index (RSI):
Description: 7-period RSI with a threshold above 30.
Role in the Strategy: Confirms the market is not oversold, supporting the validity of the buy signal.
Average Directional Index (ADX):
Description: 7-period ADX with 7-period smoothing and a threshold above 10.
Role in the Strategy: Assesses trend strength. An ADX above 10 indicates sufficient momentum to justify entry.
Average True Range (ATR) for Dynamic Stop Loss and Take Profit:
Description: 14-period ATR with multipliers of 2.0 for Stop Loss and 4.0 for Take Profit.
Role in the Strategy: Adjusts exit levels based on current volatility, enhancing risk management.
Resistance Identification and Breakout:
Description: Analyzes the highs of the last 20 candles to identify resistance levels with at least two touches.
Role in the Strategy: A breakout above this level signals a potential continuation of the bullish trend.
Time Filters and Market Conditions:
Trading Hours: Operates only during the opening of the German market (8:00 - 12:00) and US market (15:30 - 19:00).
Panic Candle: The current candle must close negative, leveraging potential emotional reactions in the market.
Avoiding Entry During Pullbacks:
Description: Checks that the two previous candles are not both bearish.
Role in the Strategy: Avoids entering during a potential pullback, improving trade success probability.
Entry and Exit Conditions:
Long Entry:
The price breaks above the identified resistance.
The market is in a lateralization phase with low volatility.
The price is above the 10 and 200-period EMAs.
RSI is above 30, and ADX is above 10.
No short-term downtrend is detected.
The last two candles are not both bearish.
The current candle is a "panic candle" (negative close).
Order Execution: The order is executed at the close of the candle that meets all conditions.
Exit from Position:
Dynamic Stop Loss: Set at 2 times the ATR below the entry price.
Dynamic Take Profit: Set at 4 times the ATR above the entry price.
The position is automatically closed upon reaching the Stop Loss or Take Profit.
How to Use the Strategy:
Application on Volatile Instruments:
Ideal for financial instruments that show significant volatility during the target market opening hours, such as indices or major forex pairs.
Recommended Timeframes:
Intraday timeframes, such as 5 or 15 minutes, to capture significant post-open moves.
Parameter Customization:
The default parameters are optimized but can be adjusted based on individual preferences and the instrument analyzed.
Backtesting and Optimization:
Backtesting is recommended to evaluate performance and make adjustments if necessary.
Risk Management:
Ensure position sizing respects risk management rules, avoiding risking more than 1-2% of capital per trade.
Originality and Benefits of the Strategy:
Unique Combination of Indicators: Integrates various technical metrics to filter signals, reducing false positives.
Volatility Adaptability: The use of ATR for Stop Loss and Take Profit allows the strategy to adapt to real-time market conditions.
Focus on Post-Lateralization Breakout: Aims to capitalize on significant moves following consolidation periods, often associated with strong directional trends.
Important Notes:
Commissions and Slippage: Include commissions and slippage in settings for more realistic simulations.
Capital Size: Use a realistic trading capital for the average user.
Number of Trades: Ensure backtesting covers a sufficient number of trades to validate the strategy (ideally more than 100 trades).
Warning: Past results do not guarantee future performance. The strategy should be used as part of a comprehensive trading approach.
With this strategy, traders can identify and exploit specific market opportunities supported by a robust set of technical indicators and filters, potentially enhancing their trading decisions during key times of the day.

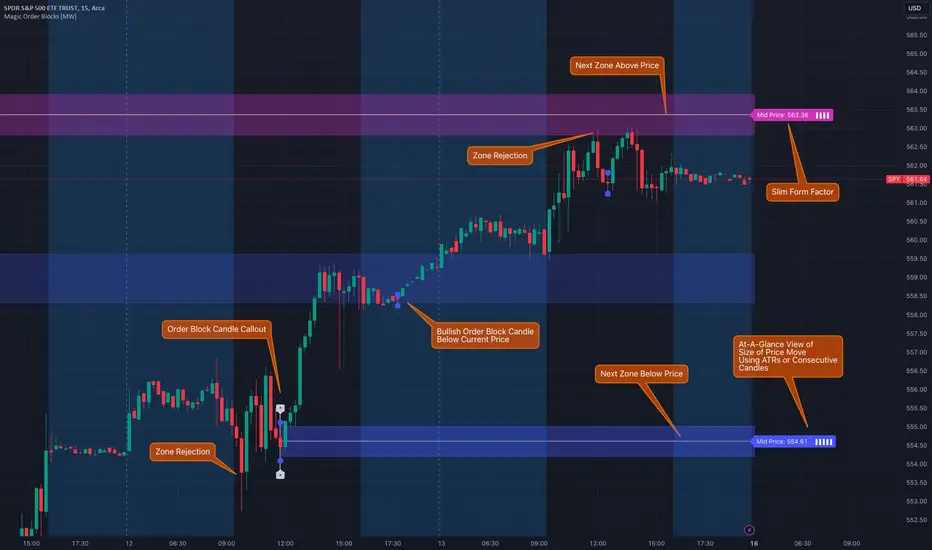
Magic Order Blocks [MW]Add a slim design, minimalist view of the most relevant higher and lower order blocks to your chart. Use our novel method of filtering that uses both the the number of consecutive bullish or bearish candles that follow the order block, and the number of ATRs that the asset’s price changed following the order block. View just the order blocks above and below the current price, or view the backgrounds for each and every one. And, if you're up to it, dig into a comprehensive view of the data for each order block candle.
Settings:
General Settings
Minimum # of Consecutive Bars Following Order Block
Show Bullish Order Blocks Below / Hide Last Bullish Block
Show Bearish Order Blocks Above / Hide Last Bearish Block
Use ATR Filter - Select # of ATRs Below
Closest Order Block is Followed by This Many ATRs
Preferences
Right Offset of Indicator Label
Show Mid-Line from Recent Order Block Indicator Label
Use ATRs Instead of Consecutive Candles in Label Indicator
Show Timestamp of Recent Order Block
Show Large Order Block Detail Labels
Show Small Order Block Labels
Background Settings
Show Background for Recent Order Block Indicator Label
# of Backgrounds to Show Before Now
Show All Bullish Order Block Backgrounds
Show All Bearish Order Block Backgrounds
Calculations
This indicator creates a matrix of each order block that is followed by the user-specified number of consecutive bullish or bearish candles. The data can be further filtered by the number of ATRs that the price moves after the order block - also user-defined. The most recent bearish order block above the current price takes arrays from the initial filtered matrix of arrays, filters once more by the “mid-price” of the order block (the average between the order block candle high and low) and selects the last element from this order block matrix. The same follows for the latest bearish order block above the current price.
How to Use
An order block refers to a price range or zone on a chart where large institutional orders have been placed, causing a significant shift in market direction. These zones are crucial because they often indicate areas of strong buying or selling interest, which can lead to future support or resistance levels. Traders use order blocks to identify potential points of market reversal or continuation.
The Magic Order Blocks default view shows the most recent overhead bearish order block above the current price, and the most recent bullish order block below. These can presumably act as support or resistance levels, because they reflect the last price where a significant price move occurred. “Significant” meaning that the order block candle was followed by many consecutive bullish or bearish candles. Based on the user-defined settings, it can also mean that price moved multiples of the asset's average true range (ATR). More consecutive candles means that the duration of the move lasted a long time. A higher ATR move indicates that the price moved impulsively in one direction.
The default view also shows a label to the right of the current price that provides the price level, the time stamp of the order block (optional), and a sequence of bars that show the significance of the level. By default, these bars represent the number of ATRs that price rose or fell following the order block, but they can be toggled to show the number of consecutive bullish or bearish candles that followed the order block.
Although the default view provides the zones that are most relevant to the current price, past order block candles can also be identified visually with labels as well with translucent backgrounds color-coded for bullish or bearish bias. Overlapping backgrounds can identify an area that has been repeatedly been an area of support or resistance.
A detailed view of each order block can also be viewed the includes the following data points:
Bar Index
Timestamp
Consecutive Accumulated Volume
Consecutive Bars
Price Change over Consecutive Bars
Price/Volume Ratio Over Consecutive Bars
Mid Price of Order Block
High Price of Order Block
Low Price of Order Block
ATRs over Consecutive Bars
- Other Usage Notes and Limitations:
The calculations used only provide an estimated relationship or a close approximation, and are not exact.
It's important for traders to be aware of the limitations of any indicator and to use them as part of a broader, well-rounded trading strategy that includes risk management, fundamental analysis, and other tools that can help with reducing false signals, determining trend direction, and providing additional confirmation for a trade decision. Diversifying strategies and not relying solely on one type of indicator or analysis can help mitigate some of these risks.
Things to keep in mind. Longer timeframes don’t necessarily have a as many consecutive candle drops or gains as with shorter timeframes, so be sure to adjust your settings when moving to 1 hour, 1 day, or 1 week timeframes from 1 minute, 5 minute, or 15 minute timeframes.
Average True Range with Price MAATR with Price Moving Average Indicator
This custom indicator combines the Average True Range (ATR) with a Price Moving Average (MA) to help traders analyze market volatility in percent to the price.
Key Components:
Average True Range (ATR)
Price Moving Average (MA)
ATR/Price in Percent
ATR/Price in Percent
Purpose: This ratio helps traders understand the relative size of the ATR compared to the current price, providing a clearer sense of how significant the volatility is in proportion to the price level.
Calculation: ATR is divided by the current closing price and multiplied by 100 to express it as a percentage. This makes it easier to compare volatility across assets with different price ranges.
Plot: This is plotted as a percentage, making it easier to gauge whether the volatility is proportionally high or low compared to the asset's price.
Usage:
This indicator is designed to help identify the most volatile tokens, making it ideal for configuring a Grid Bot to maximize profit. By focusing on high-volatility assets, traders can capitalize on larger price swings within the grid, increasing the potential for more profitable trades.
Features:
Customizable Smoothing Method: Choose from RMA (Relative Moving Average), SMA (Simple Moving Average), EMA (Exponential Moving Average), or WMA (Weighted Moving Average) for both ATR and the Price Moving Average.
Dual Perspective: The indicator provides both volatility analysis (ATR) and trend analysis (Price MA) in a single view.
Proportional Volatility: The ATR/Price (%) ratio adds a layer of context by showing how volatile the asset is relative to its current price.

LNL Trend SystemLNL Trend System is an ATR based day trading system specifically designed for intra-day traders and scalpers. The System works on any chart time frame & can be applied to any market. The study consist of two components - the Trend Line and the Stop Line. Trend System is based on a special ATR calculation that is achieved by combining the previous values of the 13 EMA in relation to the ATR which creates a line of deviations that visually look similar to the basic moving average but actually produce very different results ESPECIALLY in sideways market.
Trend Line:
Trend Line is a simple line which is basically a fast gauge represented by the 13 EMA that can change the color based on the current trend structure defined by multiple averages (8,13,21,34 EMAs). Trend Line is there to simply add the confluence for the current trend. Colors of the line are pretty much self-explanatory. Whenever the line turns red it states that the current structure is bearish. Vice versa for green line. Gray line represents neutral market structure.
Stop Line:
Stop Line is an ATR deviaton line with special calculation based on the previous bar ATRs and position of the price in relation to the current and previous values of 13 EMA. As already stated, this creates an ATR deviation marker either above or below the price that trails the price up or down until they touch. Whenever the price comes into the Stop Line it means it is making an ATR expansion move up or down .This touch will usually resolve into a reaction (a bounce) which provides trade opportunities.
Trend Bars:
When turned ON, Trend Bars can provide additional confulence of the current trend alongside with the Trend Line color. Trend Bars are based on the DMI and ADX indicators. Whenever the DMI is bearish and ADX is above 20 the candles paint themselfs red. And vice versa applies for the green candles and bullish DMI. Whenever the ADX falls below the 20, candles are netural (Gray) which means there is no real trend in place at the moment.
Trend Mode:
There are total of 5 different trend modes available. Each mode is visualizing different ATR settings which provides either aggressive or more conservative approach. The more tigher the mode, the more closer the distance between the price and the Stop Line. First two modes were designed for slower markets, whereas the "Loose" and "FOMC" modes are more suitable for products with high volatility.
Trend Modes:
1. Tight
Ideal for the slowest markets. Slowest market can be any market with unusually small average true range values or just simply a market that does have a personality of a "sleeper". Tight Mode can be also used for aggresive entries in the most ridiculous trends. Sometimes price will barely pullback to the Trend Line not even the Stop Line.
2. Normal
Normal Mode is the golden mean between the modes. "Normal" provides the ideal ATR lengths for the most used markets such as S&P Futures (ES) or SPY, AAPL and plenty of other highly popular stocks. More often than not, the length of this mode is respected considering there is no breaking news or high impact market event scheduled.
3. Loose
The "Loose" mode is basically a normal mode but a little bit more loose. This mode is useful whenever the ATRs jump higher than usual or during the days of highly anticipated news events. This mode is also better suited for more active markets such as NQ futures.
4. FOMC
The FOMC mode is called FOMC for a reason. This mode provides the maximum amount of wiggle room between the price and the Stop Line. This mode was designed for the extreme volatility, breaking news events or post-FOMC trading. If the market quiets down, this mode will not get the Stop Line touch as frequently as othete modes, thus it is not very useful to run this on markets with the average volatlity. Although never properly tested, perhaps the FOMC mode can find its value in the crypto market?
5. The Net
The net mode is basically a combination of all modes into one stop line system which creates "the net" effect. The Net provides the widest Stop Line zone which can be mainly appreciated by traders that like to use scale-in scale-out methods for their trading. Not to mention the visual side of the indicator which looks pretty great with the net mode on.
HTF (Higher Time Frame) Trend System:
The system also includes additional higher time frame (HTF) trend system. This can be set to any time frame by manual HTF mode. HTF mode set to "auto" will automatically choose the best suitable higher time frame trend system based on how appropriate the aggregation is. For everything below 5min the HTF Trend System will stay on 5min. Anything between 5-15min = 30min. 30min - 120min will turn on the 240min. 180min and higher will result in Daily time frame. Anything above the Daily will result in Weekly HTF aggregation, above W = Monthly, above M = Quarterly.
Background Clouds:
In terms of visualization, each trend system is fully customizable through the inputs settings. There is also an option to turn on/off the background clouds behind the stop lines. These clouds can make the charts more clean & visible.
Tips & Tricks:
1. Different Trend Modes
Try out different modes in different markets. There is no one single mode that will fit to everyone on the same type of market. I myself actually prefer more Loose than the Normal.
2. Stop Line Mirroring
Whenever the Stop Lines start to mirror each other (there is one above the price and one below) this means the price is entering a ranging sideways market. It does not matter which Stop Line will the price touch first. They can both be faded until one of them flips.
3. Signs of the Ranging Market
Watch out for signs of ranging market. Whenever the Trend System looses its colors whether on trend line or trend bars, if everything turns neutral (gray) that is usually a solid indication of a range type action for the following moments. Also as already stated before, the Stop Line mirroring is a good sign of the range market.
4. Trailing Tool, Trend System as an Additional Study?
In case you are not a fan of the colorful green / red charts & candles. You can switch all of them off and just leave the Stop Line on. This way you can use the benefits of the trend system and still use other studies on top of that. Similarly as the Parabolic SAR is often used.
5. The Flip Setup
One of my favorite trades is the Flip Setup on the 5min charts. Whenever the Stop Line is broken , the very first opposing touch after the Trend System flips is a usually a highly participated touch. If there is a strong reaction, this means this is likely a beginning of a new trend. Once I am in the position i like to trail the Stop Line on the 1min charts.
Hope it helps.

Webby's Tight IndicatorWebby's Tight Indicator is used to measure a securities volatility relative to itself over time. This is achieved by taking the average of three short term ATR's (average true range) and creating a ratio versus three longer term ATR's.
Mike Webster recently stated he is using the 3,5,8 for the short term ATR's and the 55,89,144 for the long term ATR's. All of the ATR lengths are part of the Fibonacci sequence.
The ratio of the ATR's is then calculated and plotted as a histogram with 0 representing the ATR's being equal. As a stocks short term ATR contracts the histogram will rise above 0 meaning volatility in the short term is contracting relative to long term volatility. On the other hand if the short ATR's are expanding versus the long term ATR's the histogram will fall below 0 and turn red, signifying short term volatility is greater than long term volatility.
The easy visualization of this indicator allows you to quickly see when a stock is in a tight range and could be ready for a potential breakout to the long side or breakdown to the short side.
In this example we see tight price action with a blue histogram followed by volatility to the upside coinciding with a breakout.
In this example we see volatility expanding as a stock continues to fall.
To help differentiate between trending contraction or expansion and just short term blips 5-day exponential moving average of the ratio is also plotted on the histogram and dynamically changes colors as it rises and falls.
Indicator options include:
Change histogram colors
Choose ema line width

Cumulative TICK Trend[Pt]Cumulative TICK Trend indicator is a comprehensive trading tool that uses TICK data to define the market's cumulative trend. Trend is shown on ATR EMA bands, which is overlaid on the price chart. Cumulative TICK shown on the bottom pane is for reference only.
Main features of the Cumulative TICK Trend Indicator include:
Selectable TICK Source: You have the flexibility to choose your preferred TICK source from the following options, depending on the market you trade: USI:TICK, USI:TICKQ, USI:TICKI, and USI:TICKA.
TICK Data Type: Select the type of TICK data to use, options include: Close, Open, hl2, ohlc4, hlc3.
Simple Moving Average (SMA): You can choose to apply an SMA on the calculated Cumulative TICK values with a customizable length.
Average True Range (ATR) Bands: It provides the option to display ATR bands with adjustable settings. This includes the ATR period, EMA period, source for the ATR calculation, and the ATR multiplier for the upper band.
Trend Color Customization: You can customize the color of the bull and bear trends according to your preference.
Smooth Line Option: This setting allows you to smooth the ATR Bands with a customizable length.
How it Works:
This indicator accumulates TICK data during market hours (9:30-16:00) as per the New York time zone and resets at the start of a new session or the end of the regular session. This cumulative TICK value is then used to determine the trend.
The trend is defined as bullish if the SMA of cumulative TICK is equal to or greater than zero and bearish if it's less than zero. Additionally, this indicator plots the ATR bands, which can be used as volatility measures. The Upper ATR Band and Lower ATR Band can be made smoother using the SMA, according to the trader's preference.
The plot includes two parts for each trend: a stronger color (Red for bear, Green for bull) when the trend is ongoing, and a lighter color when the trend seems to be changing.
Remember, this tool is intended to be used as part of a comprehensive trading strategy. Always ensure you are managing risk appropriately and consulting various data sources to make informed trading decisions.

Variety N-Tuple Moving Averages w/ Variety Stepping [Loxx]Variety N-Tuple Moving Averages w/ Variety Stepping is a moving average indicator that allows you to create 1- 30 tuple moving average types; i.e., Double-MA, Triple-MA, Quadruple-MA, Quintuple-MA, ... N-tuple-MA. This version contains 2 different moving average types. For example, using "50" as the depth will give you Quinquagintuple Moving Average. If you'd like to find the name of the moving average type you create with the depth input with this indicator, you can find a list of tuples here: Tuples extrapolated
Due to the coding required to adapt a moving average to fit into this indicator, additional moving average types will be added as they are created to fit into this unique use case. Since this is a work in process, there will be many future updates of this indicator. For now, you can choose from either EMA or RMA.
This indicator is also considered one of the top 10 forex indicators. See details here: forex-station.com
Additionally, this indicator is a computationally faster, more streamlined version of the following indicators with the addition of 6 stepping functions and 6 different bands/channels types.
STD-Stepped, Variety N-Tuple Moving Averages
STD-Stepped, Variety N-Tuple Moving Averages is the standard deviation stepped/filtered indicator of the following indicator
Last but not least, a big shoutout to @lejmer for his help in formulating a looping solution for this streamlined version. this indicator is speedy even at 50 orders deep. You can find his scripts here: www.tradingview.com
How this works
Step 1: Run factorial calculation on the depth value,
Step 2: Calculate weights of nested moving averages
factorial(depth) / (factorial(depth - k) * factorial(k); where depth is the depth and k is the weight position
Examples of coefficient outputs:
6 Depth: 6 15 20 15 6
7 Depth: 7 21 35 35 21 7
8 Depth: 8 28 56 70 56 28 8
9 Depth: 9 36 34 84 126 126 84 36 9
10 Depth: 10 45 120 210 252 210 120 45 10
11 Depth: 11 55 165 330 462 462 330 165 55 11
12 Depth: 12 66 220 495 792 924 792 495 220 66 12
13 Depth: 13 78 286 715 1287 1716 1716 1287 715 286 78 13
Step 3: Apply coefficient to each moving average
For QEMA, which is 5 depth EMA , the calculation is as follows
ema1 = ta. ema ( src , length)
ema2 = ta. ema (ema1, length)
ema3 = ta. ema (ema2, length)
ema4 = ta. ema (ema3, length)
ema5 = ta. ema (ema4, length)
In this new streamlined version, these MA calculations are packed into an array inside loop so Pine doesn't have to keep all possible series information in memory. This is handled with the following code:
temp = array.get(workarr, k + 1) + alpha * (array.get(workarr, k) - array.get(workarr, k + 1))
array.set(workarr, k + 1, temp)
After we pack the array, we apply the coefficients to derive the NTMA:
qema = 5 * ema1 - 10 * ema2 + 10 * ema3 - 5 * ema4 + ema5
Stepping calculations
First off, you can filter by both price and/or MA output. Both price and MA output can be filtered/stepped in their own way. You'll see two selectors in the input settings. Default is ATR ATR. Here's how stepping works in simple terms: if the price/MA output doesn't move by X deviations, then revert to the price/MA output one bar back.
ATR
The average true range (ATR) is a technical analysis indicator, introduced by market technician J. Welles Wilder Jr. in his book New Concepts in Technical Trading Systems, that measures market volatility by decomposing the entire range of an asset price for that period.
Standard Deviation
Standard deviation is a statistic that measures the dispersion of a dataset relative to its mean and is calculated as the square root of the variance. The standard deviation is calculated as the square root of variance by determining each data point's deviation relative to the mean. If the data points are further from the mean, there is a higher deviation within the data set; thus, the more spread out the data, the higher the standard deviation.
Adaptive Deviation
By definition, the Standard Deviation (STD, also represented by the Greek letter sigma σ or the Latin letter s) is a measure that is used to quantify the amount of variation or dispersion of a set of data values. In technical analysis we usually use it to measure the level of current volatility .
Standard Deviation is based on Simple Moving Average calculation for mean value. This version of standard deviation uses the properties of EMA to calculate what can be called a new type of deviation, and since it is based on EMA , we can call it EMA deviation. And added to that, Perry Kaufman's efficiency ratio is used to make it adaptive (since all EMA type calculations are nearly perfect for adapting).
The difference when compared to standard is significant--not just because of EMA usage, but the efficiency ratio makes it a "bit more logical" in very volatile market conditions.
See how this compares to Standard Devaition here:
Adaptive Deviation
Median Absolute Deviation
The median absolute deviation is a measure of statistical dispersion. Moreover, the MAD is a robust statistic, being more resilient to outliers in a data set than the standard deviation. In the standard deviation, the distances from the mean are squared, so large deviations are weighted more heavily, and thus outliers can heavily influence it. In the MAD, the deviations of a small number of outliers are irrelevant.
Because the MAD is a more robust estimator of scale than the sample variance or standard deviation, it works better with distributions without a mean or variance, such as the Cauchy distribution.
For this indicator, I used a manual recreation of the quantile function in Pine Script. This is so users have a full inside view into how this is calculated.
Efficiency-Ratio Adaptive ATR
Average True Range (ATR) is widely used indicator in many occasions for technical analysis . It is calculated as the RMA of true range. This version adds a "twist": it uses Perry Kaufman's Efficiency Ratio to calculate adaptive true range
See how this compares to ATR here:
ER-Adaptive ATR
Mean Absolute Deviation
The mean absolute deviation (MAD) is a measure of variability that indicates the average distance between observations and their mean. MAD uses the original units of the data, which simplifies interpretation. Larger values signify that the data points spread out further from the average. Conversely, lower values correspond to data points bunching closer to it. The mean absolute deviation is also known as the mean deviation and average absolute deviation.
This definition of the mean absolute deviation sounds similar to the standard deviation (SD). While both measure variability, they have different calculations. In recent years, some proponents of MAD have suggested that it replace the SD as the primary measure because it is a simpler concept that better fits real life.
For Pine Coders, this is equivalent of using ta.dev()
Bands/Channels
See the information above for how bands/channels are calculated. After the one of the above deviations is calculated, the channels are calculated as output +/- deviation * multiplier
Signals
Green is uptrend, red is downtrend, yellow "L" signal is Long, fuchsia "S" signal is short.
Included:
Alerts
Loxx's Expanded Source Types
Bar coloring
Signals
6 bands/channels types
6 stepping types
Related indicators
3-Pole Super Smoother w/ EMA-Deviation-Corrected Stepping
STD-Stepped Fast Cosine Transform Moving Average
ATR-Stepped PDF MA

Supertrend - Ladder ATRThis is a supertrend with slight twisted concept which can be very benefecial in strong trending markets to reduce stop loss distance and exit slightly quicker.
⬜ Concept
▶ When the instrument is trending up, regular ATR shows high values if there are big green candles. This affect the stoploss distance in regular supertrend which leads to wide stops or delayed lagging. When you are in long trade, what matters for stoploss is how much a negative candle can move within bar. Hence, using ATR derived only based on red candles is more beneficial for trailing stops on long signals. Same applies to short trades where using ATR derived from only green candles is more efficient than overall ATR.
▶ ATR will be minimal when the volatility is less and ATR will increase with volatility. That means, once you are in trade, the trailing of stoploss also will vary based on ATR (or volatility). With regular ATR and supertrend, chances of stop loss distance widening is high with increased volatility even though stoploss levels will not move down. This again poses the risk of higher drawdown during trade closure and also keeps in the trade during ranging market. To avoid this, the second trick we are using here is only to reduce the atr stoploss difference when in trade. That is, when in long trade and negative candles ATR is increasing, we will not consider that. We will consider the new ATR only if it is lesser than previous bar ATR.
Effect of these changes on the trending market is quite visual. Lets take example of USDTRY
Settings are quite simple and does not vary much from regular supertrend settings.

XPloRR MA-Buy ATR-Trailing-Stop Long Term Strategy Beating B&HXPloRR MA-Buy ATR-MA-Trailing-Stop Strategy
Long term MA Trailing Stop strategy to beat Buy&Hold strategy
None of the strategies that I tested can beat the long term Buy&Hold strategy. That's the reason why I wrote this strategy.
Purpose: beat Buy&Hold strategy with around 10 trades. 100% capitalize sold trade into new trade.
My buy strategy is triggered by the EMA(blue) crossing over the SMA curve(orange).
My sell strategy is triggered by another EMA(lime) of the close value crossing the trailing stop(green) value.
The trailing stop value(green) is set to a multiple of the ATR(15) value.
ATR(15) is the SMA(15) value of the difference between high and low values.
Every stock has it's own "DNA", so first thing to do is find the right parameters to get the best strategy values voor EMA, SMA and Trailing Stop.
Then keep using these parameter for future buy/sell signals only for that particular stock.
Do the same for other stocks.
Here are the parameters:
Exponential MA: buy trigger when crossing over the SMA value (use values between 11-50)
Simple MA: buy trigger when EMA crosses over the SMA value (use values between 20 and 200)
Stop EMA: sell trigger when Stop EMA of close value crosses under the trailing stop value (use values between 8 and 16)
Trailing Stop #ATR: defines the trailing stop value as a multiple of the ATR(15) value
Example parameters for different stocks (Start capital: 1000, Order=100% of equity, Period 1/1/2005 to now):
BAR(Barco): EMA=11, SMA=82, StopEMA=12, Stop#ATR=9
Buy&HoldProfit: 45.82%, NetProfit: 294.7%, #Trades:8, %Profit:62.5%, ProfitFactor: 12.539
AAPL(Apple): EMA=12, SMA=45, StopEMA=12, Stop#ATR=6
Buy&HoldProfit: 2925.86%, NetProfit: 4035.92%, #Trades:10, %Profit:60%, ProfitFactor: 6.36
BEKB(Bekaert): EMA=12, SMA=42, StopEMA=12, Stop#ATR=7
Buy&HoldProfit: 81.11%, NetProfit: 521.37%, #Trades:10, %Profit:60%, ProfitFactor: 2.617
SOLB(Solvay): EMA=12, SMA=63, StopEMA=11, Stop#ATR=8
Buy&HoldProfit: 43.61%, NetProfit: 151.4%, #Trades:8, %Profit:75%, ProfitFactor: 3.794
PHIA(Philips): EMA=11, SMA=80, StopEMA=8, Stop#ATR=10
Buy&HoldProfit: 56.79%, NetProfit: 198.46%, #Trades:6, %Profit:83.33%, ProfitFactor: 23.07
I am very curious to see the parameters for your stocks and please make suggestions to improve this strategy.
