Engulfing Candles (ATR-Based) with Volume SpikeOverview:
This script is designed to detect high-probability bullish and bearish engulfing patterns — but with a twist: it filters them through ATR-based volatility and confirms strength with volume spikes, all while offering optional trend filtering. It's built for traders who want more than just surface-level candle patterns — it's for those who want contextual confirmation before entering a trade.
What Makes It Different:
Most engulfing candle indicators simply match two candle shapes. This script goes deeper by:
Measuring candle body size relative to recent volatility (via ATR).
Checking for volume confirmation using a dynamic spike threshold.
Filtering based on trend context using SMA-based structure detection.
This tri-layered logic aims to avoid false positives and give traders cleaner, more actionable entries that align with momentum.
Core Concepts:
1. Trend Detection (Optional)
You can choose between two structural filters:
SMA50 only: Looks for price above or below the 50-period SMA to define trend direction.
SMA50 + SMA200 alignment: A stricter rule requiring both fast and slow SMAs to confirm a trend.
Or turn off trend filtering entirely (No detection).
This helps ensure engulfing setups appear in line with the broader trend, increasing the likelihood of continuation.
2. ATR-Filtered Candle Bodies
To eliminate noise:
A candle is only considered a valid engulfing candle if it has a body larger than 1.5× ATR(14).
The previous candle must be a small-bodied candle (less than 0.5× ATR), creating a clear visual engulfing structure.
This method dynamically adjusts for market volatility, so setups are meaningful even during periods of compression or expansion.
3. Volume Spike Confirmation
Not all engulfing candles lead to follow-through. That’s why this script includes a volume confirmation filter:
A 20-period moving average of volume is calculated.
A spike is flagged if the current bar’s volume exceeds 1.5× this average (adjustable).
Patterns with this confirmation are marked with a “*” label (e.g., BU* or BE*) to distinguish volume-backed setups from weaker ones.
Visuals & Alerts:
BU = Bullish engulfing without volume spike
BU* = Bullish engulfing with volume spike
BE = Bearish engulfing without volume spike
BE* = Bearish engulfing with volume spike
A white background highlight is shown behind candles with volume-confirmed engulfing patterns.
Alerts are available for BU* and BE* so you can automate your edge.
How to Use:
Add the indicator to any chart.
Choose your trend filter from the settings panel.
Watch for BU* and BE* labels — these are your highest-conviction signals.
Optional: Combine with support/resistance, Fibonacci zones, or MTF confirmation to refine entries.
Use the included alerts to receive real-time push/email notifications when patterns emerge.
Performance Note:
I’ve found this script to be fairly good when applied to the 1-hour charts of the companies in the US100. The combination of ATR-based filtering and volume confirmation appears to provide clear, high-quality setups with good follow-through potential.
By blending candle patterns, volatility filtering, volume confirmation, and trend context, this script aims to filter out weak signals and highlight the most statistically significant engulfing opportunities.
Cari dalam skrip untuk "ATR"

True Range eXpansion🕯️ TRX — True Range eXpansion
Clean Candle Bodies · Volatility Bands · Adaptive Range Envelope System
Not your grandfather’s candles. Not your brokerage’s bands.
----------------------------------------------------
TRX begins with a simple concept: visualize the true range of every candle, without the noise of flickering wicks.
From there, it grows into a fully adaptive price visualization framework.
What started as a candle-only visualizer evolved into a modular, user-controlled price engine.
From wickless candle clarity to dynamic volatility envelopes, TRX adapts to you.
There are plenty of band and channel indicators out there — Bollinger, Keltner, Donchian, Envelope, the whole crew.
But none of them are built on the true candle range, adaptive ATR shaping, and full user control like TRX.
This isn’t just another indicator — it’s a new framework.
Most bands and channels are based on close price and statistical deviation — useful, but limited.
TRX uses the full true range of each candle as its foundation, then applies customizable smoothing and directional ATR scaling to form a dynamic, volatility-reactive envelope.
The result? Bands that breathe with the market — not lag behind it.
----------------------------------------------------
🔧 Core Features:
🕯️ True Range Candles — Each candle is plotted from low to high, body-only, colored by open/close.
📈 Adjustable High/Low Moving Averages — Select your smoothing style: SMA, EMA, WMA, RMA, or HMA.
🌬️ ATR-Based Expansion — Bands dynamically breathe based on market volatility.
🔀 Per-Band Multipliers — Fine-tune expansion individually for the upper and lower bands.
⚖️ Basis Line — Optional centerline between bands for structure tracking and equilibrium zones.
🎛️ Full Visual Control — Width, transparency, color, on/off toggles for each element.
----------------------------------------------------
🧠 Default Use Case:
With the included default settings, TRX behaves like an evolved Bollinger Band system — based on True Range candle structure, not just close price and standard deviation.
----------------------------------------------------
🔄 How to Zero Out the Bands (for Minimalist Use):
Want just candles? A clean MA? Single band? You got it.
➤ Use TRX like a clean moving average:
• Set ATR Multiplier to 0
• Set both Band ATR Adjustments to 0
• Leave the Basis Line ON or OFF — your call
➤ Show only candles (no bands at all):
• Turn off "Show High/Low MAs"
• Turn off Basis Line
➤ Single-line ceiling or floor tracking:
• Set one band’s Transparency to 100
• Use the remaining band as a price envelope or support/resistance guide
----------------------------------------------------
🧬 Notes:
TRX can be made:
• Spiky or silky (via smoothing & ATR)
• Wide or tight (via multipliers)
• Subtle or aggressive (via color/transparency)
• Clean as a compass or dirty as a chaos meter
Built by accident. Tuned with intention.
Released to the world as one of the most adaptable and expressive visual overlays ever made.
Created by Sherlock_MacGyver

Range Filter Strategy with ATR TP/SLHow This Strategy Works:
Range Filter:
Calculates a smoothed average (SMA) of price
Creates upper and lower bands based on standard deviation
When price crosses above upper band, it signals a potential uptrend
When price crosses below lower band, it signals a potential downtrend
ATR-Based Risk Management:
Uses Average True Range (ATR) to set dynamic take profit and stop loss levels
Take profit is set at entry price + (ATR × multiplier) for long positions
Stop loss is set at entry price - (ATR × multiplier) for long positions
The opposite applies for short positions
Input Parameters:
Adjustable range filter length and multiplier
Customizable ATR length and TP/SL multipliers
All parameters can be optimized in TradingView's strategy tester
You can adjust the input parameters to fit your trading style and the specific market you're trading. The ATR-based exits help adapt to current market volatility.

Pivot ATR Zones [v6]🟩 Pivot ATR Zones
Overview:
The Pivot ATR Zones indicator plots dynamic support and resistance zones based on pivot highs and lows, combined with ATR (Average True Range) volatility levels. It helps traders visually identify potential long and short trade areas, along with realistic target and stop loss zones based on market conditions.
Features:
Automatically detects pivot highs and lows
Draws ATR-based entry zones on the chart
Plots dynamic take-profit and stop-loss levels using ATR multipliers
Color-coded long (green) and short (red) zones
Entry arrow markers for clearer trade visualization
Real-time alerts when new zones form
Best For:
Scalpers, intraday traders, and swing traders who want a visual, volatility-aware way to mark potential trade areas based on key pivot structures.
How to Use:
Look for newly formed green zones for long opportunities and red zones for short setups.
Use the dashed lines as dynamic take-profit and stop levels, tuned to the current ATR value.
Combine with other confirmation tools or indicators for optimal results.
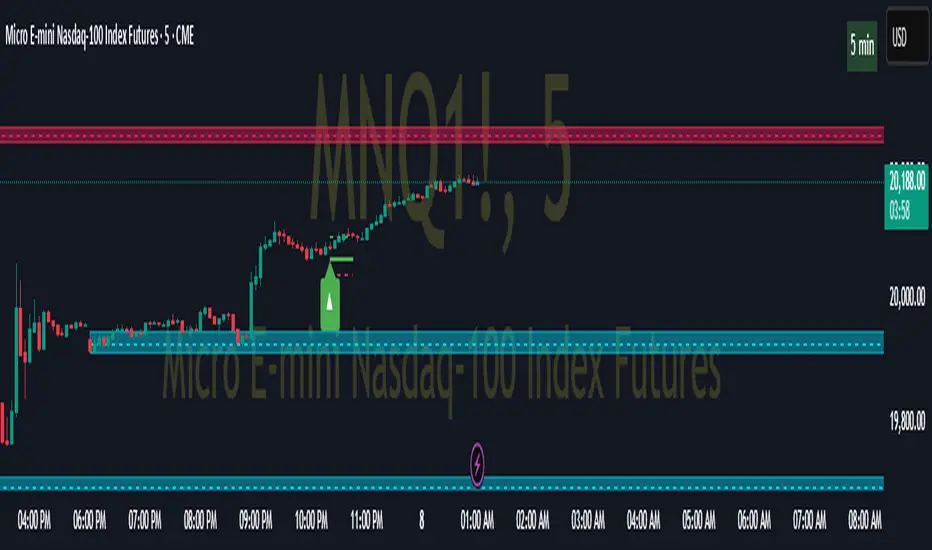
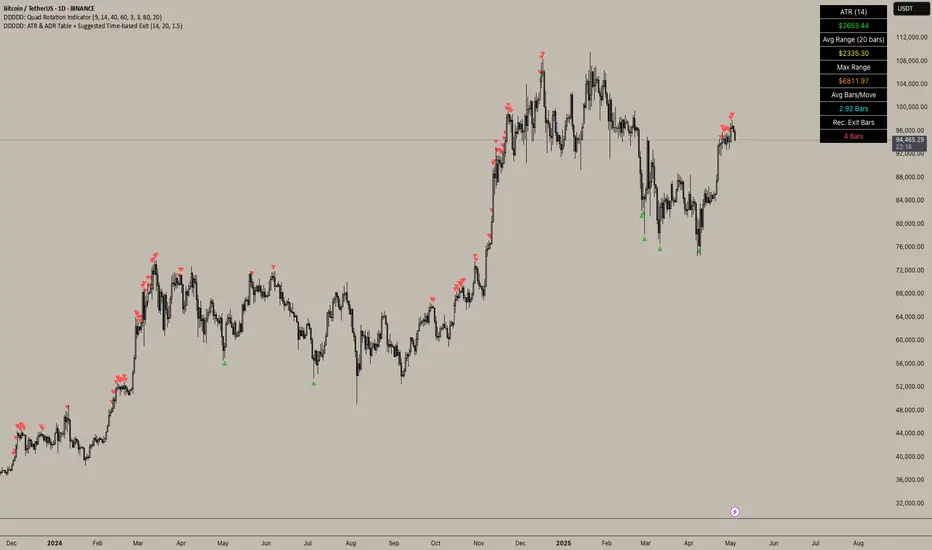
DDDDD: ATR & ADR Table + Suggested Time-based Exit📈 DDDDD: ATR & ADR Table + Suggested Time-based Exit
This indicator provides a simple yet powerful table displaying key volatility metrics for any timeframe you apply it to. It is designed for traders who want to assess the volatility of an asset, estimate the average time required for a potential move, and define a time-based exit strategy.
🔍 Features:
Displays ATR (Average True Range) for the selected length
Shows Average Range (High-Low) and Maximum Range over a configurable number of bars
Calculates Avg Bars/Move → average number of bars needed to achieve the maximum range
Calculates Recommended Exit Bars → suggested maximum holding period (in bars) before considering an exit if price hasn’t moved as expected
All values dynamically adjust based on the chart’s current timeframe
Outputs values directly in a table overlay on your main chart for quick reference
📝 How to interpret the table:
Field Meaning
ATR (14) Average True Range over the last 14 bars (volatility indicator)
Avg Range (20) Average High-Low range over the last 20 bars
Max Range Maximum High-Low range observed in the last 20 bars
Avg Bars/Move Average number of bars it takes to achieve a Max Range move
Rec. Exit Bars Suggested max holding period (bars) → consider exit if move hasn’t occurred
✅ How to use:
Apply this indicator to any chart (works on minutes, hourly, daily, weekly…)
It will automatically calculate based on the chart’s current timeframe
Use ATR & Avg Range to gauge volatility
Use Avg Bars/Move to estimate how long the market usually takes to achieve a big move
Use Rec. Exit Bars as a soft stop — if price hasn’t moved by this time, consider exiting due to declining probability of a breakout
⚠️ Notes:
All values are relative to your current chart timeframe. For example:
→ On a daily chart, ATR represents daily volatility
→ On a 1H chart, ATR represents hourly volatility
“Bars” refers to the bars of the current timeframe. Always interpret time accordingly.
Perfect for traders who want to:
Time their trades based on average volatility
Avoid overholding losing positions
Set time-based exit rules to complement price-based stoplosses
RSI + ADX + ATR Combo Indicator: RSI + ADX + ATR Combo Filter
This indicator is a confluence filter tool that combines RSI, ADX, and ATR into a single, easy-to-read chart overlay. It is designed to help traders identify low-volatility, non-trending zones with balanced momentum—ideal for strategies that rely on breakouts or reversals.
🔍 Core Components:
RSI (Relative Strength Index)
Standard RSI with custom upper and lower bounds (default: 60 and 40).
Filters out extreme overbought/oversold regions and focuses on price consolidation zones.
ADX (Average Directional Index)
Measures trend strength.
When ADX is below a custom threshold (default: 20), it indicates a weak or range-bound trend.
ATR (Average True Range)
Represents volatility.
Low ATR values (default threshold: 2.5) are used to filter out high-volatility environments, helping refine entries.
🟣 Signal Logic:
A signal is highlighted with a background color when all three conditions are met:
RSI is between lower and upper bounds (e.g., 40 < RSI < 60) ✅
ADX is below the trend threshold (e.g., ADX < 20) ✅
ATR is below the volatility threshold (e.g., ATR < 2.5) ✅
These combined conditions suggest a low-volatility, low-trend strength, and balanced momentum zone—perfect for anticipating breakouts or strong directional moves.

Ehlers Instantaneous Trendline ATR LevelsOverview
This sophisticated technical analysis tool merges John Ehlers' cutting-edge Instantaneous Trendline methodology with a dynamic ATR-based bands system. The indicator is designed to provide traders with a comprehensive view of market trends while accounting for volatility, making it suitable for both trending and ranging markets. Works on all timeframes and chart types.
Key Features in Detail
1. Ehlers Instantaneous Trendline Implementation
- Advanced algorithm that reduces lag typically associated with moving averages
- Built-in volatility filtering system to minimize false signals
- Adaptive to market conditions through dynamic calculations
- Real-time trend direction identification
2. Multi-layered ATR Band System
- Hierarchical band structure with 18 total bands (9 upper, 9 lower)
- Color-coded visualization system:
Upper bands: Red gradient (darker = further from trendline)
Lower bands: Green gradient (darker = further from trendline)
Central trendline: Yellow for optimal visibility
- Customizable multipliers for each band level
- Independent visibility controls for each band
Configuration Options
Trendline Settings:
- Lower values: More responsive to price changes and faster reacting to break in ATR filter
- Higher values: Smoother trendline with less noise and slower reacting to break in ATR filter
ATR Configuration:
Period: Customizable from 1 to any positive integer
- Longer periods: More stable volatility measurement
- Shorter periods: More reactive to recent volatility changes
Filter Multiplier: Fine-tune volatility filtering
- Higher values: More filtered signals leading to less shift in bands
- Lower values: More sensitive to price movements leading to more band shifts
Practical Applications
1. Trend Analysis
Use the central trendline for primary trend direction
Monitor band crossovers for trend strength confirmation
Track price position relative to bands for trend context
2. Volatility Assessment
Band spacing indicates current market volatility
Width between bands helps identify consolidation vs. expansion phases
Price Extremes
3. Support and Resistance
Each band acts as a dynamic support/resistance level
Multiple timeframe analysis possible adjusting for different timeframe ATR

Optimized Auto-Detect Strategy (MA, ATR, Trend, RSI) Overview
This script is designed for traders seeking a trend-following approach that adapts to different currency pairs (e.g., EURUSD, NZDUSD, XAUUSD). It combines moving average crossovers with ATR-based stops, optional trend filters, and RSI filters to help reduce false signals and capture larger moves.
Key Features
1. Auto-Detect Logic
- Automatically applies different moving average periods and ATR multipliers based on the symbol (e.g., XAUUSD, EURUSD, NZDUSD).
- Makes it easy to switch charts without manually adjusting parameters each time.
2. ATR-Based Stop
- Uses the Average True Range (ATR) to set dynamic stop-loss levels, adapting to each market’s volatility.
3. Optional Trend Filter
- Filters out trades if price is below the 200 SMA for longs (and above for shorts), aiming to avoid choppy, range-bound markets.
4. Optional RSI Filter
- Only enters long if RSI is above a certain threshold (e.g., 50), or short if below another threshold, reducing entries during low momentum.
5. Partial Exit & Trailing/Break-Even
- Locks in partial profit at a chosen R:R (e.g., 1:1), then either trails the remaining position or moves the stop to break-even.
- This helps capture additional gains if the trend extends beyond the initial target.
6. Customizable Parameters
- You can toggle on/off each filter (Trend, RSI) and adjust the ATR multiplier, MA periods, partial exit levels, etc.
- Allows easy optimization for different pairs or timeframes.
How to Use
1. Add to Chart: Click “Add to chart” in the Pine Editor.
2. Configure Inputs: In the script’s settings, toggle the filters you want (Trend Filter, RSI Filter, etc.) and set your desired ATR multiplier, RSI thresholds, partial exit ratio, etc.
3. Strategy Tester: Check the performance under the “Strategy Tester” tab. Adjust parameters if needed.
4. Realistic Settings: Consider adding spreads/commissions in the “Properties” tab for more accurate backtests, especially if you trade pairs with higher spreads (like XAUUSD).
Disclaimer
No Guarantee: This script does not guarantee profits. Markets are unpredictable, and results may vary with market conditions.
For Educational Purposes: Always do your own research and forward testing. Past performance does not indicate future results.

hector mena Breakout Trading with ATR, RSI and MA CrossTitle: Breakout Trading Strategy with ATR, RSI, and Moving Average Cross
Description (English):
This script combines key technical indicators—ATR (Average True Range), RSI (Relative Strength Index), and Moving Averages—to provide a comprehensive breakout trading strategy. It is designed to help traders identify significant breakout levels and confirm signals with momentum and trend analysis.
How It Works:
ATR for Breakout Levels:
The ATR is used to calculate dynamic breakout levels by adjusting the highest resistance and lowest support levels with a customizable multiplier. This ensures that breakout levels adapt to market volatility.
RSI for Momentum Confirmation:
The RSI identifies overbought and oversold conditions, providing an additional layer of confirmation for breakouts. A breakout accompanied by an RSI signal can indicate stronger momentum.
Moving Average Cross for Trend Validation:
Two simple moving averages (short-term and long-term) are included to validate the trend. A crossover suggests a potential change in trend, aligning with breakout signals.
Why Combine These Indicators?
The ATR ensures breakout levels are realistic and volatility-adjusted.
The RSI avoids false signals by confirming if the price has momentum during a breakout.
Moving Average crossovers add trend-following confirmation, helping traders align with market direction.
The combination provides a robust framework to filter out false signals and improve the reliability of trading decisions.
Key Features:
Breakout Levels: Upper and lower breakout levels dynamically calculated using ATR.
RSI Confirmation: Visual overbought (70) and oversold (30) levels and RSI plot.
Trend Validation: Short and long-term moving averages plotted on the chart with crossover signals.
Visual Alerts: Clear "BUY" and "SELL" labels for actionable signals.
Custom Alerts: Configurable alerts for breakouts and moving average crossovers.
How to Use It:
Adjust the parameters (ATR length, multiplier, RSI length, and moving averages) based on your trading strategy.
Look for "BUY" signals when:
Price breaks above the resistance level, and RSI indicates oversold conditions.
Moving averages cross bullishly.
Look for "SELL" signals when:
Price breaks below the support level, and RSI indicates overbought conditions.
Moving averages cross bearishly.
Use alerts for automated notifications about potential trades.
Notes:
This script is intended for educational purposes. Use it alongside proper risk management techniques and backtesting.
Always test in demo mode before applying it to live trading.

Ultimate Total MA + ATRIndicator Description (English)
Name: Tendencias FX - Multi-Line with Customizable Offsets (1x..6x)
This script is a multi-purpose trend-following indicator that calculates a central Moving Average (Mid Line) plus a set of 6 different bands (1x to 6x) above and below that average. Each band is determined by a user-defined ATR length and multiplier. Key features include:
Independent MA Types
Choose different moving average methods for the Mid Line and for the ATR calculation.
Available types: SMA, EMA, WMA, RMA, HMA, and ALMA.
Separate Lengths
Configure the length of the Mid Line independently from the ATR length.
This allows fine-tuning of both the central average and the volatility measure.
6 Customizable Multipliers
Bands are calculated for 1x, 2x, 3x, 4x, 5x, and 6x multiples of the chosen ATR.
Each level has its own checkbox in the Inputs tab so you can show or hide them at will.
Color Dynamics
The Mid Line automatically changes color to green when its current value is higher than the previous bar’s value, and red otherwise.
All upper/lower bands are rendered in a neutral gray (#787b86) for easy distinction.
Time Shift (Offset)
An offset parameter allows shifting the entire indicator (Mid Line plus bands) forward (to the right) or backward (to the left) by a certain number of bars.
This can help evaluate leads/lags, or compare the past behavior of these lines against future price developments.
Check Boxes for Visibility
Checkboxes in the Inputs let you toggle 1x..6x band levels.
By default, 1x, 2x, and 3x are visible, while 4x, 5x, and 6x are off.
Overlay with Shared Price Scale
The script is set as overlay=true and uses scale=scale.right, so it draws directly on the main chart and shares the same price axis as your candles.
This indicator is ideal if you want:
A central MA for trend detection.
ATR-based volatility bands (up to 6 multipliers).
Full control over the type and length of both the Mid Line MA and the ATR.
An optional offset to shift the lines in time for backtesting or forward-projection.
Usage Tips
In the Inputs tab, customize:
Mid Line length and ATR length independently.
MA methods for both Mid Line and ATR (SMA, EMA, WMA, RMA, HMA, ALMA).
Band visibility via checkboxes for 1x..6x.
Offset for shifting lines in time.
In the Style tab, you can further customize colors, line widths, and visibility of each element (Mid line, ±1x..±6x).
Enjoy exploring different settings to best match your preferred trading style and timeframe!

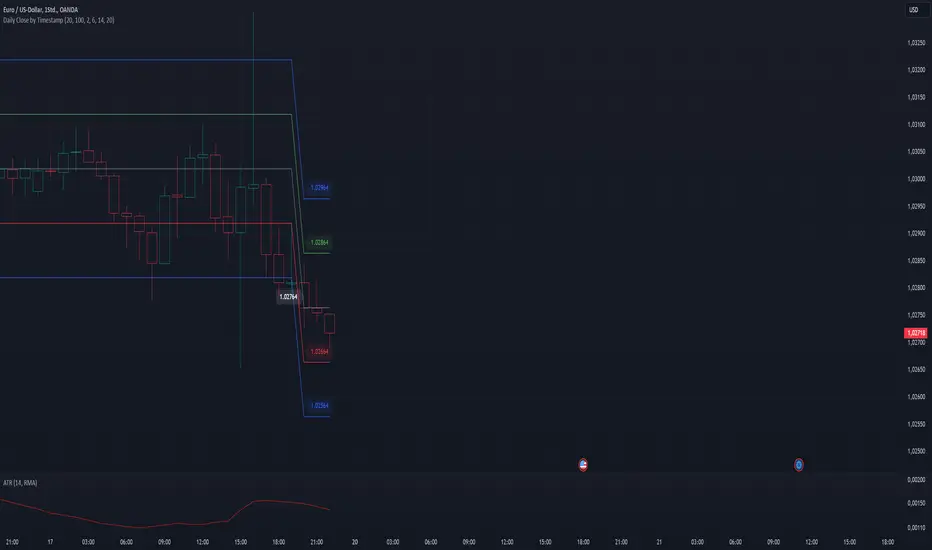
Daily Close Levels with ATR and Custom OffsetsDescription:
This Pine Script visualizes daily close levels, calculates key price zones based on custom offsets and ATR (Average True Range), and is an essential tool for traders analyzing support and resistance zones.
Features
Close Value Line: Displays the daily close value as a line on the chart.
ATR Values: Shows the ATR value in both price and tick format.
Custom Offsets:
Calculates positive and negative price levels based on a user-defined tick offset.
Supports multipliers for extended zones (e.g., 2x offset).
Labels:
Displays the close value and ATR on the chart.
Annotates calculated price levels directly on the corresponding lines.
Time Control: Calculates levels at a user-defined hour (e.g., 20:00).
Customizable Parameters:
Close Time (Hour): Choose the specific hour for analyzing the close price.
Custom Line Offset: Define the price offset in ticks.
ATR Length: Adjust the ATR calculation length.
Timezone Offset: Supports time adjustments for different time zones.
Enable/Disable Labels and Values: Toggle the display of labels and values on the chart.
Multi-Timeframe Volatility ATR - [by Oberlunar]This script (for now in beta release) is specifically designed for scalping or traders operating on lower timeframes (if you are in a timeframe of one minute wait one minute to collect statistics). Its primary purpose is to provide detailed insights into market volatility by calculating the ATR (Average True Range) and its percentage changes, allowing traders to quickly identify shifts in market conditions.
The ATR is calculated across six user-defined timeframes, which can include very short intervals such as 5 or 15 seconds. This setup enables real-time monitoring of volatility, which is critical for scalping strategies. The script collects a rolling history of the last five ATR values for each timeframe. These historical values are used to calculate percentage changes by comparing the current ATR with the oldest value in the history, offering a clear view of how volatility is evolving over time.
Percentage changes are displayed dynamically in a table, with color-coded feedback to indicate the direction of the change: green for increases, red for decreases, and gray for stability or insufficient data. This visual representation makes it easy to spot whether market volatility is rising or falling at a glance.
By progressively collecting data, the script becomes increasingly effective as more ATR values are accumulated. This functionality is especially useful for traders on lower timeframes, where rapid changes in volatility can signal breakout opportunities or shifts in market dynamics.
Soon I will update personalized ATR parameters, and lookback strategies for statistics.

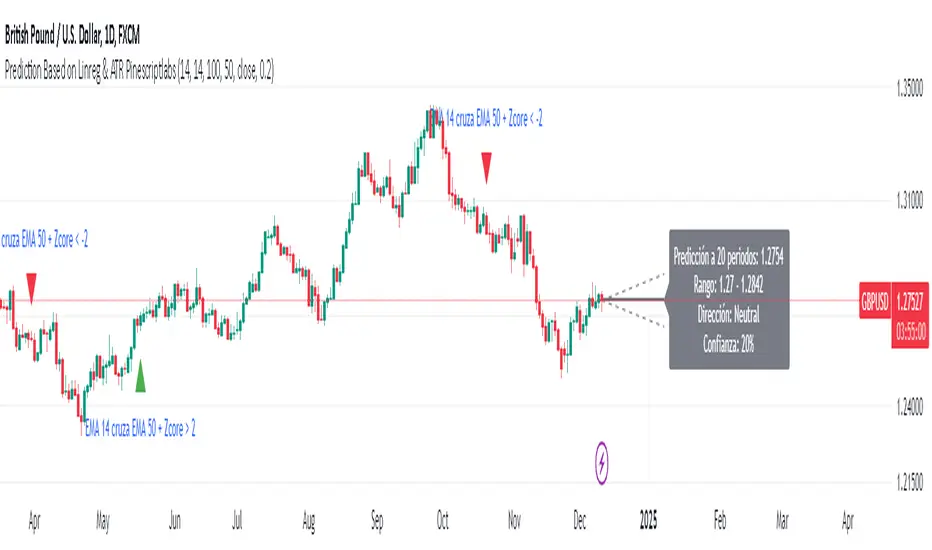
Prediction Based on Linreg & Atr
We created this algorithm with the goal of predicting future prices 📊, specifically where the value of any asset will go in the next 20 periods ⏳. It uses linear regression based on past prices, calculating a slope and an intercept to forecast future behavior 🔮. This prediction is then adjusted according to market volatility, measured by the ATR 📉, and the direction of trend signals, which are based on the MACD and moving averages 📈.
How Does the Linreg & ATR Prediction Work?
1. Trend Calculation and Signals:
o Technical Indicators: We use short- and long-term exponential moving averages (EMA), RSI, MACD, and Bollinger Bands 📊 to assess market direction and sentiment (not visually presented in the script).
o Calculation Functions: These include functions to calculate slope, average, intercept, standard deviation, and Pearson's R, which are crucial for regression analysis 📉.
2. Predicting Future Prices:
o Linear Regression: The algorithm calculates the slope, average, and intercept of past prices to create a regression channel 📈, helping to predict the range of future prices 🔮.
o Standard Deviation and Pearson's R: These metrics determine the strength of the regression 🔍.
3. Adjusting the Prediction:
o The predicted value is adjusted by considering market volatility (ATR 📉) and the direction of trend signals 🔮, ensuring that the prediction is aligned with the current market environment 🌍.
4. Visualization:
o Prediction Lines and Bands: The algorithm plots lines that display the predicted future price along with a prediction range (upper and lower bounds) 📉📈.
5. EMA Cross Signals:
o EMA Conditions and Total Score: A bullish crossover signal is generated when the total score is positive and the short EMA crosses above the long EMA 📈. A bearish crossover signal is generated when the total score is negative and the short EMA crosses below the long EMA 📉.
6. Additional Considerations:
o Multi-Timeframe Regression Channel: The script calculates regression channels for different timeframes (5m, 15m, 30m, 4h) ⏳, helping determine the overall market direction 📊 (not visually presented).
Confidence Interpretation:
• High Confidence (close to 100%): Indicates strong alignment between timeframes with a clear trend (bullish or bearish) 🔥.
• Low Confidence (close to 0%): Shows disagreement or weak signals between timeframes ⚠️.
Confidence complements the interpretation of the prediction range and expected direction 🔮, aiding in decision-making for market entry or exit 🚀.
Español
Creamos este algoritmo con el objetivo de predecir los precios futuros 📊, específicamente hacia dónde irá el valor de cualquier activo en los próximos 20 períodos ⏳. Utiliza regresión lineal basada en los precios pasados, calculando una pendiente y una intersección para prever el comportamiento futuro 🔮. Esta predicción se ajusta según la volatilidad del mercado, medida por el ATR 📉, y la dirección de las señales de tendencia, que se basan en el MACD y las medias móviles 📈.
¿Cómo Funciona la Predicción con Linreg & ATR?
Cálculo de Tendencias y Señales:
Indicadores Técnicos: Usamos medias móviles exponenciales (EMA) a corto y largo plazo, RSI, MACD y Bandas de Bollinger 📊 para evaluar la dirección y el sentimiento del mercado (no presentados visualmente en el script).
Funciones de Cálculo: Incluye funciones para calcular pendiente, media, intersección, desviación estándar y el coeficiente de correlación de Pearson, esenciales para el análisis de regresión 📉.
Predicción de Precios Futuros:
Regresión Lineal: El algoritmo calcula la pendiente, la media y la intersección de los precios pasados para crear un canal de regresión 📈, ayudando a predecir el rango de precios futuros 🔮.
Desviación Estándar y Pearson's R: Estas métricas determinan la fuerza de la regresión 🔍.
Ajuste de la Predicción:
El valor predicho se ajusta considerando la volatilidad del mercado (ATR 📉) y la dirección de las señales de tendencia 🔮, asegurando que la predicción esté alineada con el entorno actual del mercado 🌍.
Visualización:
Líneas y Bandas de Predicción: El algoritmo traza líneas que muestran el precio futuro predicho, junto con un rango de predicción (límites superior e inferior) 📉📈.
Señales de Cruce de EMAs:
Condiciones de EMAs y Puntaje Total: Se genera una señal de cruce alcista cuando el puntaje total es positivo y la EMA corta cruza por encima de la EMA larga 📈. Se genera una señal de cruce bajista cuando el puntaje total es negativo y la EMA corta cruza por debajo de la EMA larga 📉.
Consideraciones Adicionales:
Canal de Regresión Multi-Timeframe: El script calcula canales de regresión para diferentes marcos de tiempo (5m, 15m, 30m, 4h) ⏳, ayudando a determinar la dirección general del mercado 📊 (no presentado visualmente).
Interpretación de la Confianza:
Alta Confianza (cerca del 100%): Indica una fuerte alineación entre los marcos temporales con una tendencia clara (alcista o bajista) 🔥.
Baja Confianza (cerca del 0%): Muestra desacuerdo o señales débiles entre los marcos temporales ⚠️.
La confianza complementa la interpretación del rango de predicción y la dirección esperada 🔮, ayudando en las decisiones de entrada o salida en el mercado 🚀.
Position Sizing Calculator (Real-Time)█ SUMMARY
The following indicator is a Position Sizing Calculator based on Average True Range (ATR), originally developed by market technician J. Welles Wilder Jr., intended for real-time trading.
This script utilizes the user's account size, acceptable risk percentage, and a stop-loss distance based on ATR to dynamically calculate the appropriate position size for each trade in real time.
█ BACKGROUND
Developed for use on the 5-minute timeframe, this script provides traders with continuously updated, dynamic position sizes. It enables traders to instantly determine the exact number of shares and dollar amount to use for entering a trade within their acceptable risk tolerance whenever a trade opportunity arises.
This real-time position sizing tool helps traders make well-informed decisions when planning trade entries and calculating maximum stop-loss levels, ultimately enhancing risk management.
█ USER INPUTS
Trading Account Size: Total dollar value of the user's trading account.
Acceptable Risk (%): Maximum percentage of the trading account that the user is willing to risk per trade.
ATR Multiplier for Stop-Loss: Multiplier used to determine the distance of the stop-loss from the current price, based on the ATR value.
ATR Length: The length of the lookback period used to calculate the ATR value.

Dual Strategy Selector V2 - CryptogyaniOverview:
This script provides traders with a dual-strategy system that they can toggle between using a simple dropdown menu in the input settings. It is designed to cater to different trading styles and needs, offering both simplicity and advanced filtering techniques. The strategies are built around moving average crossovers, enhanced by configurable risk management tools like take profit levels, trailing stops, and ATR-based stop-loss.
Key Features:
Two Strategies in One Script:
Strategy 1: A classic moving average crossover strategy for identifying entry signals based on trend reversals. Includes user-defined take profit and trailing stop-loss options for profit locking.
Strategy 2: An advanced trend-following system that incorporates:
A higher timeframe trend filter to confirm entry signals.
ATR-based stop-loss for dynamic risk management.
Configurable partial take profit to secure gains while letting the trade run.
Highly Customizable:
All key parameters such as SMA lengths, take profit levels, ATR multiplier, and timeframe for the trend filter are adjustable via the input settings.
Dynamic Toggle:
Traders can switch between Strategy 1 and Strategy 2 with a single dropdown, allowing them to adapt the strategy to market conditions.
How It Works:
Strategy 1:
Entry Logic: A long trade is triggered when the fast SMA crosses above the slow SMA.
Exit Logic: The trade exits at either a user-defined take profit level (percentage or pips) or via an optional trailing stop that dynamically adjusts based on price movement.
Strategy 2:
Entry Logic: Builds on the SMA crossover logic but adds a higher timeframe trend filter to align trades with the broader market direction.
Risk Management:
ATR-Based Stop-Loss: Protects against adverse moves with a volatility-adjusted stop-loss.
Partial Take Profit: Allows traders to secure a percentage of gains while keeping some exposure for extended trends.
How to Use:
Select Your Strategy:
Use the dropdown in the input settings to choose Strategy 1 or Strategy 2.
Configure Parameters:
Adjust SMA lengths, take profit, and risk management settings to align with your trading style.
For Strategy 2, specify the higher timeframe for trend filtering.
Deploy and Monitor:
Apply the script to your preferred asset and timeframe.
Use the backtest results to fine-tune settings for optimal performance.
Why Choose This Script?:
This script stands out due to its dual-strategy flexibility and enhanced features:
For beginners: Strategy 1 provides a simple yet effective trend-following system with minimal setup.
For advanced traders: Strategy 2 includes powerful tools like trend filters and ATR-based stop-loss, making it ideal for challenging market conditions.
By combining simplicity with advanced features, this script offers something for everyone while maintaining full transparency and user customization.
Default Settings:
Strategy 1:
Fast SMA: 21, Slow SMA: 49
Take Profit: 7% or 50 pips
Trailing Stop: Optional (disabled by default)
Strategy 2:
Fast SMA: 20, Slow SMA: 50
ATR Multiplier: 1.5
Partial Take Profit: 50%
Higher Timeframe: 1 Day (1D)

Adaptive MA Crossover with ATR-Based Risk MarkersDescription:
The Cross MA Entry Indicator with ATR-Based Stop-Loss and Take-Profit Markers is a powerful tool designed to help traders identify trend-following opportunities while managing risk effectively. By combining customizable moving average (MA) crossovers with ATR-based stop-loss (SL) and take-profit (TP) markers, this indicator provides a complete entry and risk management framework in a single script.
Unique Features:
1. Versatile Moving Average Combinations: The indicator allows users to select from four types of moving averages—SMA, EMA, DEMA, and TEMA—for both fast and slow lines, enabling a variety of crossover configurations. This flexibility helps traders tailor entry signals to specific trading strategies, asset types, or market conditions, enhancing the adaptability of the indicator across different styles and preferences.
2. ATR-Based Dynamic Risk Management: Leveraging the Average True Range (ATR), the indicator dynamically calculates stop-loss and take-profit levels based on market volatility. This approach adjusts to changing market conditions, making it more responsive and reliable for setting realistic, volatility-based risk parameters.
3. Customizable Risk/Reward Ratio: Users can define their preferred risk/reward ratio (e.g., 2:1, 3:1) to tailor take-profit levels relative to stop-loss distances. This feature empowers traders to align trades with their individual risk management strategies and objectives, while maintaining consistency and discipline in execution.
4. Streamlined Visualization of Entry and Risk Levels: Upon a crossover, the indicator places discrete markers at the calculated SL and TP levels, avoiding clutter while providing traders with an immediate view of potential risk and reward. Small dots represent SL and TP levels, offering a clean, clear display of critical decision points.
How to Use:
1. Entry Signals from MA Crossovers: This indicator generates entry signals when the selected moving averages cross, with green markers indicating long entries and red markers indicating short entries. The customizable MA selection enables traders to optimize crossover signals for various timeframes and asset classes.
2. Integrated Risk Markers: SL and TP levels are shown as small dots at the crossover point, based on the ATR multiplier and risk/reward ratio settings. These markers allow traders to quickly visualize the defined risk and potential reward for each entry.
This indicator offers a comprehensive solution for trend-following strategies by combining entry signals with adaptive risk management. Suitable for multiple timeframes, it allows for backtesting and adjustments to ATR and risk/reward parameters for improved alignment with individual trading goals. As with all strategies, thorough testing is recommended to ensure compatibility with your trading approach.

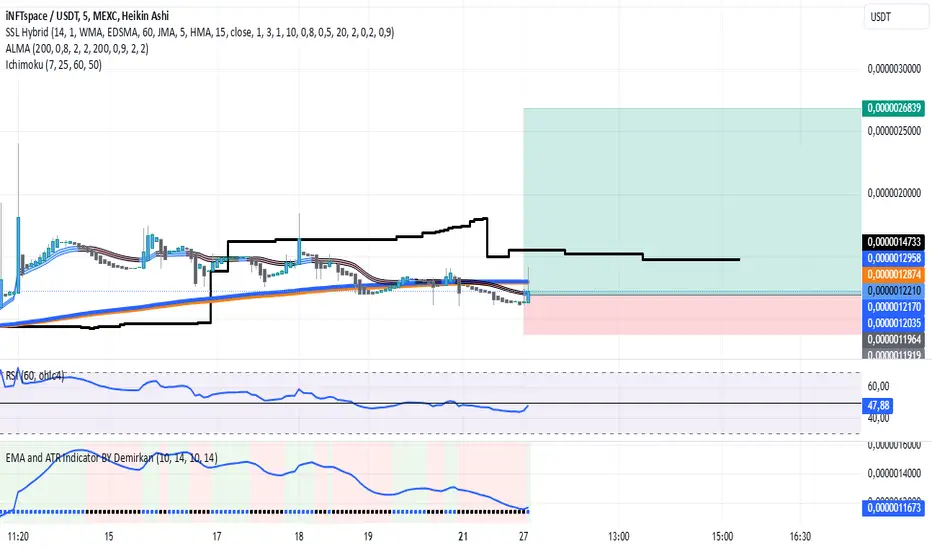
EMA and ATR Indicator BY DemirkanEMA 10 and ATR Indicator BY Demirkan
The EMA 10 and ATR Indicator combines two powerful technical indicators used to analyze trends and identify potential trading opportunities.
Indicator Components:
Exponential Moving Average (EMA):
EMA 10: Calculates the weighted average of the last 10 closing prices. This indicator is effective in tracking short-term price movements. When the price is above the EMA, it is considered that the trend is upward; when it is below, it is assessed as a downward trend.
Average True Range (ATR):
ATR: A measure of market volatility. When the ATR value falls within a specified range (between 10 and 14 in this indicator), the price movement is considered significant. This helps you base your trading decisions on more solid grounds.
Usage Recommendations:
Buy Signal: When the price is above the EMA and the ATR is within the specified range, this can be interpreted as a potential buy signal.
Sell Signal: When the price is below the EMA, this can be interpreted as a potential sell signal.
Chart Displays:
EMA Line: Displayed as a blue line, allowing you to see how the EMA relates to current price levels.
Price Status: Circles are used to indicate whether the price is above or below the EMA. A green circle indicates the price is above the EMA, while a red circle indicates it is below.
Background Colors: The chart background changes to green or red to highlight buy and sell conditions.
Aesthetic Presentation:
Using the "Flag" and "Below" parameters for the Price vs EMA indicator provides an aesthetically pleasing appearance on the chart. This type of visual presentation helps users quickly and easily grasp trading signals. Additionally, this aesthetic touch makes investors' charts look more professional and appealing.
This indicator is a useful tool for traders looking to develop short-term trading strategies. However, it should always be used in conjunction with additional analysis and other indicators.
Note: This indicator is for educational purposes only and should not be taken as investment advice.
Volumetric Volatility Breaker Blocks [UAlgo]The "Volumetric Volatility Breaker Blocks " indicator is designed for traders who want a comprehensive understanding of market volatility combined with volume analysis. This indicator provides a clear visualization of significant volatility areas (or blocks), characterized by price movements that exceed a specific volatility threshold, as calculated using the ATR (Average True Range). The concept is enhanced by integrating volume-based insights, offering a view of market activity that helps users to recognize when significant price changes are being supported by an appropriate level of market participation.
The indicator calculates breaker blocks for both bullish and bearish market conditions, providing distinct visual elements that identify periods of high volatility and substantial volume divergence. The focus on both volume and volatility makes this tool versatile, allowing traders to assess the strength of price movements as well as areas where price might break above or below previously established levels.
It supports adjustable parameters, such as volatility length, smoothness factor, and volume display, allowing traders to fine-tune the indicator according to their trading strategy and market environment. The highlighted breaker blocks assist in identifying zones of potential price reversal or continuation, which can be critical for making informed trading decisions.
🔶 Key Features
Volatility-Based Block Identification: The indicator uses the Average True Range (ATR) to determine the volatility of the market. When the ATR exceeds a specified threshold (smooth ATR multiplied by a user-defined multiplier), it highlights these areas as volatility blocks. The idea is to mark periods where price activity is significantly divergent from normal conditions, which often signals market opportunities.
Volume Integrated Analysis: In addition to tracking volatility, the indicator incorporates volume data, allowing traders to see the amount of activity that occurs during these high-volatility periods. This helps in identifying whether a price movement is likely sustainable or whether it lacks market support.
User Adjustable Parameters: The indicator offers customization options for the volatility length (using ATR), smooth length, and multiplier for sensitivity adjustment. These settings enable users to modify the indicator’s responsiveness to market conditions.
The option to display the last few volatility blocks allows traders to manage clutter on their charts and focus only on the most recent significant data.
Mitigation Method: Users can select between different mitigation methods ("Close" or "Wick") to determine how blocks are broken. This adds an extra layer of adaptability, allowing traders to modify the indicator's response based on different price action strategies.
Dynamic Visual Representation: The indicator dynamically draws boxes for volatility blocks and shades them according to market direction, with split areas showing the bullish and bearish strength contributions. It also provides percentage volume for each block, helping traders understand the relative market participation during these moves.
🔶 Interpreting the Indicator
Identifying High Volatility Areas: When a new volatility block appears, it signifies that the market is experiencing higher-than-usual volatility, driven by increased ATR values. Traders should pay attention to these blocks, as they often indicate that a significant price move is occurring. Bullish blocks suggest upward pressure, whereas bearish blocks indicate downward pressure.
Volume Insights: The volume associated with each volatility block provides an insight into how much market participation accompanies these moves. Higher volume within a block implies that the market is actively supporting the price change, which may be a sign of continuation. Low volume suggests that the movement may lack the strength to persist.
Bullish vs. Bearish Strength Analysis: Each block is split into bullish and bearish strength, giving a clearer picture of what’s happening within the volatility period. If the bullish portion dominates, it indicates strong upward sentiment during that period. Conversely, if the bearish side is more prominent, there is more selling pressure. This breakdown helps in understanding intra-block market dynamics.
Volume Percentage Display: The indicator also displays the volume percentage in each block, which provides context for the strength of the move relative to recent market activity. Higher percentages mean more market engagement, which could confirm the legitimacy of a trend or a significant breakout.
🔶 Disclaimer
Use with Caution: This indicator is provided for educational and informational purposes only and should not be considered as financial advice. Users should exercise caution and perform their own analysis before making trading decisions based on the indicator's signals.
Not Financial Advice: The information provided by this indicator does not constitute financial advice, and the creator (UAlgo) shall not be held responsible for any trading losses incurred as a result of using this indicator.
Backtesting Recommended: Traders are encouraged to backtest the indicator thoroughly on historical data before using it in live trading to assess its performance and suitability for their trading strategies.
Risk Management: Trading involves inherent risks, and users should implement proper risk management strategies, including but not limited to stop-loss orders and position sizing, to mitigate potential losses.
No Guarantees: The accuracy and reliability of the indicator's signals cannot be guaranteed, as they are based on historical price data and past performance may not be indicative of future results.

Volatility Trend Bands [UAlgo]The Volatility Trend Bands is a trend-following indicator that combines the concepts of volatility and trend detection. Built using the Average True Range (ATR) to measure volatility, this indicator dynamically adjusts upper and lower bands around price movements. The bands act as dynamic support and resistance levels, making it easier to identify trend shifts and potential entry and exit points.
With the ATR multiplier, this indicator effectively captures volatility-based shifts in the market. The use of midline values allows for accurate trend detection, which is displayed through color-coded signals on the chart. Additionally, this tool provides clear buy and sell signals, accompanied by intuitive graphical markers for ease of use.
The Volatility Trend Bands is ideal for traders seeking an adaptive trend-following method that responds to changing market conditions while maintaining robust volatility control.
🔶 Key Features
Dynamic Support and Resistance: The indicator utilizes volatility to create dynamic bands. The upper band acts as resistance, and the lower band acts as support for the price. Wider bands indicate higher volatility, while narrower bands indicate lower volatility.
Customizable Inputs
You can tailor the indicator to your strategy by adjusting the:
Price Source: Select the price data (e.g., closing price) used for calculations.
ATR Length: Define the lookback period for the Average True Range (ATR) volatility measure.
ATR Multiplier: This factor controls the width of the volatility bands relative to the ATR value.
Color Options: Choose colors for the bands and signal arrows for better visualization.
Visual Signals: Arrows ("▲" for buy, "▼" for sell) appear on the chart when the trend changes, providing clear entry point indications.
Alerts: Integrated alerts for both buy and sell conditions, allowing you to receive notifications for potential trade opportunities.
🔶 Interpreting Indicator
Upper and Lower Bands: The upper and lower bands are dynamic, adjusting based on market volatility using the ATR. These bands serve as adaptive support and resistance levels. When price breaks above the upper band, it indicates a potential bullish breakout, signaling a strong uptrend. Conversely, a break below the lower band signals a bearish breakout, indicating a downtrend.
Buy/Sell Signals: The indicator provides clear buy and sell signals at breakout points. A buy signal ("▲") is generated when the price breaks above the upper band, suggesting the start of a bullish trend. A sell signal ("▼") is triggered when the price breaks below the lower band, indicating the beginning of a bearish trend. These signals help traders identify potential entry and exit points at key breakout levels.
Color-Coded Bars: The bars on the chart change color based on the trend direction. Teal bars represent bullish momentum, while purple bars signify bearish momentum. This color coding provides a quick visual cue about the market's current direction.
🔶 Disclaimer
Use with Caution: This indicator is provided for educational and informational purposes only and should not be considered as financial advice. Users should exercise caution and perform their own analysis before making trading decisions based on the indicator's signals.
Not Financial Advice: The information provided by this indicator does not constitute financial advice, and the creator (UAlgo) shall not be held responsible for any trading losses incurred as a result of using this indicator.
Backtesting Recommended: Traders are encouraged to backtest the indicator thoroughly on historical data before using it in live trading to assess its performance and suitability for their trading strategies.
Risk Management: Trading involves inherent risks, and users should implement proper risk management strategies, including but not limited to stop-loss orders and position sizing, to mitigate potential losses.
No Guarantees: The accuracy and reliability of the indicator's signals cannot be guaranteed, as they are based on historical price data and past performance may not be indicative of future results.

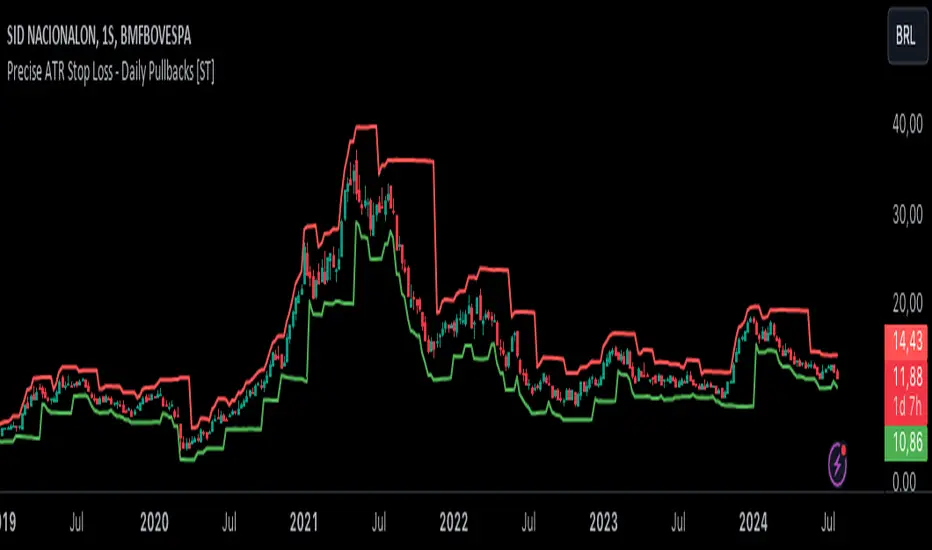
Precise ATR Stop Loss - Daily Pullbacks [ST]Precise ATR Stop Loss - Daily Pullbacks
This indicator uses ATR (Average True Range) combined with the identification of pullback lows and highs on daily charts to calculate more precise stop loss levels.
How it works:
Identification of Pullbacks:
Pullback Lows: Identifies significant low points on daily charts that can serve as support.
Pullback Highs: Identifies significant high points on daily charts that can serve as resistance.
ATR (Average True Range):
Measures market volatility and is used to adjust stop loss levels according to market conditions.
Dynamic Stop Loss:
Stop Loss for Uptrend:
When a pullback low is identified on a daily chart, the stop loss is set slightly below this point, adjusted by the ATR.
This level is shown by a green line on the chart.
Stop Loss for Downtrend:
When a pullback high is identified on a daily chart, the stop loss is set slightly above this point, adjusted by the ATR.
This level is shown by a red line on the chart.
Indicator Benefits:
Improved Precision: Uses significant pullback points on daily charts to set stops more accurately.
Dynamic Stop Loss:
Automatically adjusts stop loss levels according to market volatility, providing more effective risk management.
Título: Precise ATR Stop Loss - Daily Pullbacks
Descrição em Português:
Este indicador utiliza o ATR (Average True Range) combinado com a identificação de fundos e topos de pullback em gráficos diários para calcular níveis de stop loss mais precisos.
Como funciona:
Identificação de Pullbacks:
Fundos de Pullback: Identifica pontos de mínima significativos em gráficos diários que podem servir como suporte.
Topos de Pullback: Identifica pontos de máxima significativos em gráficos diários que podem servir como resistência.
ATR (Average True Range):
Mede a volatilidade do mercado e é utilizado para ajustar os níveis de stop loss de acordo com as condições do mercado.
Stop Loss Dinâmico:
Stop Loss para Tendência de Alta: Quando um fundo de pullback é identificado em um gráfico diário, o stop loss é colocado um pouco abaixo desse ponto, ajustado pelo ATR. Este nível é mostrado por uma linha verde no gráfico.
Stop Loss para Tendência de Baixa: Quando um topo de pullback é identificado em um gráfico diário, o stop loss é colocado um pouco acima desse ponto, ajustado pelo ATR. Este nível é mostrado por uma linha vermelha no gráfico.
Benefícios do Indicador:
Precisão Melhorada: Utiliza pontos de pullback significativos em gráficos diários para posicionar stops de forma mais precisa.
Stop Loss Dinâmico: Ajusta automaticamente os níveis de stop loss de acordo com a volatilidade do mercado, proporcionando uma gestão de risco mais eficaz.
SLOPED Trailing SL with ATR-V1SLOPED Trailing SL with ATR
I thought capital is sometime locked for long periods s when volatility is low, hence:
SLOPED Trailing SL with ATR
This indicator provides a trailing stop loss that dynamically adjusts based on the Average True Range (ATR) and incorporates a user-defined upward slope on flat areas. It is designed to follow the price movement more closely during trends while allowing for a customizable slope to maintain a trailing stop even when the price movement is flat.
Key Features:
ATR-Based Stop Loss:
Utilizes the ATR to calculate a dynamic stop loss level, adjusting to market volatility.
Provides a normal ATR stop loss line that only trails upwards, preventing it from decreasing.
Upward Slope on Flat Areas:
Adds a user-defined upward slope to the trailing stop loss when the price movement is flat.
The slope value is specified in 1/1000 increments (e.g., 0.1% per bar), allowing for fine-tuned control.

Multi Timeframe ATR IndicatorThe Average True Range (ATR) indicator is a technical analysis tool used to measure market volatility. The ATR indicator is designed to capture the degree of price movement or price volatility over a specified period of time. It does this by calculating the true range for each bar or candlestick on a chart and then taking an average of these true range values over a set period.
In the provided Pine Script code, the ATR indicator is being calculated for two different timeframes, which allows traders to compare volatility across different periods. The script includes user-defined inputs for the length of the ATR calculation and the type of smoothing (RMA or SMA) to be applied to the true range values. The 'smoothingFunc' function within the script determines whether to use the RMA (Relative Moving Average) or SMA (Simple Moving Average) based on the user's selection.
The true range for each bar is calculated as the maximum of the following three values: the difference between the current high and low, the absolute value of the difference between the current high and the previous close, and the absolute value of the difference between the current low and the previous close. This calculation is designed to ensure that gaps and limit moves are properly accounted for in the volatility measurement.
The script then uses the 'smoothingFunc' to calculate the ATR values for the two timeframes, and these values are plotted on the chart as two separate lines, allowing traders to visually assess the volatility levels.
Overall, this custom ATR indicator is a versatile tool for traders who wish to analyse market volatility and compare it across different timeframes, potentially aiding in making more informed trading decisions based on the prevailing market conditions.

SuperTrend ToolkitThe SuperTrend Toolkit (Super Kit) introduces a versatile approach to trend analysis by extending the application of the SuperTrend indicator to a wide array of @TradingView's built-in or Community Scripts . This tool facilitates the integration of the SuperTrend algorithm with various indicators, including oscillators, moving averages, overlays, and channels.
Methodology:
The SuperTrend, at its core, calculates a trend-following indicator based on the Average-True-Range (ATR) and price action. It creates dynamic support and resistance levels, adjusting to changing market conditions, and aiding in trend identification.
pine_st(simple float factor = 3., simple int length = 10) =>
float atr = ta.atr(length)
float up = hl2 + factor * atr
up := up < nz(up ) or close > nz(up ) ? up : nz(up )
float lo = hl2 - factor * atr
lo := lo > nz(lo ) or close < nz(lo ) ? lo : nz(lo )
int dir = na
float st = na
if na(atr )
dir := 1
else if st == nz(up )
dir := close > up ? -1 : 1
else
dir := close < lo ? 1 : -1
st := dir == -1 ? lo : up
@TradingView's native SuperTrend lacks the flexibility to incorporate different price sources into its calculation.
Community scripts, addressed the limitation by implementing the option to input different price sources, for example, one of the most popular publications, @KivancOzbilgic's SuperTrend script.
In May 2023, @TradingView introduced an update allowing the passing of another indicator's plot as a source value via the input.source() function. However, the built-in ta.atr function still relied on the chart's price data, limiting the formerly mentioned scripts to the chart's price data alone.
Unique Approach -
This script addresses the aforementioned limitations by processing the data differently.
Firstly we create a User-Defined-Type (UDT) replicating a bar's open, high, low, close (OHLC) values.
type bar
float o = open
float h = high
float l = low
float c = close
We then use this type to store the external input data.
src = input.source(close, "External Source")
bar b = bar.new(
nz(src ) , open 𝘷𝘢𝘭𝘶𝘦
math.max(nz(src ), src), high 𝘷𝘢𝘭𝘶𝘦
math.min(nz(src ), src), low 𝘷𝘢𝘭𝘶𝘦
src ) close 𝘷𝘢𝘭𝘶𝘦
Finally, we pass the data into our custom built SuperTrend with ATR functions to derive the external source's version of the SuperTrend indicator.
supertrend st = b.st(mlt, len)
- Setup Guide -
Utility and Use Cases:
Universal Compatibility - Apply SuperTrend to any built-in indicator or script, expanding its use beyond traditional price data.
- A simple example on one of my own public scripts -
Trend Analysis - Gain additional trend insights into otherwise mainly mean reverting or volume indicators.
- Alerts Setup Guide -
The Super Kit empowers traders and analysts with a tool that adapts the robust SuperTrend algorithm to a myriad of indicators, allowing comprehensive trend analysis and strategy development.
