EMA/Session/ATR/LotSizeSeveral indicators combined
1. 6 Exponential Moving Averages - Identifying the trend direction or using EMAs as a dynamic support/resistance.
2. Session on Chart - Highlighting session for day trading. London, New York, Tokyo, and Sydney.
3. Average True Range - display the Average True Range on recent price to calculate the volatility.
4. Lot Size Calculator - to calculate lot size based on account balance, risk per trade, atr stop-loss, and art multiplier.
5. ATRX - ATRX is an indicator that gives the value of the (close price - EMA 27)/ATR (14)
It tells how strong the trend is compared to its volatility
According to AJ. BANK FTMO Trader Thailand, if the value of ATRX is between 2X-3X or -2X-3X, you should consider trading using climax zone on timeframe H1.
If the ATRX is more than 3X or less than -3X but does not exceed 4X or -4X, you should consider trading using timeframe M15 in the climax zone.
However, if the ATRX exceeds 4X or -4X, use M5 instead.
Cari dalam skrip untuk "ATR"

adx: Configurable ADX (library) Library "adx"
Calculate ADX (and its constituent parts +DI, -DI, ATR),
using different moving averages and periods.
adx(atrMA, diMA, adxMA, atrLen, diLen, adxLen, h, l, c)
Parameters:
atrMA : Moving Average used for calculating the Average True Range.
Traditionally RMA, but using SMA here and in adxMA gives good results too.
diMA : Moving Average used for calculating the Directional Index.
Traditionally, RMA.
adxMA : Moving Average used for calculating the Average Directional
Index. Traditionally RMA, but using SMA here and in atrMA gives good results
too.
atrLen : Length of the Average True Range.
diLen : Length of the Directional Index.
adxLen : Length (smoothing) of the Average Directional Index.
h : Candle's high.
l : Candle's low.
c : Candle's close.
Returns:

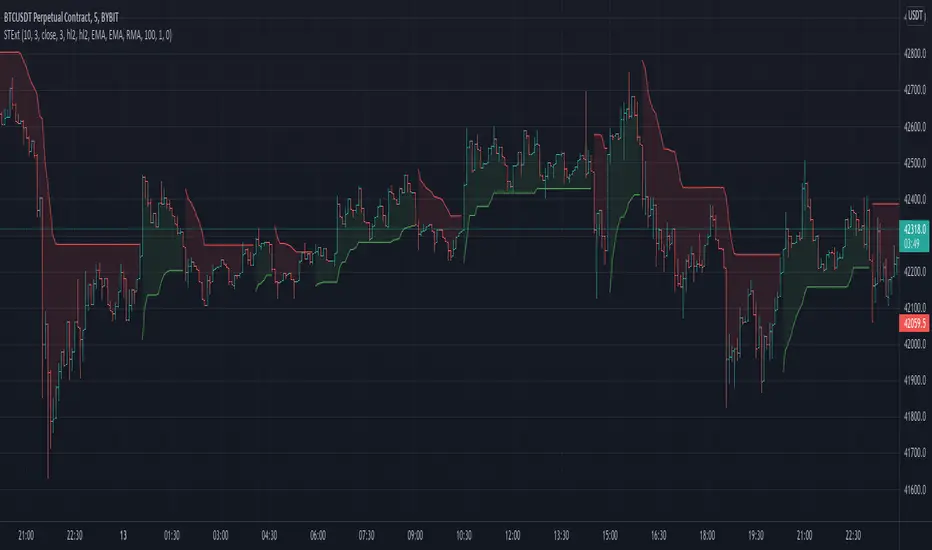
Supertrend Ext1st it exactly looks like the original Supertrend indicator. But if you see the options, you can see it is totally different:
It uses my other indicator inside: Zero Lag Keltner Channels, so you can use smoothed ATR bands for calculation instead of the raw ATR. By default it's length is 1 so it works like the original Supertrend.
You can choose different sources and moving averages for Keltner Channel calculation
It can filter outliers in ATR calculation
The indicator code is in my TAExt library, so it can easily be used in custom strategies.
Average True Range (VStop) Cloud SignalsThis indicator extends the built-in Volatility Stop indicator to a visual signals type indicator based on the crossover of a small VStop value (default 1.5x ATR) and a larger VStop value (default 3x ATR). The two values form a "cloud" with default coloring based on RSI/strength of trend.

Buy / Sell alert indicator [Crypto_BCT]Hello everyone!
I bring to your attention a indicator to determine the point of buy and sell purchase.
It is based on oscillators and a moving average.
It can be used to work with bots, for example 3COMMAS DCA bot.
Signal Condition Settings:
ATR
The current candle is larger than the ATR for this period
EMA
The signal is necessarily below (for buy) and above (for sell) the EMA of the specified period
(Buy) RSI low
The RSI index is below this value
(Sell) RSI High
The RSI index is higher than this value
(Buy) MFI low
The MFI index is below this value
(Sell) MFI High
The MFI index is higher than this value
(Buy) CCI low
CCI index is below this value
(Sell) CCI High
The CCI index is higher than this value
(Buy) Lowest bar from
The closing of the current bar is lower than the closing of the bars back in this range
(Sell) Highest bar from
The closing of the current bar is higher than the closing of bars in this range
(Buy) Lowest EMA bar ago
During a given distance back, the EMA value only decreased
(Sell) Highest EMA bar ago
At a given distance back, the EMA value only increased
I hope it will be useful!

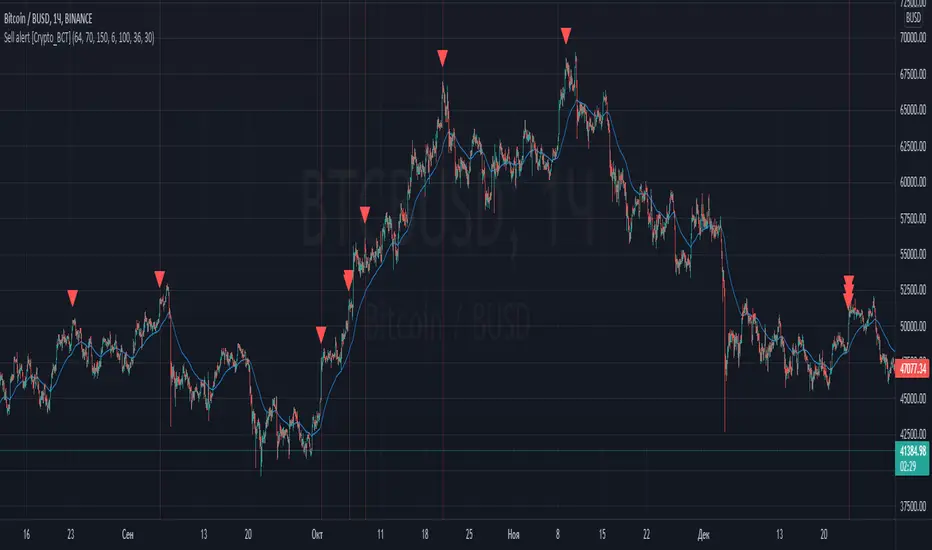
Sell alert [Crypto_BCT]Hello everybody!
I bring to your attention an indicator for determining the point of sell.
It is based on oscillators and a moving average.
Signal Condition Settings:
ATR
The current candle is larger than the ATR for this period
EMA
The signal must be above the EMA of the specified period
MFI High
The MFI index is higher than this value
CCI High
The CCI index is higher than this value
RSI High
The RSI index is higher than this value
Highest bar from
The closing of the current bar is higher than the closing of bars in this range
Highest EMA bar ago
At a given distance back, the EMA value only increased
I hope it will be useful!
Buy alert [Crypto_BCT]Hello everyone!
I bring to your attention a simple indicator to determine the point of purchase.
It is based on oscillators and a moving average.
It can be used to work with bots, for example 3COMMAS DCA bot.
Signal Condition Settings:
ATR
The current candle is larger than the ATR for this period
EMA
The signal is necessarily below the EMA of the specified period
MFI low
The MFI index is below this value
CCI low
CCI index is below this value
RSI low
The RSI index is below this value
Lowest bar from
The closing of the current bar is lower than the closing of the bars back in this range
Lowest EMA bar ago
During a given distance back, the EMA value only decreased
I hope it will be useful!

[Sextan] Supertrend - Ladder ATR BacktestLevel: 1
NOTE: This is a request by @upslidedown to backtest Supertrend - Ladder ATR by HeWhoMustNotBeNamed with my Sextan framework. You can backtest many of my indicators in minutes now! Of course,you can define your own indicator in the highlighted area in compliance with the uniform format, which guarantee when you use "Indicator on Indicator" function, it would not produce any error.
Courtesy of HeWhoMustNotBeNamed for his Supertrend - Ladder ATR indicator
Background
Backtesting of technical indicators and strategies is the most common way to understand a quantitative strategy. However, the complicated configuration and adaptation work of backtesting many quantitative tools makes many traders who do not understand the code daunted. Moreover, although I have written a lot of strategies, I am still not very satisfied with the backtest configuration and writing efficiency. Therefore, I have been thinking about how to build a backtesting framework that can quickly and easily evaluate the backtesting performance of any indicator with a "long/short entry" indicator, that is, a "simple backtesting tool for dummies". The performance requirements should be stable, and the operation should be simple and convenient. It is best to "copy", "paste", and "a few mouse clicks" to complete the quick backtest and evaluation of a new indicator.
Luckily, I recently realized that TradingView provides an "Indicator on Indicator" feature, which is the perfect foundation for doing "hot swap" backtesting. My basic idea is to use a two-layer design. The first layer is the technical indicator signal source that needs to be embedded, which is only used to provide buy and sell signals of custom strategies; the second layer is the trading system, which is used to receive the output signals of the first layer, and filter the signals according to the agreed specifications. , Take Profit, Stop Loss, draw buy and sell signals and cost lines, define and send custom buy and sell alert messages to mobile phones, social software or trading interfaces. In general, this two-layer design is a flexible combination of "death and alive", which can meet the needs of most traders to quickly evaluate the performance of a certain technical indicator. The first layer here is flexible. Users can insert their own strategy codes according to my template, and they can draw buy and sell signals and output them to the second layer. The second layer is fixed, and the overall framework is solidified to ensure the stability and unity of the trading system. It is convenient to compare different or similar strategies under the same conditions. Finally, all trading signals are drawn on the chart, and the output strategy returns. test report.
The main function:
The first layer: "{Sextan} Your Indicator Source", the script provides a template for personalized strategy input, and the signal and definition interfaces ensure full compatibility with the second layer. Backtesting is performed stably in the backtesting framework of the layer. The first layer of this script is also relatively simple: enter your script in the highlighted custom script area, and after ensuring the final buy and sell signals long = bool condition, short = bool condition, the design of the first layer is considered complete. Input it into the PINE script editor of TradingView, save it and add it to the chart, you can see the pulse sequence in yellow (buy) and purple (sell) on the sub-picture, corresponding to the main picture, you can subjectively judge that the quality of the trading point of the strategy is good Bad.
The second layer: "{Sextan} PINEv4 Sextans Backtest Framework". This script is the standardized trading system strategy execution and alarm, used to generate the final report of the strategy backtest and some key indicators that I have customized that I find useful, such as: winning rate , Odds, Winning Surface, Kelly Ratio, Take Profit and Stop Loss Thresholds, Trading Frequency, etc. are evaluated according to the Kelly formula. To use the second layer, first load it into the TrainingView chart, no markers will appear on the chart, since you have not specified any strategy source signals, click on the gear-shaped setting next to the "{Sextan} PINEv4 Sextans BTFW" header button, you can open the backtest settings, the first item is to select your custom strategy source. Because we have added the strategy source to the chart in the previous step, you can easily find an option "{Sextan} Your Indicator Source: Signal" at the bottom of the list, this is the strategy source input we need, select and confirm , you can see various markers on the main graph, and quickly generate a backtesting profit graph and a list of backtesting reports. You can generate files and download the backtesting reports locally. You can also click the gear on the backtest chart interface to customize some conditions of the backtest, including: initial capital amount, currency type, percentage of each order placed, amount of pyramid additions, commission fees, slippage, etc. configuration. Note: The configuration in the interface dialog overrides the same configuration implemented by the code in the backtest script.
How to output charts:
The first layer: "{Sextan} Your Indicator Source", the output of this script is the pulse value of yellow and purple, yellow +1 means buy, purple -1 means sell.
The second layer: PINEv4 Sextans Backtest Framework". The output of this script is a bit complicated. After all, it is the entire trading system with a lot of information:
1. Blue and red arrows. The blue upward arrow indicates long position, the red downward arrow indicates short position, and the horizontal bar at the end of the purple arrow indicates take profit or stop loss exit.
2. Red and green lines. This is the holding cost line of the strategy, green represents the cost of holding a long position, and red represents the cost of holding a short position. The cost line is a continuous solid line and the price action is relatively close.
3. Green and yellow long take profit and stop loss area and green and yellow long take profit and stop loss fork. Once a long position is held, there is a conditional order for take profit and stop loss. The green horizontal line is the long take profit ratio line, and the yellow is the long stop loss ratio line; the green cross indicates the long take profit price, and the yellow cross indicates the long position. Stop loss price. It's worth noting that the prongs and wires don't necessarily go together. Because of the optimization of the algorithm, for a strong market, the take profit will occur after breaking the take profit line, and the profit will not be taken until the price falls.
4. The purple and red short take profit and stop loss area and the purple red short stop loss fork. Once a short position is held, there will be a take profit and stop loss conditional order, the red is the short take profit ratio line, and the purple is the short stop loss ratio line; the red cross indicates the short take profit price, and the purple cross indicates the short stop loss price.
5. In addition to the above signs, there are also text and numbers indicating the profit and loss values of long and short positions. "L" means long; "S" means short; "XL" means close long; "XS" means close short.
TradingView Strategy Tester Panel:
The overview graph is an intuitive graph that plots the blue (gain) and red (loss) curves of all backtest periods together, and notes: the absolute value and percentage of net profit, the number of all closed positions, the winning percentage, the profit factor, The maximum trading loss, the absolute value and ratio of the average trading profit and loss, and the average number of K-lines held in all trades.
Another is the performance summary. This is to display all long and short statistical indicators of backtesting in the form of a list, such as: net profit, gross profit, Sharpe ratio, maximum position, commission, times of profit and loss, etc.
Finally, the transaction list is a table indexed by the transaction serial number, showing the signal direction, date and time, price, profit and loss, accumulated profit and loss, maximum transaction profit, transaction loss and other values.
Remarks
Finally, I will explain that this is just the beginning of this model. I will continue to optimize the trading system of the second layer. Various optimization feedback and suggestions are welcome. For valuable feedback, I am willing to provide some L4/L5 technical indicators as rewards for free subscription rights.

EMA MTF PlusI like trading the 1 minute and 3 minutes time-frames. I'm what is commonly called a "scalper". Long term investments yes, I have some, but for trading, I don't have neither the time,
nor the patience to wait hours or days for my trade to be complete.
This doesn't mean I discount the higher time-frames, no, I actually rely heavily on them. I found that EMAs do a decent job as support/resistance, sometimes to a tick level of precision. And this is important for a 1 minute trader.
As such, I made this script that tracks the higher time-frames EMAs and displays the last value as a line.
I do not need the whole EMA, I'm not interested in crossovers or crossunders, these are anyway late signals for me.
What's with the triangles? These are local tops/bottoms , candles that have a have decent size of the wick. These tops and bottoms are by no means "final", they are merely a rejection at certain levels of price. Due to markets complexities (and human erratic behaviors hehe) these levels could be breached at the very next candle. For a more "final" version (nothing is really final but..) I added Schaff Trend Cycle as filter, so a triangle will pop only when a trend is mature enough ( STC with a value near 0 or near 100).
Colored bars. When the body of the candle is big, it shows strength. Strong bars tend to have follow through, especially when breaking key levels. The script looks at the body of the candle and compares it with ATR (Average True Range), if it's at least 0.8 of ATR it changes the bar color to yellow (bull candles) or fuchsia(bear candles).
Range identifier. This code is copied from Lazy Bear (if there are any issues please let me know), it's very useful in conjunction with colored bars.
I look for breakout candles that go outside of the range as a signal for a trade.
There are many ways in which this script can be useful, like trading mean reversions or momentum trades (breakouts) or simply trend following trades.
I hope you guys find it useful, you can play with default values and change them as you like, these are what I found to be working best for me and my trading universe (mostly crypto).
Special thanks for the original work of:
LazyBear
everget
Jim8080

Supertraders ATR-RangeThis script calculates the ATR 5 periods daily of previous day and various percentages (5%, 7,5% and 10%) of it that we use to evaluate a possibility to try a break-in of a level. This percentages are expressed in points, ticks and a value in dollars for every contract.
Questo script calcola l'ATR daily 5 periodi del giorno precedente. Calcola anche varie percentuali di esso, in particolare 5%, 7,5% e 10%, utily per verificare lo sforamento in caso di break-in di un livello. Questi valori sono espressi in punti, ticks e valore in dollaro per contratto.

Hull MA TimeFrame CrossOverHello traders,
Although this strategy is configured on BTCUSDT , with a changing of settings, it can be used on any trading instrument.
Here it is seen, on the 2 hour chart. With Trading Fees included in result (adjust to suit your exchange fees).
The candle crossover is set to Daily timeframe.
That means that the Candle crossover is going to see if todays price is higher than yesterdays price.
If user sets this to 4 hour timeframe, the candle crossover would be when price is higher than the the price 4 hours ago...
The rest is simple, a moving average to detect direction, and an ATR StopLoss (if activated).
There is StopLoss and Take Profit settings which work by percentage.
The periods of the moving average and the ATR can be adjusted, as can the TP % and SL %.
The price is taken from the CLOSE or the OPEN or OHLC4 etc... which can be changed in the settings. OPEN is recommended to avoid repainting.
The moving average also has selectable types (ALMA,SMA,EMA,WMA,HMA)
So if the Price is above the Moving average, and the moving average is above the alternate timeframe value, then a buy is activated
if the Price is below the Moving average, and the moving average is below the alternate timeframe value, then a sell is activated
if OPEN is selected as Price source, then the alternate timeframe value would be the OPEN of the alternate timeframes candle.
the values are all plotted on chart so user can see what is happening when what crosses over what, and then what changes when settings are adjusted.
Have FuN!
if this strategy brings you the epik win......
.... dont forget about me
seaside420 ❤️

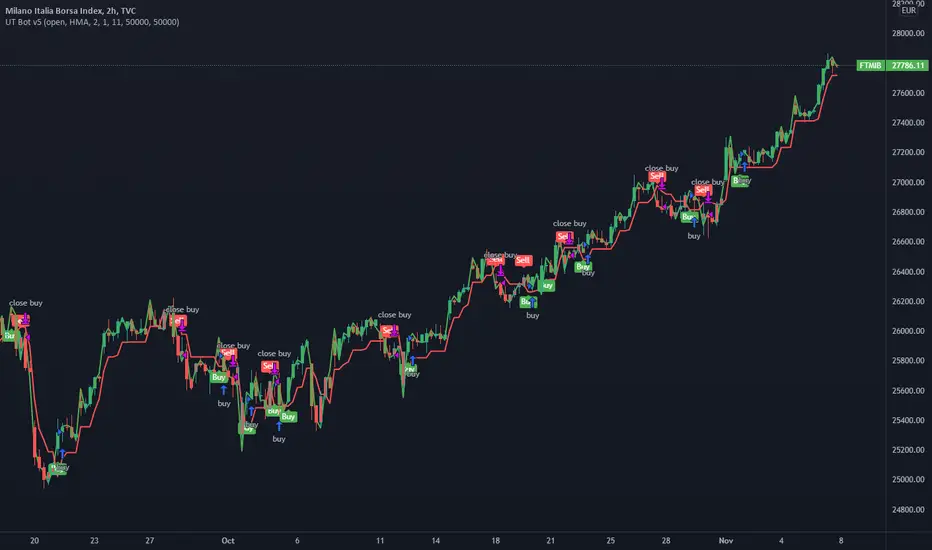
UT Bot v5This is an update by request, on someone elses strategy! well more of an edit, but also update from pine v4 to pine v5.
//CREDITS to HPotter for the orginal code. The guy trying to sell this as his own is a scammer lol.
//Edited and converted to @version=5 by SeaSide420 for Paperina
The UT Bot v5 is Movinging average (the MA) vs ATR (the ATR is in the form intended for use as trailing stop loss (ATR_TSL))
Entry logic:
buy = the MA > ATR_TSL and Price > ATR_TSL
sell = the MA < ATR_TSL and Price < ATR_TSL
The Moving average type can be changed in the settings:
options = "SMA", "EMA", "WMA", "HMA"]
the edits i made were:
convert to v5
Add TP and SL
Add Buy only or Sell only option
Add MA type option
Add price source option
Draw MA and ATR_TSL on-chart
DI Crossing Daily Straregy HulkTradingSimple strategy based on crossing DI+ and DI- and Average True Range.
Long entry when DI+ crossover DI-
Short entry when DI+ crossunder DI-
Stop Loss and Take Profits based on Average True Range.
Default values are 1*ATR(14) for stop loss and 2*ATR(14) for Take Profit.
Risk reward 1 to 2 ratio.
Recommended default values, but you can change it if you want.
Recommended timeframe - 1D.
Script was tested on BTCUSDT pair and have a 2.4 profit factor.

Timeweighted Colored VWAP with SlopeHey, traders!
This script calculates the VWAP's change rate against ATR in a number of k-lines. It controls the VWAP line's color based on the average change rate, and it changes its color in a time-weighted way.
1. Calculating vwapValue's rate of change
2. Controlling Line's color based on the average change rate against ATR
3. Calculating average change rate in the past k-lines
K线的数量:计算多少根K线的VWAP值的变化率的平均值,相当于用K线的数量来时间加权
变化率阈值:线条颜色变化的阈值,VWAP值的变化率比这个大或者小时改变颜色,否则延续原来的颜色
Good luck with your trading!

SD - Average True Range v5 - DoubleSD - Average True Range - Daily Weekly Monthly Yearly v5
It gives ATR intervals as 4 hours, daily, weekly, monthly and yearly. The expectation is to fill the ATR targets within the specified ranges. It can be used to determine target points on charts with a clear direction on the train.
Unlike the previous version, it is provided to use 2 different periods in the same indicator.
Note: Developed based on the source codes of the original SD ADR indicator.

PMax on Rsi w/T3 *Strategy*Profit Maximizer Indicator on RSI with Tillson T3 Moving Average:
PMax uses ATR calculation inside, for this reason users couldn't manage to use PMax on RSI because RSI indicator doesn't have High and Low values in bars, but ATR needs that values. So I personally calculate RSI in a different way to have High and Low values of RSI wrt price bars.
IMPORTANT:
Because of the sudden movements and divergences on RSI , this indicator must firstly optimized for the charts before using. Optimization can be held by users for the meaningful parameters for each chart.
3 parameters are critical when optimizing:
First: Multiplier
Second: Tillson T3 Length
Third: T3 Volume Factor
Says, Kıvanç Özbilgiç. Here's the strategy version for you to backtest & optimize properly.
Enjoy.

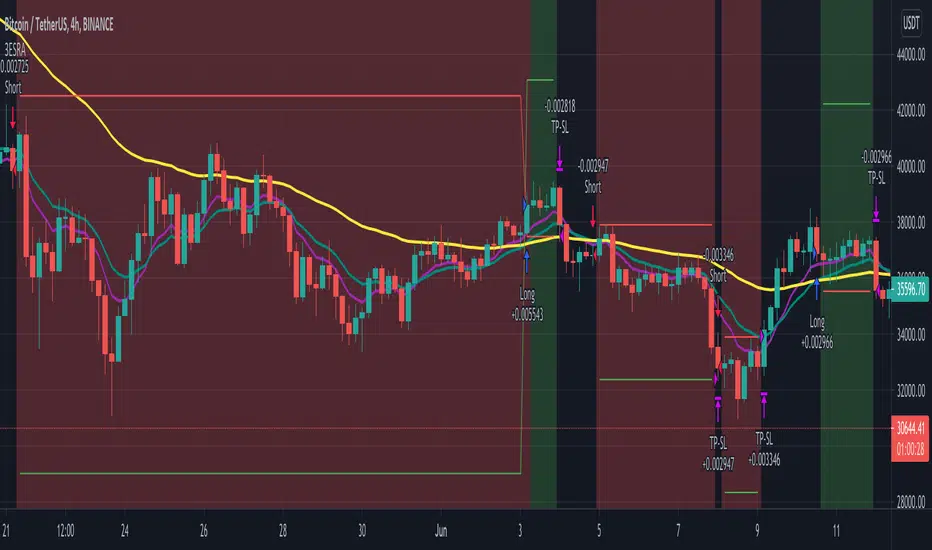
3 EMA + Stochastic RSI + ATR 3ESRA
v0.2a
Coded by Vaida Bogdan
3ESRA consists of a 3 EMA cross + a close above (for longs) the quickest EMA
or below (for shorts). Note that I've deactivated the RSI Cross Over/Under
(you can modify the code and activate it). The strategy also uses a stop loss
that's at 1 ATR distance from the entry price and a take profit that's at
4 times the ATR distance from the entry price.
EMA based ATR Stops-If the FAST EMA is ABOVE the SLOW EMA then the ATR Stops will be placed x amount BELOW the lows
-If the FAST EMA is BELOW the SLOW EMA , then the ATR Stops will be placed x amount ABOVE the highs
-If the fast ema is above the slow ema but they are sloping down, their colours will turn to a shade of blue
-If the fast ema is below the slow ema but they are sloping up, their colours will turn to a lighter shade of blue
-I added an extra ema but it is off by default
TAYOR!

HMA_ATR StrategyATR with HMA experimental minimalist bot for ETHBTC .
A strategy for use by Automated Algorithm systems.
Different from normal ATR as it uses HMA for smoothing.
Example settings result shown here on chart include commission 0.5%

MTF atr_channelThis is the Multi TimeFrame Version of previous atr channel, which uses the ATR percent(atr%) instead of the 2% fixed deviation for calclation of bollinger bands.

[JL] ATR LabelsJust need to see ATR values when I made Renko script. So I make this script.
I like number 5 so I use 5 to timeframe.
Calculate ATR for the following:
- Monthly
- Weekly
- Daily
- 5-Hour
- 1-Hour
- 12-Min
Label default displayed on right side and middle of 50 bars.

[kai]mATRThis indicator is for calculating the volatility of any interval
mTR (green line): TR is extended to calculate multiple bars at once with magnification setting.
mATR (red line): ATR is extended to calculate multiple bars at once with magnification setting.
dev (blue line): standard deviation
If you turn on "divide source" in the settings, it will be the price volatility.
dev will be the same as BBW
このインジケーターは任意の区間のボラリティを計算するための物です
mTR(緑線) : TRを倍率設定で複数のバーをまとめて計算する用に拡張したものです
mATR(赤線) : ATRを倍率設定で複数のバーをまとめて計算する用に拡張したものです
dev(青線) : 標準偏差
設定で「divide source 価格変動率」をONにすると価格変動率になります
devはBBWと同じになります

Reversal with Bollinger Bands + RSI + ADX + ATR (Upgraded)Hi,
Welcome to my 4th script.
Someone asked me some questions about the Bollinger Band strategy I previously published. When I went back to my published script I couldn't help myself but simply try and make it better. Which I did.
Since I've published that script, I've gained much more knowledge about how Pinescript functions. As well as gaining more and more knowledge about how the markets are structered etc.
In this reversal script we use 4 indicators to determine good entry signals, we determine whether the market is ranging or trending and we still only want to take trades in the direction of the "trend".
Bollinger Bands are used for our entry signal. When price hits either side of the band, we wait for a reverse candlestick before we enter a position.
RSI is used to determine if we're in a trending market or in a ranging market. You can adjust the values in the inputs. You can determine the minimum RSI value and the maximum RSI value.
ADX is used the same way as RSI, you can adjust the value in the inputs. You can determine the minimum ADX value.
Last but not least we use two EMA's, a 200 EMA and 100 EMA. Both are adjustable through the inputs. I used two EMA's because I noticed when using this strategy that we'd enter a new position often after having a bad trade. Using two EMA's might clean up some signals, in my case with EUR/USD on a 15m timeframe, it didn't clean up enough signals.
All the default values are pretty decent but might require some finetuning on a certain instrument. Don't overfit the strategy though, that'll only give you bad signals in the future.
Then we are off to our exit signals.
Initially I wanted to incorporate my previous Bollinger Band exit signals as well, but it was too much of a hassle to make the script work as intended so I left it out. If you want to use those exit signals, just find my other script.
When we're in a position and price crosses the opposite band, we wait for a reverse candlestick before we exit the position.
Additionally we want our losses to be as small as possible, so we use RSI to signal us when the market is, or starts to, trend against us. This is where you use the minimum and maximum exit values. So when RSI crosses over or under that value, it'll exit the position.
Furthermore, we use the ATR indicator to set our stop loss, which is pretty basic stuff. You can adjust the ATR multiplier in the inputs. Disabling "Use Trailing Stop?" is really inadvisable unless you know this script inside out as your only exit signals will be opposite Bollinger Band Cross and RSI overbought / oversold areas.
