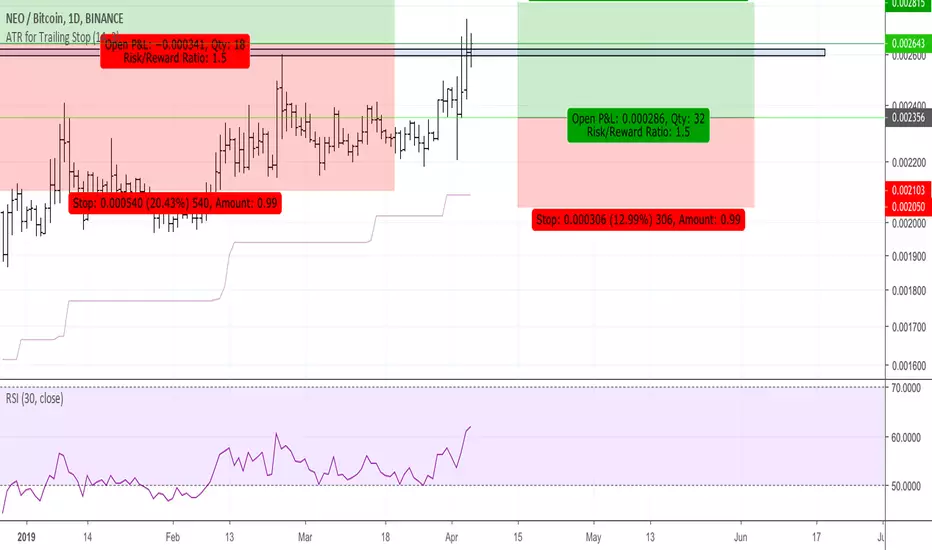
ATR for Trailing StopAn ATR (Average True Range) can be used to position a trailing stop
In this script, the true range of today is calculated based on the low of yesterday in order to be more stable.
It only goes up, as a trailing stop should do.
It only goes down when the trailing stop is reached by the price.
Cari dalam skrip untuk "ATR"

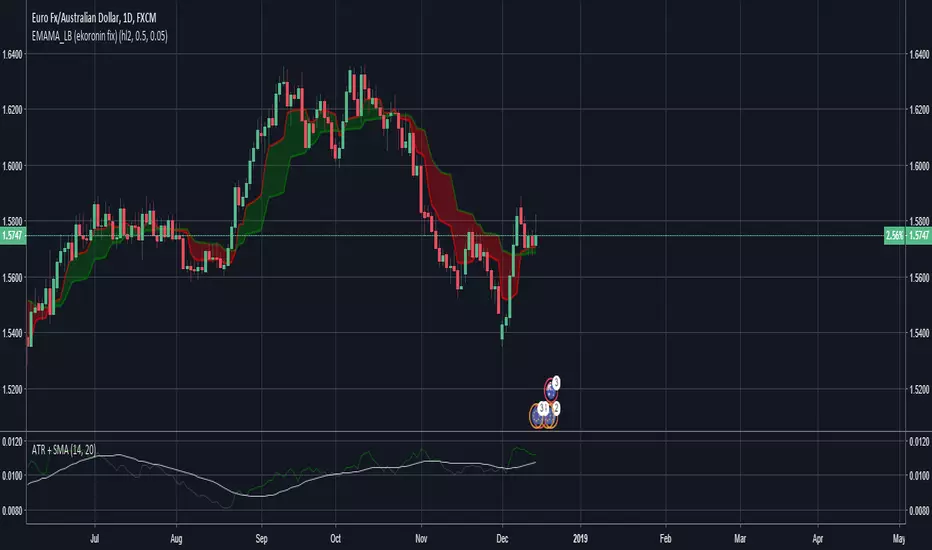
ATR for Trailing StopThe calculation of this ATR is based on the low of yesterday in order to not change continuously during the day.
You can use this indicator to create a trailing stop taking into account volatility on the nATRPeriod previous days.
It also always go up as a trailing stop should. It only goes down the price reaches the trailing stop.

ATR+VWAP Alert//These signals mostly consist of crossovers between a 13 VWMA and a 62 VWMA. I've found these two moving averages to be quite special in their ability to
//recognize a quick trend using volume data. The VWAP is used in the alert system as well, to give some perspective on which direction we are looking to take. We
//are also using ATR. We only take trades when the ATR is on the move, meaning we have a chance to catch a volatile move! Finally, we use RSI to help weed out bad
//trades. We only take 'longs' with bullish readings from RSI, and we only take 'shorts' with bearish readings from RSI. These alerts are fantastic for catching quick intraday
//trades in either direction. I recommend using a small 'take profit' target rather than using an exit indicator. These trades can move 20-30 pips and reverse just as quickly. Good luck!
//How To Use:
//When the alert system is added to the chart, you will notice up/down symbols appear at various locations. For bullish alerts, right click an 'Up' symbol and choose 'Add Alert on VWap & ATR..'
//There are two condition options. 'Long/short', and right below that 'Buy-Signal/Sell-Signal'. Choose 'long' and 'Buy-Signal'. At options, choose 'Once Per Bar Close'. Design your alert, and you're good to go.
//For bearish signals, find a 'down' signal on the chart. Right click and follow the same process, except choosing 'short/Sell-Signal' conditions.
Tips:
Use VWAP as a stop-loss. If a candle closes below/above the VWAP in the direction against you.. get out of the trade. The losses will be minimal and few compared to the wins. Use discretion and trade carefully. This works great with crypto. Invent your own exit. If you come up with a clever exit, please share!
You can contact me at my Discord!
discord.gg

ATR 0.5 & 0.7 rangesOur research showed that securities usually stay in their ATR. It is about 4.8% days when security is goes out of ATR.
So we are using this feature in our trading, when security is out of their 70% of ATR we are looking for signals to trade backward.
This indicator could show you when bars are close to ATR.
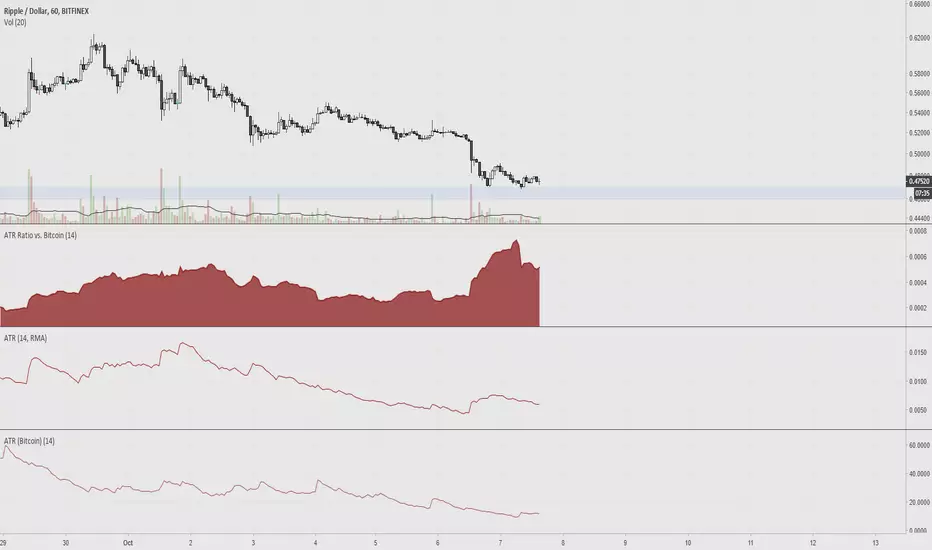
ATR Ratio vs. BitcoinAverage True Range is used to determine if a ticker's trading range is widening or narrowing, which is helpful for finding the trend or to use as a stop loss. The idea of this indicator is to compare the ATR of altcoins versus bitcoin, since volatility is low.

Projected high moving stocks based on daily ATRMay be used to find out stocks that have a "relatively" high ATR thereby signifying that it is susceptible to similar moves in the future.

T3 ATR [DCAUT]█ T3 ATR
📊 ORIGINALITY & INNOVATION
The T3 ATR indicator represents an important enhancement to the traditional Average True Range (ATR) indicator by incorporating the T3 (Tilson Triple Exponential Moving Average) smoothing algorithm. While standard ATR uses fixed RMA (Running Moving Average) smoothing, T3 ATR introduces a configurable volume factor parameter that allows traders to adjust the smoothing characteristics from highly responsive to heavily smoothed output.
This innovation addresses a fundamental limitation of traditional ATR: the inability to adapt smoothing behavior without changing the calculation period. With T3 ATR, traders can maintain a consistent ATR period while adjusting the responsiveness through the volume factor, making the indicator adaptable to different trading styles, market conditions, and timeframes through a single unified implementation.
The T3 algorithm's triple exponential smoothing with volume factor control provides improved signal quality by reducing noise while maintaining better responsiveness compared to traditional smoothing methods. This makes T3 ATR particularly valuable for traders who need to adapt their volatility measurement approach to varying market conditions without switching between multiple indicator configurations.
📐 MATHEMATICAL FOUNDATION
The T3 ATR calculation process involves two distinct stages:
Stage 1: True Range Calculation
The True Range (TR) is calculated using the standard formula:
TR = max(high - low, |high - close |, |low - close |)
This captures the greatest of the current bar's range, the gap from the previous close to the current high, or the gap from the previous close to the current low, providing a comprehensive measure of price movement that accounts for gaps and limit moves.
Stage 2: T3 Smoothing Application
The True Range values are then smoothed using the T3 algorithm, which applies six exponential moving averages in succession:
First Layer: e1 = EMA(TR, period), e2 = EMA(e1, period)
Second Layer: e3 = EMA(e2, period), e4 = EMA(e3, period)
Third Layer: e5 = EMA(e4, period), e6 = EMA(e5, period)
Final Calculation: T3 = c1×e6 + c2×e5 + c3×e4 + c4×e3
The coefficients (c1, c2, c3, c4) are derived from the volume factor (VF) parameter:
a = VF / 2
c1 = -a³
c2 = 3a² + 3a³
c3 = -6a² - 3a - 3a³
c4 = 1 + 3a + a³ + 3a²
The volume factor parameter (0.0 to 1.0) controls the weighting of these coefficients, directly affecting the balance between responsiveness and smoothness:
Lower VF values (approaching 0.0): Coefficients favor recent data, resulting in faster response to volatility changes with minimal lag but potentially more noise
Higher VF values (approaching 1.0): Coefficients distribute weight more evenly across the smoothing layers, producing smoother output with reduced noise but slightly increased lag
📊 COMPREHENSIVE SIGNAL ANALYSIS
Volatility Level Interpretation:
High Absolute Values: Indicate strong price movements and elevated market activity, suggesting larger position risks and wider stop-loss requirements, often associated with trending markets or significant news events
Low Absolute Values: Indicate subdued price movements and quiet market conditions, suggesting smaller position risks and tighter stop-loss opportunities, often associated with consolidation phases or low-volume periods
Rapid Increases: Sharp spikes in T3 ATR often signal the beginning of significant price moves or market regime changes, providing early warning of increased trading risk
Sustained High Levels: Extended periods of elevated T3 ATR indicate sustained trending conditions with persistent volatility, suitable for trend-following strategies
Sustained Low Levels: Extended periods of low T3 ATR indicate range-bound conditions with suppressed volatility, suitable for mean-reversion strategies
Volume Factor Impact on Signals:
Low VF Settings (0.0-0.3): Produce responsive signals that quickly capture volatility changes, suitable for short-term trading but may generate more frequent color changes during minor fluctuations
Medium VF Settings (0.4-0.7): Provide balanced signal quality with moderate responsiveness, filtering out minor noise while capturing significant volatility changes, suitable for swing trading
High VF Settings (0.8-1.0): Generate smooth, stable signals that filter out most noise and focus on major volatility trends, suitable for position trading and long-term analysis
🎯 STRATEGIC APPLICATIONS
Position Sizing Strategy:
Determine your risk per trade (e.g., 1% of account capital - adjust based on your risk tolerance and experience)
Decide your stop-loss distance multiplier (e.g., 2.0x T3 ATR - this varies by market and strategy, test different values)
Calculate stop-loss distance: Stop Distance = Multiplier × Current T3 ATR
Calculate position size: Position Size = (Account × Risk %) / Stop Distance
Example: $10,000 account, 1% risk, T3 ATR = 50 points, 2x multiplier → Position Size = ($10,000 × 0.01) / (2 × 50) = $100 / 100 points = 1 unit per point
Important: The ATR multiplier (1.5x - 3.0x) should be determined through backtesting for your specific instrument and strategy - using inappropriate multipliers may result in stops that are too tight (frequent stop-outs) or too wide (excessive losses)
Adjust the volume factor to match your trading style: lower VF for responsive stop distances in short-term trading, higher VF for stable stop distances in position trading
Dynamic Stop-Loss Placement:
Determine your risk tolerance multiplier (typically 1.5x to 3.0x T3 ATR)
For long positions: Set stop-loss at entry price minus (multiplier × current T3 ATR value)
For short positions: Set stop-loss at entry price plus (multiplier × current T3 ATR value)
Trail stop-losses by recalculating based on current T3 ATR as the trade progresses
Adjust the volume factor based on desired stop-loss stability: higher VF for less frequent adjustments, lower VF for more adaptive stops
Market Regime Identification:
Calculate a reference volatility level using a longer-period moving average of T3 ATR (e.g., 50-period SMA)
High Volatility Regime: Current T3 ATR significantly above reference (e.g., 120%+) - favor trend-following strategies, breakout trades, and wider targets
Normal Volatility Regime: Current T3 ATR near reference (e.g., 80-120%) - employ standard trading strategies appropriate for prevailing market structure
Low Volatility Regime: Current T3 ATR significantly below reference (e.g., <80%) - favor mean-reversion strategies, range trading, and prepare for potential volatility expansion
Monitor T3 ATR trend direction and compare current values to recent history to identify regime transitions early
Risk Management Implementation:
Establish your maximum portfolio heat (total risk across all positions, typically 2-6% of capital)
For each position: Calculate position size using the formula Position Size = (Account × Individual Risk %) / (ATR Multiplier × Current T3 ATR)
When T3 ATR increases: Position sizes automatically decrease (same risk %, larger stop distance = smaller position)
When T3 ATR decreases: Position sizes automatically increase (same risk %, smaller stop distance = larger position)
This approach maintains constant dollar risk per trade regardless of market volatility changes
Use consistent volume factor settings across all positions to ensure uniform risk measurement
📋 DETAILED PARAMETER CONFIGURATION
ATR Length Parameter:
Default Setting: 14 periods
This is the standard ATR calculation period established by Welles Wilder, providing balanced volatility measurement that captures both short-term fluctuations and medium-term trends across most markets and timeframes
Selection Principles:
Shorter periods increase sensitivity to recent volatility changes and respond faster to market shifts, but may produce less stable readings
Longer periods emphasize sustained volatility trends and filter out short-term noise, but respond more slowly to genuine regime changes
The optimal period depends on your holding time, trading frequency, and the typical volatility cycle of your instrument
Consider the timeframe you trade: Intraday traders typically use shorter periods, swing traders use intermediate periods, position traders use longer periods
Practical Approach:
Start with the default 14 periods and observe how well it captures volatility patterns relevant to your trading decisions
If ATR seems too reactive to minor price movements: Increase the period until volatility readings better reflect meaningful market changes
If ATR lags behind obvious volatility shifts that affect your trades: Decrease the period for faster response
Match the period roughly to your typical holding time - if you hold positions for N bars, consider ATR periods in a similar range
Test different periods using historical data for your specific instrument and strategy before committing to live trading
T3 Volume Factor Parameter:
Default Setting: 0.7
This setting provides a reasonable balance between responsiveness and smoothness for most market conditions and trading styles
Understanding the Volume Factor:
Lower values (closer to 0.0) reduce smoothing, allowing T3 ATR to respond more quickly to volatility changes but with less noise filtering
Higher values (closer to 1.0) increase smoothing, producing more stable readings that focus on sustained volatility trends but respond more slowly
The trade-off is between immediacy and stability - there is no universally optimal setting
Selection Principles:
Match to your decision speed: If you need to react quickly to volatility changes for entries/exits, use lower VF; if you're making longer-term risk assessments, use higher VF
Match to market character: Noisier, choppier markets may benefit from higher VF for clearer signals; cleaner trending markets may work well with lower VF for faster response
Match to your preference: Some traders prefer responsive indicators even with occasional false signals, others prefer stable indicators even with some delay
Practical Adjustment Guidelines:
Start with default 0.7 and observe how T3 ATR behavior aligns with your trading needs over multiple sessions
If readings seem too unstable or noisy for your decisions: Try increasing VF toward 0.9-1.0 for heavier smoothing
If the indicator lags too much behind volatility changes you care about: Try decreasing VF toward 0.3-0.5 for faster response
Make meaningful adjustments (0.2-0.3 changes) rather than small increments - subtle differences are often imperceptible in practice
Test adjustments in simulation or paper trading before applying to live positions
📈 PERFORMANCE ANALYSIS & COMPETITIVE ADVANTAGES
Responsiveness Characteristics:
The T3 smoothing algorithm provides improved responsiveness compared to traditional RMA smoothing used in standard ATR. The triple exponential design with volume factor control allows the indicator to respond more quickly to genuine volatility changes while maintaining the ability to filter noise through appropriate VF settings. This results in earlier detection of volatility regime changes compared to standard ATR, particularly valuable for risk management and position sizing adjustments.
Signal Stability:
Unlike simple smoothing methods that may produce erratic signals during transitional periods, T3 ATR's multi-layer exponential smoothing provides more stable signal progression. The volume factor parameter allows traders to tune signal stability to their preference, with higher VF settings producing remarkably smooth volatility profiles that help avoid overreaction to temporary market fluctuations.
Comparison with Standard ATR:
Adaptability: T3 ATR allows adjustment of smoothing characteristics through the volume factor without changing the ATR period, whereas standard ATR requires changing the period length to alter responsiveness, potentially affecting the fundamental volatility measurement
Lag Reduction: At lower volume factor settings, T3 ATR responds more quickly to volatility changes than standard ATR with equivalent periods, providing earlier signals for risk management adjustments
Noise Filtering: At higher volume factor settings, T3 ATR provides superior noise filtering compared to standard ATR, producing cleaner signals for long-term analysis without sacrificing volatility measurement accuracy
Flexibility: A single T3 ATR configuration can serve multiple trading styles by adjusting only the volume factor, while standard ATR typically requires multiple instances with different periods for different trading applications
Suitable Use Cases:
T3 ATR is well-suited for the following scenarios:
Dynamic Risk Management: When position sizing and stop-loss placement need to adapt quickly to changing volatility conditions
Multi-Style Trading: When a single volatility indicator must serve different trading approaches (day trading, swing trading, position trading)
Volatile Markets: When standard ATR produces too many false volatility signals during choppy conditions
Systematic Trading: When algorithmic systems require a single, configurable volatility input that can be optimized for different instruments
Market Regime Analysis: When clear identification of volatility expansion and contraction phases is critical for strategy selection
Known Limitations:
Like all technical indicators, T3 ATR has limitations that users should understand:
Historical Nature: T3 ATR is calculated from historical price data and cannot predict future volatility with certainty
Smoothing Trade-offs: The volume factor setting involves a trade-off between responsiveness and smoothness - no single setting is optimal for all market conditions
Extreme Events: During unprecedented market events or gaps, T3 ATR may not immediately reflect the full scope of volatility until sufficient data is processed
Relative Measurement: T3 ATR values are most meaningful in relative context (compared to recent history) rather than as absolute thresholds
Market Context Required: T3 ATR measures volatility magnitude but does not indicate price direction or trend quality - it should be used in conjunction with directional analysis
Performance Expectations:
T3 ATR is designed to help traders measure and adapt to changing market volatility conditions. When properly configured and applied:
It can help reduce position risk during volatile periods through appropriate position sizing
It can help identify optimal times for more aggressive position sizing during stable periods
It can improve stop-loss placement by adapting to current market conditions
It can assist in strategy selection by identifying volatility regimes
However, volatility measurement alone does not guarantee profitable trading. T3 ATR should be integrated into a comprehensive trading approach that includes directional analysis, proper risk management, and sound trading psychology.
USAGE NOTES
This indicator is designed for technical analysis and educational purposes. T3 ATR provides adaptive volatility measurement but has limitations and should not be used as the sole basis for trading decisions. The indicator measures historical volatility patterns, and past volatility characteristics do not guarantee future volatility behavior. Market conditions can change rapidly, and extreme events may produce volatility readings that fall outside historical norms.
Traders should combine T3 ATR with directional analysis tools, support/resistance analysis, and other technical indicators to form a complete trading strategy. Proper backtesting and forward testing with appropriate risk management is essential before applying T3 ATR-based strategies to live trading. The volume factor parameter should be optimized for specific instruments and trading styles through careful testing rather than assuming default settings are optimal for all applications.

DTR & ATR
Description
This ATR and DTR label is update of Existing Label provided by © ssksubam
Please See Notes on original Script Here :
Original Code is not mine but I have done few code changes which I believe will help everyone who are looking to add more labels together and save space on the chart
ATR & DTR Script is very helpful for Day Traders as I will explain in detail bellow
Following are changes I have incorporated
Previous Label took more space on the charts with Header and Footer.
I removed the Header and moved both DTR vs ATR descriptions on the same line, saving space on the chart.
I updated the code to remove => signs, which are self-explanatory as I will explain below.
I made the label in 1 single compact line for maximum space efficiency and aesthetics.
These changes improve the content's clarity and conciseness while optimizing space on the charts. If you have any further requests or need additional assistance, feel free to let me know!
What Does DTR Signify?
Stock ATR stands for Average True Range, which is a technical indicator used in trading and investment analysis. The Average True Range measures the volatility of a stock over a given period of time. It provides insights into the price movement and potential price ranges of the stock.
The ATR is calculated as the average of the true ranges over a specific number of periods. The true range is the greatest of the following three values:
The difference between the current high and the current low.
The absolute value of the difference between the current high and the previous close.
The absolute value of the difference between the current low and the previous close.
Traders and investors use ATR to assess the potential risk and reward of a stock. A higher ATR value indicates higher volatility and larger price swings, while a lower ATR value suggests lower volatility and smaller price movements. By understanding the ATR, traders can set appropriate stop-loss levels and make informed decisions about position sizing and risk management.
It's important to note that the ATR is not a directional indicator like moving averages or oscillators. Instead, it provides a measure of volatility, helping traders adapt their strategies to suit the current market conditions.
What Does ATR Signify?
The Average True Range (ATR) signifies the level of volatility or price variability in a particular financial asset, such as a stock, currency pair, or commodity, over a specific period of time. It provides valuable information to traders and investors regarding the potential risk and reward associated with the asset.
Here are the key significances of ATR:
Volatility Measurement: ATR measures the average price range between high and low prices over a specified timeframe. Higher ATR values indicate greater volatility, while lower values suggest lower volatility. Traders use this information to gauge the potential price movements and adjust their strategies accordingly.
Risk Assessment: A higher ATR value implies larger price swings, indicating increased market uncertainty and risk. Traders can use ATR to set appropriate stop-loss levels and manage risk by adjusting position sizes based on the current volatility.
Trend Strength: ATR can also be used to assess the strength of a trend. In an uptrend or downtrend, ATR tends to increase, indicating a more powerful price movement. Conversely, a declining ATR might signify a weakening trend or a consolidation period.
Range-Bound Market Identification: In a range-bound or sideways market, the ATR value tends to be relatively low, reflecting the lack of significant price movements. This information can be helpful for range-trading strategies.
Volatility Breakouts: Traders often use ATR to identify potential breakouts from consolidation patterns. When the ATR value expands significantly, it may indicate the beginning of a new trend or a breakout move.
Comparison between Assets: ATR allows traders to compare the volatility of different
How to use DTR & ATR for Trading
Using Average True Range (ATR) and Daily Trading Range (DTR) can be beneficial for day trading to assess potential price movements, manage risk, and identify trading opportunities. Here's how you can use both indicators effectively:
Calculate ATR and DTR: First, calculate the ATR and DTR values for the asset you are interested in trading. ATR is the average of true ranges over a specified period (e.g., 14 days), while DTR is the difference between the high and low prices of a single trading day.
Assess Volatility: Compare the ATR and DTR values to understand the current volatility of the asset. Higher values indicate increased volatility, while lower values suggest reduced volatility.
Setting Stop-Loss: Use ATR to set appropriate stop-loss levels. For example, you might decide to set your stop-loss a certain number of ATR points away from your entry point. This approach allows you to factor in market volatility when determining your risk tolerance.
Identify Trading Range: Analyze DTR to determine the typical daily price range of the asset. This information can help you identify potential support and resistance levels, which are essential for day trading strategies such as breakout or range trading.
Breakout Strategies: ATR can assist in identifying potential breakout opportunities. When ATR values increase significantly, it suggests an expansion in volatility, which may indicate an upcoming breakout from a trading range. Look for breakouts above resistance or below support levels with higher than usual ATR values.
Scalping Strategies: For scalping strategies, where traders aim to profit from small price movements within a single trading session, knowing the typical DTR can help set reasonable profit targets and stop-loss levels.
Confirming Trend Strength: In day trading, you may encounter short-term trends. Use ATR to assess the strength of these trends. If the ATR is rising, it suggests a strong trend, while a declining ATR may indicate a weakening trend or potential reversal.
Risk Management: Both ATR and DTR can aid in risk management. Determine your position size based on the current ATR value to align it with your risk tolerance. Additionally, understanding the DTR can help you avoid overtrading during periods of low volatility.
Combine with Other Indicators: ATR and DTR work well when used in conjunction with other technical indicators like moving averages, Bollinger Bands, or RSI. Combining multiple indicators can provide a mor

ATR Table with Average [filatovlx]ATR indicator with advanced analytics
Description:
The ATR (Average True Range) indicator is a powerful tool for analyzing market volatility. Our indicator not only calculates the classic ATR, but also provides additional metrics that will help traders make more informed decisions. The indicator displays key values in a convenient table, which makes it ideal for trading in any market: stocks, forex, cryptocurrencies and others.
Main functions:
Current ATR value:
Current ATR (Points) — the current ATR value in points. It shows the absolute level of volatility.
Current ATR (%) — the current ATR value as a percentage of the price. It helps to estimate the volatility relative to the current price of an asset.
The ATR value on the previous bar:
ATR 1 Bar Ago (Points) — the ATR value on the previous bar in points. Allows you to compare the current volatility with the previous one.
ATR 1 Bar Ago (%) — the ATR value on the previous bar as a percentage. It is convenient for analyzing changes in volatility
Индикатор ATR с расширенной аналитикой
Описание:
Индикатор ATR (Average True Range) — это мощный инструмент для анализа волатильности рынка. Наш индикатор не только рассчитывает классический ATR, но и предоставляет дополнительные метрики, которые помогут трейдерам принимать более обоснованные решения. Индикатор отображает ключевые значения в удобной таблице, что делает его идеальным для использования в торговле на любых рынках: акции, форекс, криптовалюты и другие.
Основные функции:
Текущее значение ATR:
Current ATR (Points) — текущее значение ATR в пунктах. Показывает абсолютный уровень волатильности.
Current ATR (%) — текущее значение ATR в процентах от цены. Помогает оценить волатильность относительно текущей цены актива.
Значение ATR на предыдущем баре:
ATR 1 Bar Ago (Points) — значение ATR на предыдущем баре в пунктах. Позволяет сравнить текущую волатильность с предыдущей.
ATR 1 Bar Ago (%) — значение ATR на предыдущем баре в процентах. Удобно для анализа изменения волатильности.
Среднее значение ATR за последние 5 баров:
ATR Avg (5 Bars) (Points) — среднее значение ATR за последние 5 баров в пунктах. Показывает сглаженный уровень волатильности.
ATR Avg (5 Bars) (%) — среднее значение ATR за последние 5 баров в процентах. Помогает оценить общий тренд волатильности.
Преимущества индикатора:
Удобство использования: Все ключевые значения выводятся в компактной таблице, что экономит время на анализ.
Гибкость: Возможность настройки периода ATR и длины скользящего среднего под ваши торговые стратегии.
Универсальность: Подходит для любых рынков и таймфреймов.
Наглядность: Процентные значения ATR помогают быстро оценить уровень волатильности относительно цены актива.
Повышение точности: Дополнительные метрики (например, среднее значение ATR) позволяют лучше понимать текущую рыночную ситуацию.
Для кого этот индикатор?
Трейдеры, которые хотят лучше понимать волатильность рынка.
Скальперы и внутридневные трейдеры, которым важно быстро оценивать изменения волатильности.
Инвесторы, которые используют ATR для определения стоп-лоссов и тейк-профитов.
Разработчики торговых стратегий, которым нужны точные данные для тестирования и оптимизации.
Как это работает?
Индикатор автоматически рассчитывает все значения и выводит их в таблицу на графике. Вам не нужно вручную считать или анализировать данные — просто добавьте индикатор на график, и вся информация будет перед вами.

ADR% / ATR / LoD dist. Table - V2ADR% / ATR / LoD Distance Table (V2) + ATR Range Lines is a simple “daily volatility dashboard” that helps you quickly judge how extended a stock is during the day and where “normal” daily movement zones sit relative to price.
It’s designed to help you answer:
“Has this stock already made most of its usual daily move?”
“Am I chasing too late?”
“Where are typical +ATR / −ATR stretch and pullback zones?”
What you’ll see
ADR% (Average Daily Range %)
Shows the stock’s typical daily travel (low → high) as a percentage.
Example: ADR% = 4% means the stock often swings ~4% in a normal day.
ATR (Average True Range)
Shows the stock’s typical daily movement in price units ($ / points).
Example: ATR = 2.50 means it often moves about $2.50 per day.
LoD dist. (Low of Day distance)
Shows how far price is from today’s Low of Day, measured relative to ATR (as a %).
Higher % = more extended away from the day’s low.
Optional: ATR Range Lines (added in this version)
You can enable two guide lines that extend to the right:
ATR Up Line = Price + ATR
ATR Down Line = Price − ATR
These act like volatility guardrails to visualize “typical daily stretch” and “typical pullback” zones.
ATR “Live vs Locked” option (important)
Lock ATR to last completed day (no intraday updates):
ON (Locked): Uses the last completed daily ATR (yesterday’s finished value).
✅ ATR stays constant all day while the market is live.
OFF (Live): ATR can update intraday as today’s daily candle expands.
✅ ATR may change during the session.
Either way, ATR is still based on your chosen ATR Length (lookback period). Locking simply prevents the ATR from drifting intraday.
How to use it (Kullamägi-style principle)
Kristjan Kullamägi’s momentum style emphasizes pressing strength when conditions are right, but also respecting extension and risk/reward. This tool helps you quantify that:
If ADR%/ATR suggests the stock already moved near its usual daily range, chasing can be lower reward.
The ATR lines help you visualize when price is in a “normal stretch zone” vs a better risk area.
Locking ATR gives you stable intraday reference levels for cleaner execution.
Tips
Use ADR% to understand whether there’s likely “room” left in today’s move.
Use LoD dist. to quickly gauge if price is already far from the day’s low (extended).
Use ATR Up/Down Lines as a simple volatility framework for entries, add-ons, and risk planning.
Keep Lock ATR ON if you prefer stable levels throughout the session.
Credits
Original indicator concept & script: ArmerSchlucker
ADR% formula credit: MikeC / TheScrutiniser and GlinckEastwoot
Modifications (V2): TradersPod
Added optional ATR Up/Down lines extending to the right
Added “Lock ATR to last completed day” option for stable intraday ATR reference
Kept the original logic and purpose intact

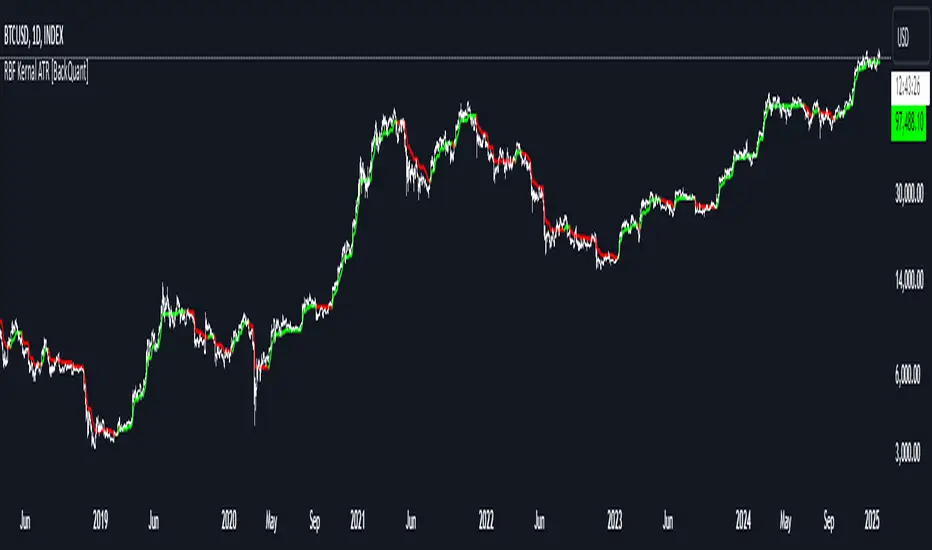
Radial Basis Kernal ATR [BackQuant]Radial Basis Kernel ATR
The Radial Basis Kernel ATR is a trading indicator that combines the classic Average True Range (ATR) with advanced Radial Basis Function (RBF) kernel smoothing . This innovative approach creates a highly adaptive and precise tool for detecting volatility, identifying trends, and providing dynamic support and resistance levels.
With its configurable parameters and ability to adjust to market conditions, this indicator offers traders a robust framework for making informed decisions across various assets and timeframes.
Key Feature: Radial Basis Function Kernel Smoothing
The Radial Basis Function (RBF) kernel is at the heart of this indicator, applying sophisticated mathematical techniques to smooth price data and calculate an enhanced version of ATR. By weighting data points dynamically, the RBF kernel ensures that recent price movements are given appropriate emphasis without overreacting to short-term noise.
The RBF kernel uses a gamma factor to control the degree of smoothing, making it highly adaptable to different asset classes and market conditions:
Gamma Factor Adjustment :
For low-volatility data (e.g., indices), a smaller gamma (0.05–0.1) ensures smoother trends and avoids overly sharp responses.
For high-volatility data (e.g., cryptocurrencies), a larger gamma (0.1–0.2) captures the increased price fluctuations while maintaining stability.
Experimentation is Key : Traders are encouraged to backtest and visually compare different gamma values to find the optimal setting for their specific asset and strategy.
The gamma factor dynamically adjusts based on the variance of the source data, ensuring the indicator remains effective across a wide range of market conditions.
Average True Range (ATR) with Dynamic Bands
The ATR is a widely used volatility measure that captures the degree of price movement over a specific period. This indicator enhances the traditional ATR by integrating the RBF kernel, resulting in a smoothed and adaptive ATR calculation.
Dynamic bands are created around the RBF kernel output using a user-defined ATR factor , offering valuable insights into potential support and resistance zones. These bands expand and contract based on market volatility, providing a visual representation of potential price movement.
Moving Average Confluence
For additional confirmation, the indicator includes the option to overlay a moving average on the smoothed ATR. Traders can choose from several moving average types, such as EMA , SMA , or Hull , and adjust the lookback period to suit their strategy. This feature helps identify broader trends and potential confluence areas, making the indicator even more versatile.
Long and Short Trend Detection
The indicator provides long and short signals based on the directional movement of the smoothed ATR:
Long Signal : Triggered when the ATR crosses above its previous value, indicating bullish momentum.
Short Signal : Triggered when the ATR crosses below its previous value, signaling bearish momentum.
These trend signals are visually highlighted on the chart with green and red bar coloring (optional), providing clear and actionable insights.
Customization Options
The Radial Basis Kernel ATR offers extensive customization options, allowing traders to tailor the indicator to their preferences:
RBF Kernel Settings
Source : Select the price data (e.g., close, high, low) used for the kernel calculation.
Kernel Length : Define the lookback period for the RBF kernel, controlling the smoothing effect.
Gamma Factor : Adjust the smoothing sensitivity, with smaller values for smoother trends and larger values for responsiveness.
ATR Settings
ATR Period : Set the period for ATR calculation, with shorter periods capturing more short-term volatility and longer periods providing a broader view.
ATR Factor : Adjust the scaling of ATR bands for dynamic support and resistance levels.
Confluence Settings
Moving Average Type : Choose from various moving average types for additional trend confirmation.
Moving Average Period : Define the lookback period for the moving average overlay.
Visualization
Trend Coloring : Enable or disable bar coloring based on trend direction (green for long, red for short).
Background Highlighting : Add optional background shading to emphasize long and short trends visually.
Line Width : Customize the thickness of the plotted ATR line for better visibility.
Alerts and Automation
To help traders stay on top of market movements, the indicator includes built-in alerts for trend changes:
Kernel ATR Trend Up : Triggered when the ATR indicates a bullish trend.
Kernel ATR Trend Down : Triggered when the ATR signals a bearish trend.
These alerts ensure traders never miss important opportunities, providing timely notifications directly to their preferred device.
Suggested Gamma Values
The effectiveness of the gamma factor depends on the asset type and the selected kernel length:
Low Volatility Assets (e.g., indices): Use a smaller gamma factor (approximately 0.05–0.1) for smoother trends.
High Volatility Assets (e.g., crypto): Use a larger gamma factor (approximately 0.1–0.2) to capture sharper price movements.
Experimentation : Fine-tune the gamma factor using backtests or visual comparisons to optimize for specific assets and strategies.
Trading Applications
The Radial Basis Kernel ATR is a versatile tool suitable for various trading styles and strategies:
Trend Following : Use the smoothed ATR and dynamic bands to identify and follow trends with confidence.
Reversal Trading : Spot potential reversals by observing interactions with dynamic ATR bands and moving average confluence.
Volatility Analysis : Analyze market volatility to adjust risk management strategies or position sizing.
Final Thoughts
The Radial Basis Kernel ATR combines advanced mathematical techniques with the practical utility of ATR, offering traders a powerful and adaptive tool for volatility analysis and trend detection. Its ability to dynamically adjust to market conditions through the RBF kernel and gamma factor makes it a unique and indispensable part of any trader's toolkit.
By combining sophisticated smoothing , dynamic bands , and customizable visualization , this indicator enhances the ability to read market conditions and make more informed trading decisions. As always, backtesting and incorporating it into a broader strategy are recommended for optimal results.
DTR & ATR with live zonesThis indicator is designed to help traders gauge the day's volatility in real-time. It compares the current Daily True Range (DTR)—the distance between the session's high and low—to the historical Average True Range (ATR).
The main purpose is to project potential price levels where the market might reach based on its average volatility. These levels (100% ATR, 150%, 200%, etc.) can be used as price targets. For instance, if you're in a long trade, you might consider taking partial or full profits as the price approaches these upper ATR extension levels. The indicator is highly customisable, allowing you to control the appearance of the ATR lines, zones, and labels to fit your charting preferences.
Core Concepts: ATR and DTR
To use this indicator effectively, it's important to understand its two main components:
Average True Range (ATR): This is a classic technical analysis indicator that measures market volatility. It calculates the average range of price movement over a specific period (e.g., 14 days). A higher ATR means the price is, on average, moving more, while a low ATR indicates less volatility. This script uses a higher timeframe ATR (e.g., Daily) to establish a stable volatility baseline for the current trading day.
Daily True Range (DTR): This is simply the difference between the current trading session's highest high and lowest low (session high - session low). It tells you how much the price has actually moved so far today.
The indicator's logic revolves around comparing the live, unfolding DTR to the historical, baseline ATR. An on-screen table conveniently shows this comparison as a percentage, to show how volatile the day has been.
How It Works: The Dynamic & Locked Mechanism
The most clever part of this indicator is how it draws the ATR levels. It operates in two distinct phases during the trading session:
Phase 1: Dynamic Expansion (Before DTR meets ATR)
At the start of the session, the DTR is small. The indicator calculates the remaining range needed to "complete" the 100% ATR level (difference = avg_atr - dtr). It then adds this remaining amount to the session high and subtracts it from the session low. This creates a "floating" 100% ATR range that expands dynamically as the session high or low is extended.
Phase 2: The Lock-in (After DTR meets or exceeds ATR)
Once the day's range (DTR) becomes equal to or greater than the avg_atr, the day has met its "expected" volatility. At this point, the levels lock in place. The indicator intelligently determines the anchor point for the locked range.
Once this primary 100% ATR range is established (either dynamically or locked), the script projects the other levels (150%, 200%, 250%, and 300%) by adding or subtracting multiples of the avg_atr from this base.
How to Use It for Trading
The primary use of this indicator is to set logical, volatility-based price targets.
Setting Profit Targets: If you enter a long position, the upper ATR levels (100%, 150%, 200%) serve as excellent areas to consider taking profits. A move to the 200% or 250% level often signifies an overextended or "exhaustion" move, making it a high-probability exit zone. For short positions, the lower ATR levels serve the same purpose.
Assessing Intraday Momentum: The on-screen table tells you how much of the expected daily range has been used. If it's early in the session and the DTR is only at 30% of the ATR, you can anticipate more significant price movement is likely to come. Conversely, if the DTR is already at 150% of ATR, the bulk of the day's move may already be complete.
Mean Reversion Signals: If the price pushes to an extreme level (e.g., 250% ATR) and shows signs of stalling (e.g., bearish divergence on an oscillator), it could signal a potential reversal or pullback, offering an opportunity for a counter-trend trade.
Key Settings
ATR Length & Smoothing Type: These settings control how the baseline ATR is calculated. The default 14 period and RMA smoothing are standard, but you can adjust them to your preference.
Session Settings: This is crucial. You must set the Market Session and Time Zone to match the primary trading hours of the asset you are analysing (e.g., "0930-1600" for the NYSE session).
Show Lines / Show Labels / Show Zones: The script gives you full control over the visual display. You can toggle each ATR level's lines, labels, and background zones individually to avoid a cluttered chart and focus only on the levels that matter to your strategy.

Daily ATR Bonanza: Expected Moves - Tr33man Daily ATR Bonanza: Expected Moves
Overview 🤷♂️
The Daily ATR Bonanza script is a powerful trading tool designed to help traders visualize and understand potential price movements using the Average True Range (ATR). It provides daily and weekly ATR levels, historical statistics, and conditional probability analysis to give traders actionable insights. The script also plots the daily Keltner channel. This script is ideal for traders who want to gauge volatility, identify key levels, and make data-driven decisions.
b]Key Features:
📈 1. Daily and Weekly ATR Levels
🔵ATR Levels: The script calculates and displays ATR-based levels for the day and week. These levels are derived from the previous day's or week's close price and are adjusted using customizable multipliers (0.5x, 1x, and 1.5x by default).
🔵You can choose the number of ATR levels (1, 2, or 3) and adjust the multipliers to suit your trading strategy.
🌐 2. ATR Bands (Keltner Channels)
🔵The script includes an option to display ATR Bands, which are volatility-based envelopes around a moving average. These bands help identify overbought and oversold conditions.
🔵You can adjust the ATR multiplier and the length of the moving average used for the bands.
🧮 3. Historical Statistics and Conditional Probability
🔵 Historical Analysis: The script analyzes historical price movements to calculate the likelihood of closing at certain ATR levels.
🔵 Conditional Probability: This feature shows the probability of the price reaching specific ATR levels given the current market conditions. The conditional matches historical data by an open in the same opening ATR bucket, as well as the current price bucket having been visited in the historical case. Conditional probabilities are just statistics, and do not predict anything.
Data Table: 📚
🔵 Historical Close Probability: The percentage of days the price closed within each ATR level.
🔵 Conditional Close Probability: The likelihood of the price closing within each ATR level today.
❓ What is Conditional Probability? ❓
Conditional probability is a statistical measure that calculates the likelihood of an event occurring given that another event has already occurred. In this script, it is used to determine the probability of the price reaching specific ATR levels based on the current opening range as well as current ATR distance from the previous close.
For example:
If the market opens near the lower end of the first ATR level, the script calculates the likelihood of the price reaching the upper end of the first, second, or third ATR level.
This analysis is based on historical data, making it a powerful tool for understanding potential price movements.
🌟 Understanding the Levels
🔵Daily Levels: These are based on the previous day's close price and ATR. They are updated at the start of each new day.
🔵Weekly Levels: These are based on the previous week's close price and ATR. They are updated at the start of each new week.
🔵ATR Bands: These are dynamic levels that adjust with market volatility.
🔬 Analyze the Statistics (Daily only for now, no weekly yet)
🔵Use the interactive table to understand historical probabilities and conditional probabilities.
🔵Focus on the current opening range and the likelihood of reaching specific levels.
🧠 Make Trading Decisions
🔵Use the ATR levels and bands to identify key support and resistance levels.
🔵Use the conditional probability table to gauge the likelihood of reaching specific targets.
🔵Adjust your strategy based on the historical performance of the market.
Example Use Cases
1. Day Trading
Use the daily ATR levels to set intraday targets and stop-loss levels.
Monitor the conditional probability table to adjust your expectations based on the opening range.
2. Swing Trading
Use the weekly ATR levels to identify longer-term support and resistance levels.
3. Scalping
Use the ATR bands to identify overbought and oversold conditions.
Use the conditional probability table to quickly assess the likelihood of price movements.

ATR Price Range Prediction V.2### ATR Price Range Prediction V.2
This script calculates the expected high and low prices for the current day based on the Average True Range (ATR) and displays the proportion of days where the daily range (high - low) is greater than or equal to the ATR. Additionally, the script provides an option to adjust the size of the text displayed in the top-right corner of the chart.
#### How It Works
1. **ATR Calculation**: The script calculates the ATR for a specified period (`atrPeriod`). ATR is a measure of volatility that represents the average range between the high and low prices over a specified number of periods.
2. **Expected High and Low Calculation**:
- **Expected High**: Calculated by adding the ATR value to the low price of the current day.
- **Expected Low**: Calculated by subtracting the ATR value from the high price of the current day.
3. **Proportion Calculation**: The script calculates the proportion of days where the daily range (high - low) is greater than or equal to the ATR value. This proportion is updated in real-time as new data comes in.
4. **Table Display**: Instead of displaying labels on each candle, the script shows the expected high, expected low, and the calculated proportion in a table located at the top-right corner of the chart. The size of the text in this table can be adjusted using the `Table Size` input.
5. **Color Coding**: The script changes the color of the bars to yellow if the daily range is greater than or equal to the ATR value, making it easy to identify these bars visually.
#### How to Use
- **ATR Period (`atrPeriod`)**: Adjust the period for the ATR calculation using the input parameter. The default value is 14.
- **Table Size (`tableSizeOption`)**: Choose the size of the text displayed in the table. Options include `tiny`, `small`, `normal`, `large`, and `huge`.
- **Expected High and Low**: Use the green and red lines to identify potential target prices or stop-loss levels for your trades. The green line represents the expected high, and the red line represents the expected low.
- **Proportion**: The table in the top-right corner of the chart shows the proportion of days where the daily range is greater than or equal to the ATR value. This can provide insight into the volatility of the asset.
- **Color Coding**: Yellow bars indicate days where the daily range is greater than or equal to the ATR value.
---
### ภาษาไทย
### ATR คาดการณ์ราคาสูงสุดและต่ำสุด พร้อมสัดส่วน
สคริปต์นี้คำนวณราคาสูงสุดและต่ำสุดที่คาดการณ์สำหรับวันปัจจุบันโดยอิงจากค่าเฉลี่ยช่วงที่แท้จริง (ATR) และแสดงสัดส่วนของวันที่ช่วงราคาต่อวัน (สูง - ต่ำ) มากกว่าหรือเท่ากับค่า ATR นอกจากนี้ยังมีตัวเลือกในการปรับขนาดข้อความที่แสดงในกล่องข้อความมุมขวาบนของกราฟ
#### วิธีการทำงาน
1. **การคำนวณ ATR**: สคริปต์คำนวณค่า ATR สำหรับช่วงเวลาที่กำหนด (`atrPeriod`) ATR เป็นมาตรวัดความผันผวนที่แสดงช่วงเฉลี่ยระหว่างราคาสูงสุดและต่ำสุดในช่วงเวลาที่กำหนด
2. **การคำนวณราคาสูงสุดและต่ำสุดที่คาดการณ์**:
- **ราคาสูงสุดที่คาดการณ์**: คำนวณโดยการบวกค่า ATR กับราคาต่ำสุดของวันปัจจุบัน
- **ราคาต่ำสุดที่คาดการณ์**: คำนวณโดยการลบค่า ATR จากราคาสูงสุดของวันปัจจุบัน
3. **การคำนวณสัดส่วน**: สคริปต์คำนวณสัดส่วนของวันที่ช่วงราคาต่อวัน (สูง - ต่ำ) มากกว่าหรือเท่ากับค่า ATR สัดส่วนนี้จะอัปเดตแบบเรียลไทม์เมื่อมีข้อมูลใหม่เข้ามา
4. **การแสดงผลในตาราง**: แทนที่จะแสดงป้ายกำกับบนแท่งเทียนแต่ละแท่ง สคริปต์จะแสดงราคาสูงสุดที่คาดการณ์ ราคาต่ำสุดที่คาดการณ์ และสัดส่วนที่คำนวณในตารางที่มุมขวาบนของกราฟ โดยสามารถปรับขนาดข้อความในตารางได้
5. **การใช้สี**: สคริปต์จะเปลี่ยนสีของแท่งเทียนเป็นสีเหลืองหากช่วงราคาต่อวันมากกว่าหรือเท่ากับค่า ATR ทำให้สามารถระบุแท่งเทียนเหล่านี้ได้ง่ายขึ้น
#### วิธีการใช้งาน
- **ATR Period (`atrPeriod`)**: ปรับช่วงเวลาสำหรับการคำนวณ ATR โดยใช้พารามิเตอร์การป้อนค่า ค่าเริ่มต้นคือ 14
- **Table Size (`tableSizeOption`)**: เลือกขนาดข้อความที่แสดงในตาราง ตัวเลือกได้แก่ `tiny`, `small`, `normal`, `large`, และ `huge`
- **ราคาสูงสุดและต่ำสุดที่คาดการณ์**: ใช้เส้นสีเขียวและสีแดงเพื่อระบุราคาที่เป็นเป้าหมายหรือระดับการหยุดขาดทุนสำหรับการซื้อขายของคุณ เส้นสีเขียวแสดงถึงราคาสูงสุดที่คาดการณ์และเส้นสีแดงแสดงถึงราคาต่ำสุดที่คาดการณ์
- **สัดส่วน**: ตารางที่มุมขวาบนของกราฟแสดงสัดส่วนของวันที่ช่วงราคาต่อวันมากกว่าหรือเท่ากับค่า ATR ซึ่งสามารถให้ข้อมูลเชิงลึกเกี่ยวกับความผันผวนของสินทรัพย์
- **การใช้สี**: แท่งเทียนสีเหลืองบ่งบอกถึงวันที่ช่วงราคาต่อวันมากกว่าหรือเท่ากับค่า ATR
_____

Omega ATR Indicator📖 Introduction
The Ω ATR Indicator was created to provide a more complete and professional framework for volatility analysis than the classic Average True Range (ATR).
While the traditional ATR is a useful tool, it has limitations: it delivers a simple rolling average of volatility, but it does not adapt to market regimes, it does not highlight extreme events, and it often leaves the trader with incomplete information about risk.
The Ω ATR takes the same foundation and elevates it into a multi-dimensional volatility dashboard, adding statistical layers, adaptive calculations, and clear visual references that allow traders to interpret volatility in a way that is immediately actionable.
🔎 What makes it different from a standard ATR?
This indicator introduces several features beyond the classic formula:
True Range Core – plots the raw True Range (TR) for each bar, providing a direct, bar-by-bar view of volatility impulses.
Standard & Adjusted ATR – includes both the conventional ATR (smoothed average) and an Adjusted ATR that automatically corrects for extreme conditions by incorporating percentile rescaling.
Percentile Volatility Levels – dynamically calculated extreme thresholds (99.8%, 75%, 50%, 25%), plotted as dotted levels across the chart. These act as reference lines for “normal” vs. “abnormal” volatility, useful for spotting unusual price expansions or contractions.
Linear Regression Volatility Trend – overlays a regression line of volatility, showing whether the market is moving toward expansion (rising vol), contraction (falling vol), or stability.
Monetary Value Translation – the indicator converts volatility into points, ticks, and dollar values (based on the instrument’s point value). This allows futures traders and high-value instruments users to immediately see how much volatility is “worth” in cash terms.
Interactive Table Display – a real-time statistics table is displayed directly on the chart, showing:
SMA of ATR in $ and points
Percentile-based volatility range (VAR) in $ and points
Tick equivalences, for quick position sizing
⚡ How traders can use it
The Ω ATR Indicator is designed to be versatile, fitting both discretionary traders and systematic strategy developers.
Risk Management: ATR-based stop losses and position sizing are significantly improved by using the adjusted ATR and percentile thresholds. Traders can size their positions according to volatility regimes, not just raw averages.
Breakout & Exhaustion Detection: When TR or ATR values spike above the 99.8% or 95% percentile levels, this often corresponds to breakout conditions or volatility exhaustion — useful for breakout strategies, mean-reversion setups, and volatility fades.
Market Regime Identification: The regression line helps distinguish if volatility is rising (trending environment, larger swings expected) or compressing (range-bound environment, lower risk opportunities).
Multi-Asset Flexibility: Works equally well on equities, futures, crypto, and FX. Its point/tick/dollar conversion makes it especially powerful for futures traders who need to quantify risk precisely.
Scalping to Swing Trading: On lower timeframes, it acts as a micro-volatility detector; on higher timeframes, it functions as a strategic risk gauge for position management.
⚙️ Settings and Customization
Length: The ATR lookback period (default = 34).
Shorter lengths (14–21) for intraday traders who want fast response.
Longer lengths (34–55) for swing/position traders who want smoother readings.
AVG / ADJ AVG: Toggle to display the standard ATR or the adjusted ATR.
Volatility Levels: Enable/disable up to 4 percentile-based levels (1st = 25%, 2nd = 50%, 3rd = 75%, 4th = 99.8%). Recommended: keep 3 levels active for clarity.
Color Controls: All plots and levels are fully customizable to match your chart style.
Table Display: Positioned on the chart (default: middle-right) with key values updated in real time.
🧭 Best Practices for Use
Combine with Trend Tools: Volatility readings are most powerful when combined with trend filters or volume analysis. For example, a breakout with both high volatility and trend confirmation is stronger than either alone.
ATR Stops: Use the Adjusted ATR rather than the standard one when trailing stops in highly volatile instruments like crypto or Nasdaq futures, as it adapts to outlier spikes.
Dollar Risk Translation: Use the dollar-value outputs to predefine maximum acceptable risk per trade (e.g., “I only risk $250 per position”). This bridges volatility to portfolio risk management.
Event Monitoring: Around economic events or earnings, expect volatility spikes above higher percentile levels. The indicator makes these moves instantly visible.
📌 Summary
The Ω ATR Indicator is not just “another ATR.” It is a comprehensive volatility framework that transforms volatility from a simple statistic into an actionable trading signal.
By combining:
the classic ATR,
an adjusted ATR,
percentile extremes,
regression-based volatility trends,
and real-time dollar conversions,
…this tool allows traders to precisely understand, visualize, and act on volatility in ways that a standard ATR simply cannot provide.
Whether you are scalping intraday moves, swing trading equities, or managing futures positions, the Ω ATR equips you with a professional-grade volatility dashboard that clarifies risk, highlights opportunity, and adapts across all markets and timeframes.
👉 Designed and developed by OmegaTools for traders who demand precision, clarity, and adaptability in their volatility analysis.

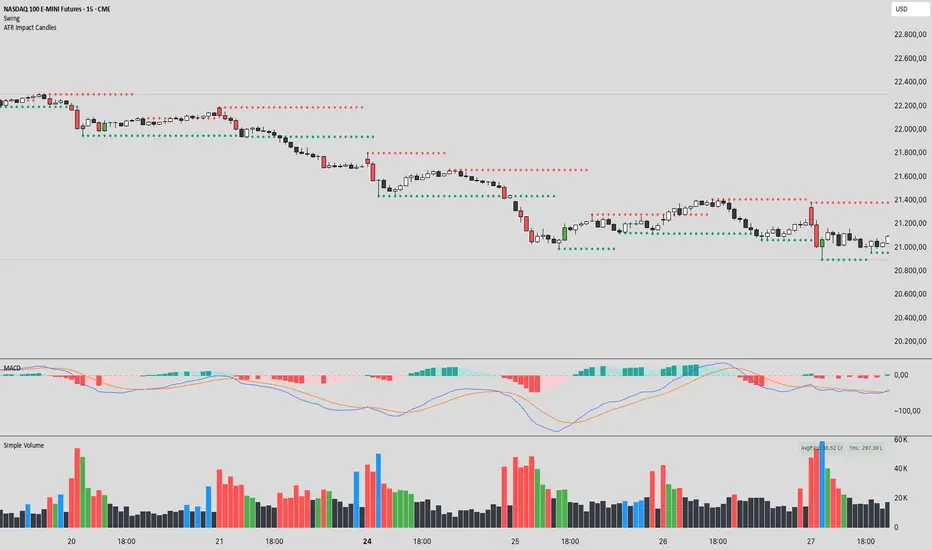
ATR Impact CandlesATR Impact Candles: Simplify Your Trading with Pure Price Action
You don’t need dozens of cluttered indicators to catch what really matters. With ATR Impact Candles, you get a powerful, single-tool solution that cuts through the noise by focusing on what truly drives the market: price action and volatility. This indicator highlights only those candlesticks that pack a punch—showing you when the market’s range is exceptionally strong relative to its recent behavior. Whether you’re a scalper or a swing trader, ATR Impact Candles empowers you to time your entries and exits with confidence, letting you trade based on real market momentum.
⸻
Indicator Overview
The indicator is designed for TradingView and is implemented in Pine Script (version 5). Its primary purpose is to highlight specific candles that meet a defined volatility condition based on the Average True Range (ATR). Instead of modifying every candle’s appearance, the indicator only changes the color of those “signal” candles that exceed a user-defined multiple of the ATR. The rest of the candles remain in their traditional black and white appearance—preserving the classic candlestick chart look.
⸻
Key Features
1. ATR-Based Signal Identification:
• ATR Calculation:
The indicator calculates the ATR using a configurable lookback period (default is 14 periods). The ATR is a common volatility measure that reflects the average range of price movement.
• Threshold Condition:
A candle is flagged as a signal if its range (high minus low) meets or exceeds a specified multiple (the “ATR Factor”) of the ATR. By default, this factor is set to 2, meaning any candle whose range is at least twice the ATR is considered significant.
2. Dynamic Candle Coloring:
• Signal Candles:
• When a candle meets the ATR threshold condition:
• Up Candles: are colored green.
• Down Candles: are colored red.
• Non-Signal Candles:
• Candles that do not meet the threshold condition retain their classic appearance:
• Up candles are white.
• Down candles are black.
3. User Configurability:
• ATR Period:
Traders can adjust the ATR period to tailor the volatility measure to different markets or timeframes.
• ATR Factor:
The multiple of the ATR that defines a signal candle is also configurable, giving flexibility to experiment with different thresholds for what constitutes “significant” price movement.
• Overlay Display:
The indicator runs in overlay mode on the chart, meaning it directly affects the appearance of the candlestick bars without interfering with other chart elements.
4. Additional Visual Aid:
• Threshold Line Plot:
The script optionally plots a line representing the ATR multiplied by the chosen factor. This line serves as a visual benchmark on the chart, allowing traders to see at what level the ATR threshold lies relative to the price action.
⸻
How It Works
1. ATR Calculation:
The indicator first calculates the Average True Range (ATR) for the defined period. This value is updated for each new candle.
2. Range Comparison:
For each candle, the indicator calculates the range (high - low) and compares it to the threshold, which is the ATR multiplied by the user-defined factor.
3. Conditional Coloring:
• If the Candle’s Range ≥ (ATR * Factor):
• The candle is marked as a “signal candle.”
• Its color is set to green if it is an up candle (close is greater than or equal to open) or red if it is a down candle.
• Otherwise:
• The candle retains its classic look, with up candles in white and down candles in black.
4. Chart Display:
By applying these rules to every candle, the indicator visually emphasizes those moments when the market shows unusually large price movements relative to its recent average volatility. This helps traders quickly spot potential breakouts or reversals.
⸻
Practical Applications
• Volatility Breakouts:
Identify candles that may signal the start of a breakout or strong reversal.
• Risk Management:
Adjust stop-loss levels or position sizes when unusually volatile candles are detected.
• Signal Confirmation:
Combine with other technical indicators or chart patterns to reinforce entry or exit decisions.
⸻
ATR Impact Candles is your essential, no-nonsense tool for filtering out market noise and focusing solely on significant price action. Simplify your trading decisions and harness the power of volatility with one clear, effective indicator.
EDUVEST UTBOT ADJ - Adaptive ATR Trailing StopEDUVEST UTBOT ADJ - Adaptive ATR Trailing Stop with Session-Based Sensitivity
━━━━━━━━━━━━━━━━━━━━━━━━━━━━━━━━━━━━━━━━━━━━━━━━
█ ORIGINALITY
This indicator is an enhanced version of the classic UT Bot concept, featuring automatic session-based ATR sensitivity adjustment. Unlike the original UT Bot which uses a fixed sensitivity value, this version dynamically adapts to different trading sessions (Tokyo, London, New York) and automatically detects asset characteristics to optimize signal generation.
━━━━━━━━━━━━━━━━━━━━━━━━━━━━━━━━━━━━━━━━━━━━━━━━
█ WHAT IT DOES
- Generates BUY and SELL signals based on ATR trailing stop crossovers with a moving average
- Automatically adjusts sensitivity based on current trading session (Tokyo/London/NY)
- Auto-detects asset type and applies optimized parameters for each instrument
- Displays real-time session information and volatility status
- Provides alert functionality with customizable cooldown periods
━━━━━━━━━━━━━━━━━━━━━━━━━━━━━━━━━━━━━━━━━━━━━━━━
█ HOW IT WORKS
【Core Logic: ATR Trailing Stop】
The indicator calculates an ATR-based trailing stop using the formula:
Trailing Stop = Price ± (Sensitivity × ATR)
When price is above the trailing stop and rising, the stop trails below price.
When price is below the trailing stop and falling, the stop trails above price.
【Signal Generation】
- BUY Signal: Price crosses above the trailing stop AND Moving Average crosses above the trailing stop
- SELL Signal: Price crosses below the trailing stop AND Moving Average crosses below the trailing stop
【Session-Based Sensitivity Adjustment】
The indicator adjusts ATR sensitivity based on trading session (JST timezone):
- Tokyo (08:00-15:00): Lower sensitivity (reduced by adjustment value) - typically quieter markets
- London (15:00-23:00): Base sensitivity - moderate volatility
- New York (23:00-08:00): Higher sensitivity (increased by adjustment value) - higher volatility
【Dynamic ATR Adjustment】
When enabled, the indicator compares current ATR to its smoothed average:
- ATR Ratio = Current ATR / SMA(ATR, smoothing period)
- Volatility Multiplier = 1.0 + (Sensitivity × (2.0 - ATR Ratio))
This reduces sensitivity during high volatility (fewer false signals) and increases sensitivity during low volatility (faster response).
【Auto Asset Detection】
The indicator automatically detects the traded instrument and applies optimized parameters:
- Stable pairs (USDJPY, EURUSD, USDCHF): Base sensitivity 1.5-1.8
- Moderate pairs (AUDUSD, USDCAD, EURJPY): Base sensitivity 2.0-2.3
- Volatile pairs (GBPUSD): Base sensitivity 2.8
- Commodities (GOLD/XAUUSD): Base sensitivity 3.5
- Indices (NASDAQ/NAS100): Base sensitivity 4.0
━━━━━━━━━━━━━━━━━━━━━━━━━━━━━━━━━━━━━━━━━━━━━━━━
█ HOW TO USE
【Recommended Settings】
- Timeframe: 15 minutes or higher (15M, 1H, 4H recommended)
- Best performance on: Forex majors, Gold, NASDAQ
- Enable "Auto Asset Detection" for optimized parameters
【Entry Rules】
- BUY: Enter long when green BUY label appears
- SELL: Enter short when pink SELL label appears
【Session Panel】
The top-right panel displays:
- Current trading session (Tokyo/London/NY)
- Volatility status (High Chance/Medium Chance/Caution)
- Mode (AUTO/MANUAL)
【Alert Setup】
1. Enable "Viewer Alert Display" in settings
2. Set cooldown period (default: 15 minutes) to avoid signal spam
3. Create alert with "Any alert() function call" condition
【Important Notes】
- This indicator does not repaint - signals are confirmed at bar close
- Lower timeframes (1M, 5M) may generate excessive signals
- Always use proper risk management and confirm with other analysis
━━━━━━━━━━━━━━━━━━━━━━━━━━━━━━━━━━━━━━━━━━━━━━━━
█ SETTINGS OVERVIEW
🎯 Alert Settings
- Viewer Alert Display: Enable/disable alert labels
- Cooldown Function: Prevent rapid consecutive signals
- Cooldown Time: Minutes between alerts (5-60)
🔧 Dynamic ATR Settings
- Enable Dynamic ATR: Auto-adjust based on volatility
- ATR Period: Calculation period (default: 14)
- ATR Smoothing: Smoothing period for ratio calculation
- Volatility Sensitivity: How much to adjust (0.1-1.0)
🕐 Session ATR Adjustment
- Enable Time Adjustment: Session-based sensitivity
- Show Session Info: Display session panel
📊 Asset Settings
- Auto Asset Detection: Automatically optimize for instrument
- Manual settings available when auto-detection is disabled
━━━━━━━━━━━━━━━━━━━━━━━━━━━━━━━━━━━━━━━━━━━━━━━━
█ CREDITS
Based on the original UT Bot concept by QuantNomad.
Enhanced with session-based adaptation and auto-asset detection by EduVest.
License: Mozilla Public License 2.0

ATR Extension from Moving Average, with Robust Sigma Bands
# ATR Extension from Moving Average, with Robust Sigma Bands
**What it does**
This indicator measures how far price is from a selected moving average, expressed in **ATR multiples**, then overlays **robust sigma bands** around the long run central tendency of that extension. Positive values mean price is extended above the MA, negative values mean price is extended below the MA. The signal adapts to volatility through ATR, which makes comparisons consistent across symbols and regimes.
**Why it can help**
* Normalizes distance to an MA by ATR, which controls for changing volatility
* Uses the **bar’s extreme** against the MA, not just the close, so it captures true stretch
* Computes a **median** and **standard deviation** of the extension over a multi-year window, which yields simple, intuitive bands for trend and mean-reversion decisions
---
## Inputs
* **MA length**: default 50, options 200, 64, 50, 20, 9, 4, 3
* **MA timeframe**: Daily or Weekly. The MA is computed on the chosen higher timeframe through `request.security`.
* **MA type**: EMA or SMA
* **Years lookback**: 1 to 10 years, default 5. This sets the sample for the median and sigma calculation, `years * 365` bars.
* **Line width**: visual width of the plotted extension series
* **Table**: optional on-chart table that displays the current long run **median** and **sigma** of the extension, with selectable text size
**Fixed parameters in this release**
* **ATR length**: 20 on the daily timeframe
* **ATR type**: classic ATR. ADR percent is not enabled in this version.
---
## Plots and colors
* **Main plot**: “Extension from 50d EMA” by default. Value is in **ATR multiples**.
* **Reference lines**:
* `median` line, black dashed
* +2σ orange, +3σ red
* −2σ blue, −3σ green
---
## How it is calculated
1. **Moving average** on the selected higher timeframe: EMA or SMA of `close`.
2. **Extreme-based distance** from MA, as a percent of price:
* If `close > MA`, use `(high − MA) / close * 100`
* Else, use `(low − MA) / close * 100`
3. **ATR percent** on the daily timeframe: `ATR(20) / close * 100`
4. **ATR multiples**: extension percent divided by ATR percent
5. **Robust center and spread** over the chosen lookback window:
* Center: **median** of the ATR-multiple series
* Spread: **standard deviation** of that series
* Bands: center ± 1σ, 2σ, 3σ, with 2σ and 3σ drawn
This design yields an intuitive unit scale. A value of **+2.0** means price is about 2 ATR above the selected MA by the most stretched side of the current bar. A value of **−3.0** means roughly 3 ATR below.
---
## Practical use
* **Trend continuation**
* Sustained readings near or above **+1σ** together with a rising MA often signal healthy momentum.
* **Mean reversion**
* Spikes into **±2σ** or **±3σ** can identify stretched conditions for fade setups in range or late-trend environments.
* **Regime awareness**
* The **median** moves slowly. When median drifts positive for many months, the market spends more time extended above the MA, which often marks bullish regimes. The opposite applies in bearish regimes.
**Notes**
* The MA can be set to Weekly while ATR remains Daily. This is deliberate, it keeps the normalization stable for most symbols.
* On very short intraday charts, the extension remains meaningful since it references the session’s extreme against a higher-timeframe MA and a daily ATR.
* Symbols with short histories may not fill the lookback window. Bands will adapt as data accrues.
---
## Table overlay
Enable **Table → Show** to see:
* “ATR from \”
* Current **median** and **sigma** of the extension series for your lookback
---
## Recommended settings
* **Swing equities**: 50 EMA on Daily, 5 to 7 years
* **Index trend work**: 200 EMA on Daily, 10 years
* **Position trading**: 20 or 50 EMA on Weekly MA, 5 to 10 years
---
## Interpretation examples
* Reading **+2.7** with price above a rising 50 EMA, near prior highs
* Strong trend extension, consider pyramiding in trend systems or waiting for a pullback if you are a mean-reverter.
* Reading **−2.2** into multi-month support with flattening MA
* Stretch to the downside that often mean-reverts, size entries based on your system rules.
---
## Credits
The concept of measuring stretch from a moving average in ATR units has a rich community history. This implementation and its presentation draw on ideas popularized by **Jeff Sun**, **SugarTrader**, and **Steve D Jacobs**. Thanks to each for their contributions to ATR-based extension thinking.
---
## License
This script and description are distributed under **MPL-2.0**, consistent with the header in the source code.
---
## Changelog
* **v1.0**: Initial public release. Daily ATR normalization, EMA or SMA on D or W timeframe, robust median and sigma bands, optional table.
---
## Disclaimer
This tool is for educational use only. It is not financial advice. Always test on your own data and strategies, then manage risk accordingly.

Multiple ATR Lines with Current Price PercentageThis indicator plots multiple lines based on the Average True Range (ATR) on the chart, helping traders identify potential support and resistance levels. Specifically, it draws three lines above the price and three lines below the price at different multiples of the ATR. Additionally, it plots a dynamic line at the current price level, which shows how much percentage of the ATR the current price has traveled from a specific point.
How it works:
ATR-Based Lines: The indicator calculates three upper and three lower levels based on the ATR of the selected period. These levels represent 1x, 2x, and 3x ATR above and below the current price.
Current Price Line: A dotted line follows the current price, displaying the percentage of the ATR that the price has moved.
Labels: Each line is labeled with its respective ATR multiple (1x ATR, 2x ATR, 3x ATR), and the current price line shows the percentage of the ATR traveled.
Use Cases:
Identifying Market Volatility: Traders can use this indicator to see how far the price has moved relative to its average volatility.
Support and Resistance Levels: The ATR lines can be treated as potential support and resistance zones, providing insight into price targets or stop-loss placement.
Dynamic Tracking: The percentage of ATR traveled helps traders understand the market momentum relative to its historical volatility.
Settings:
ATR Length: The user can adjust the length of the ATR calculation period.
ATR Multiplier: A multiplier to adjust the distance of the lines relative to the ATR.
Advantages:
Clear visualization of market volatility through ATR-based levels.
Real-time tracking of the price’s movement relative to ATR, giving traders a better understanding of price action.
Customizable settings for different trading styles.
