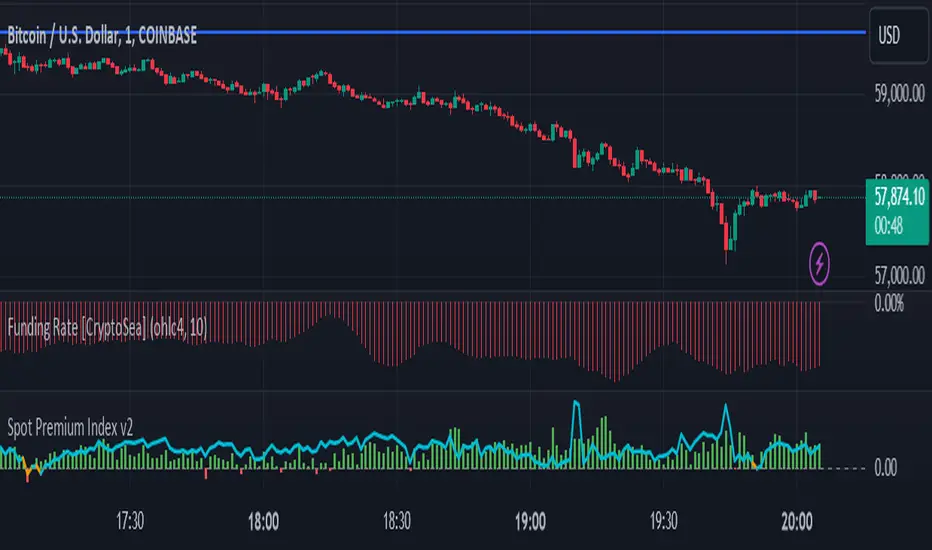
BTC Prices IndicatorThis indicator shows you the prices of 4 of the top cryptocurrency exchanges: Binance, BitMEX, Coinbase, and, Bybit. The prices are updated each minute and can be useful for showing you what type of market is leading a particular run.
E.g Coinbase premium shows spot buyers are leading a rally.
Cari dalam skrip untuk "BTC"

BTC Perp Volume Per ExchangeBitcoin aggregated derivatives volume in stacked format or indexed format and denominated in USD.
This allows you to look at total volume of perpetual swap contracts and compare volume of different exchanges.
The indexed format makes it easier to look at the ratio of volume share of each exchange.
Markets included are:
Binance USDT
Huobi USD
Bybit USD
Bitmex XBT
FTX USD
Deribit USD
Phemex USD
Keep in mind that the Binance and FTX perps are dollar margined contracts. All the other ones are inverse contracts (coin margin).
In the settings you can exclude certain exchanges, but only do this in the "input" section and NOT in the "style" section.
If you get rid of markets in the style section it'll mess with the calculation and the data will be incorrect.
It's free so just add this indicator to your favourites.
Cheers.

BTC Spot Volume Per ExchangeBitcoin aggregated spot volume in stacked format or indexed format and denominated in USD.
This allows you to look at total volume and compare volume of different exchanges.
The indexed format makes it easier to look at the ratio of volume share of each exchange.
Markets included are:
Binance USDT
Okex USDT
Huobi USDT
Coinbase USD
Bitfinex USD
Bitstamp USD
FTX USD
In the settings you can exclude certain exchanges, but only do this in the "input" section and NOT in the "style" section.
If you get rid of markets in the style section it'll mess with the calculation and the data will be incorrect.
It's free so just add this indicator to your favourites.
Cheers.

Binance Z VolumeBTC perpetual volume on Binance is about 4x spot volume.
Comparing spot and perpetual volumes could provide useful insights into market sentiment.
Abnormal increases in the spot market could be associated with accumulation. Abnormal increases in the perpetual market, on the other hand, could predict volatility as well lows and highs.
This script represents a Z-score of the volume of perpetual and 4xspot on Binance.
High values above 0 mean that the volume is skewed towards perpetual contracts. Values below 0 mean that the volume is skewed towards spot contracts.
Feel free to suggest changes and improvements of this script.
Translated with www.DeepL.com (free version)
BIO

BTC Coinbase PremiumThis script is base on another script by oh 92.
It basically shows you where the price of Bitcoin (in USD) on Coinbase trades at a premium against an average of several futures exchanges.
Coinbase premium shows spot interest on bitcoin which happens either when futures are shorting heavily but spot holds the price up (often bullish especially when price is at a support level).
Negative premium shows that futures are leading price during an uptrend or spot is leading price during a downtrend.
Strong positive premium is often considered bullish.
Strong negative premium is often considered bearish even if price goes up.
The histogramm coinbase premium vs an average of several futures exchanges (Bitmex, Bitfinex, Binance, FTX, Phemex and Bitstamp).
The line diagramm shows coinbase premium vs Bybit.
In contrast to the script by oh92 this script uses different exchages (especially Bybit as a lot of former Bitmex traders changed to Bybit during september and october 2020).
All values are in percent because differences in USD only are not suitable for historic prices. This means if CB-premium is -0.1 then futures trade 0.1% lower than coinbase.
BTC CME PremiumThe Chicago Mercantile Exchange bitcoin futures price versus a volume weighted index of bitcoin spot markets.
Positive values (green) means the CME price is higher than the spot index.
Negative values (red) means the CME price is lower than the spot index.
Whether a high CME price is bullish or not is up for debate so make of it what you will.
Weekends are highlighted with soft blue shading because during the weekend CME trading is halted which obviously has a big impact on the premium.
There's an option to turn this shading off.
Markets included for the volume weighted index:
Coinbase USD
Bitstamp USD
Bitfinex USD
Kraken USD
FTX USD
Binance USDT
Huobi USDT
This indicator is free, enjoy.

BTC Aggregated Perps OBVAggregated on balance volume of the most relevant bitcoin perpetual swap contracts.
There's also an option to select which markets you want to include or exclude.
Complete list:
Binance USD
Binance USDT
Okex USD
Okex USDT
Bybit USD
Bybit USDT
Huobi USD
Bitmex XBT
FTX USD
Deribit USD
Kraken XBT

BTC Aggregated Spot OBVAggregated on balance volume of the most relevant bitcoin spot markets.
There's also an option to select which markets you want to include or exclude.
Complete list:
Binance USDT
Huobi USDT
Okex USDT
Poloniex USDT
Coinbase USD
Bitstamp USD
Bitfinex USD
Kraken USD
Gemini USD
FTX USD

BTC Aggregated Perps VolumeAggregated volume for the most relevant bitcoin perpetual swap contracts, denominated in US dollars.
There's also an option to select which markets you want to include or exclude.
Complete list:
Binance USD
Binance USDT
Okex USD
Okex USDT
Bybit USD
Bybit USDT
Huobi USD
Bitmex XBT
FTX USD
Deribit USD
Kraken XBT

BTC Aggregated Spot VolumeAggregated volume of the most relevant bitcoin spot markets.
There's also an option to select which markets you want to include or exclude.
Complete list:
Binance USDT
Binance BUSD
Coinbase USD
Coinbase EUR
Bitstamp USD
Bitstamp EUR
Kraken USD
Kraken EUR
Bitfinex USD
Gemini USD
Huobi USDT
Okex USDT
Bitflyer JPY
Bithumb KRW
FTX USD
CME
Grayscale

BTC Bitfinex USD L/S RatioThe Bitfinex USD long / short ratio.
Values above 1 means there're more longs than shorts.

BTC Spot Volume DominanceThis shows the relative dominance of spot volume compared to the volume of perpetual swaps.
Derivatives volume is always a lot higher than spot volume, so a relative ratio is made to compare.
The higher the ratio the more dominant spot markets are. Spot dominance during rallies is considered bullish.

BTC Futures ContangoThis indicator allows you to compare two futures contracts to the Bitmex XBT/USD perpetual swap contract.
There's an option in the settings to use a different chart as a reference.
It shows percentage-wise whether the futures are in contango or in backwardation.
Bullish and bearish warning signs are given at specific percentages. These can be customized.

BTC Bitmex Index PremiumThe price difference between the last price of the Bitmex XBT/USD perpetual swap contract and the BXBT spot bitcoin dollar index.
Positive values (green) means the BXBT index is trading at a premium, which is considered bullish.
Negative values (red) means the BXBT index is trading at a discount, which is considered bearish.

BTC VIP EMA CROSS Buy/Sell (GC & DC)EMA cross 5&10 standard-setting with add on of BUY/SELL signal ( GC & DC) which will make the traders have an indication of buy and sell easily and clearly.
An exponential moving average strategy, or EMA strategy, is used to identify the predominant trend in the market. It can also provide the support and resistance level to execute your trade. Indicators: v4 (default setting), EMA 5 10 Crossover (default setting)
Preferred Time Frame(s):15-Minute, 30-Minute, 1-Hour, 4-Hour, 1-Day
Strategy
Long Entry Rules
Enter a buy in the market if the following indicator or chart pattern takes center stage:
If the blue upward pointing arrow of the EMA 5 10 Crossover custom indicator gets aligned just somewhat below the candlesticks as seen in Fig. 1.0, the market sentiment is said to be bullish, hence a trigger to go long on the pair of interest.
If the light blue line of the custom indicator gets outlined just below price bars as illustrated in Fig. 1.0, price is said to be pushed somewhat higher i.e. a trigger to buy the asset of focus.
Exit Strategy/Take Profit for Buy Entry
Exit or take profit if the following rules or conditions takes precedence:
If the red downward pointing arrow of the EMA 5 10 Crossover custom indicator forms above price bars as depicted in Fig. 1.0 while a buy signal is ongoing in the market, a possible price dip is said to be looming, as such an exit or take profit is advised.
If the red line of the custom indicator forms above the candlestick during a bullish trend, it is a pointer to a possible price dip, hence an exit or take profit is advised.

BTC Contango IndexInspired by a Twitter post by Byzantine General:
This is a script that shows the contango between spot and futures prices of Bitcoin to identify overbought and oversold conditions. Contango and backwardation are terms used to define the structure of the forward curve. When a market is in contango, the forward price of a futures contract is higher than the spot price. Conversely, when a market is in backwardation, the forward price of the futures contract is lower than the spot price.
The aggregate prices on top exchanges are taken and then averaged to obtain a Spot Average and a Futures Average. The script then plots (Futures Average/Spot Average) - 1 to illustrate the percent difference (contango) between spot and futures prices of Bitcoin.
When in contango, Bitcoin may be overbought.
When in backwardation, Bitcoin may be oversold.

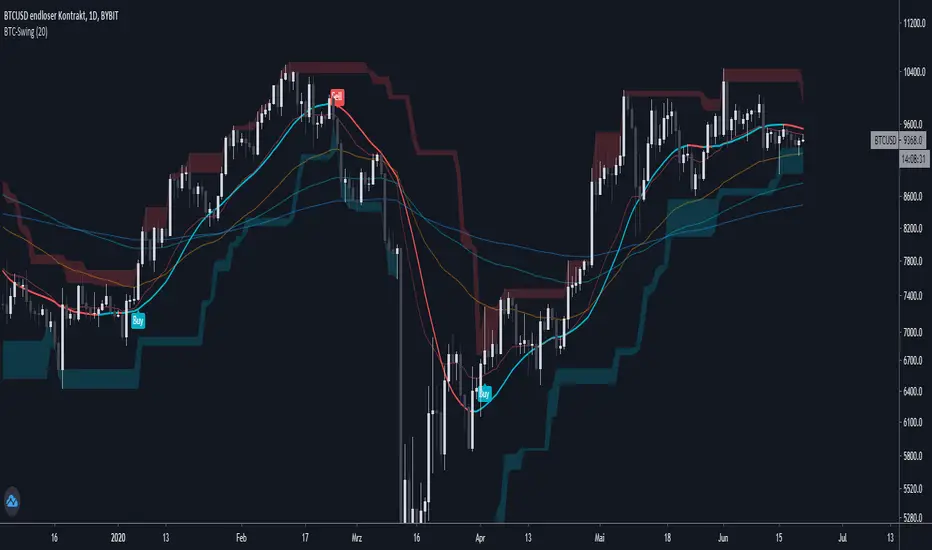
BTC-SwingScript is based on SuperRange - evo @EvoCrypto
It's based on highest and lowest candle close from a few bars back.
Removed + added some minor stuff, added alerts and signals
dded a signal line (ALMA)
added options to display EMA 20/50/100/200
use higher timeframe (1D)
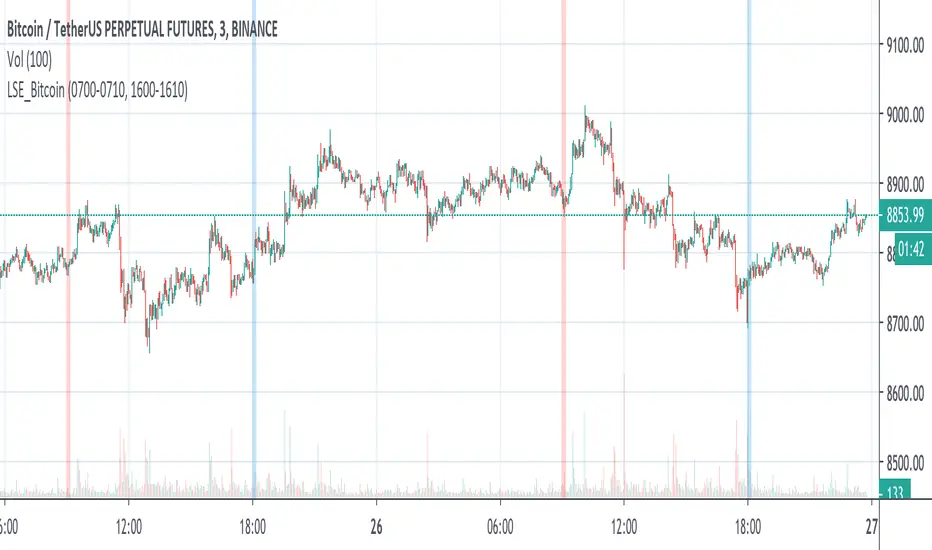
LSE_Bitcoin pump and flush at the London SE opening and closingBTC recently decoupled from SPX but now it is using London Exchange opening and closing hour to pump and flush.
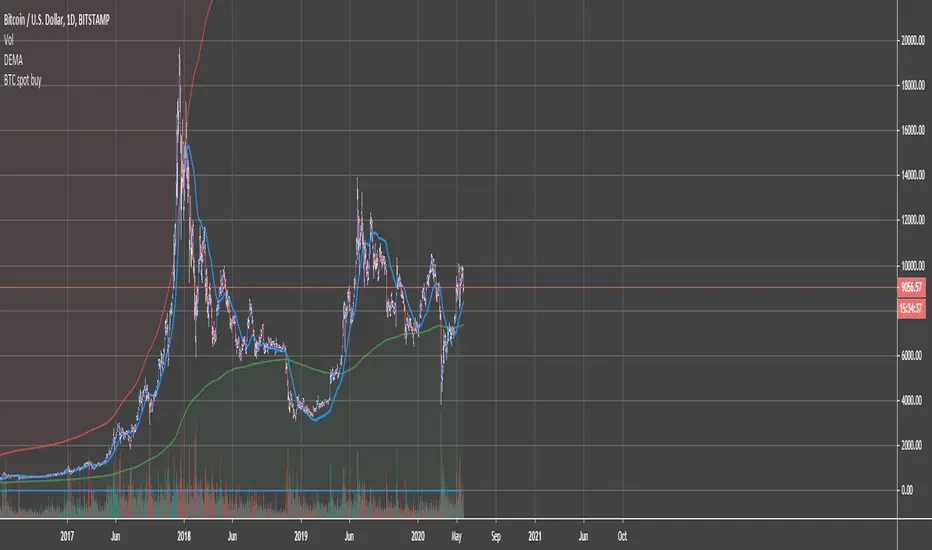
BTC Accumulation/Distribution ZonesAccumulate, when the price is in the green zone and distribute in the red zone. Use it on Bitcoin/Usd Bitstamp or Bitfinex preferably.
Right-click on the Y-axis and select "Scale to Price only" so the indicator doesn't mess up your scale. Enjoy!
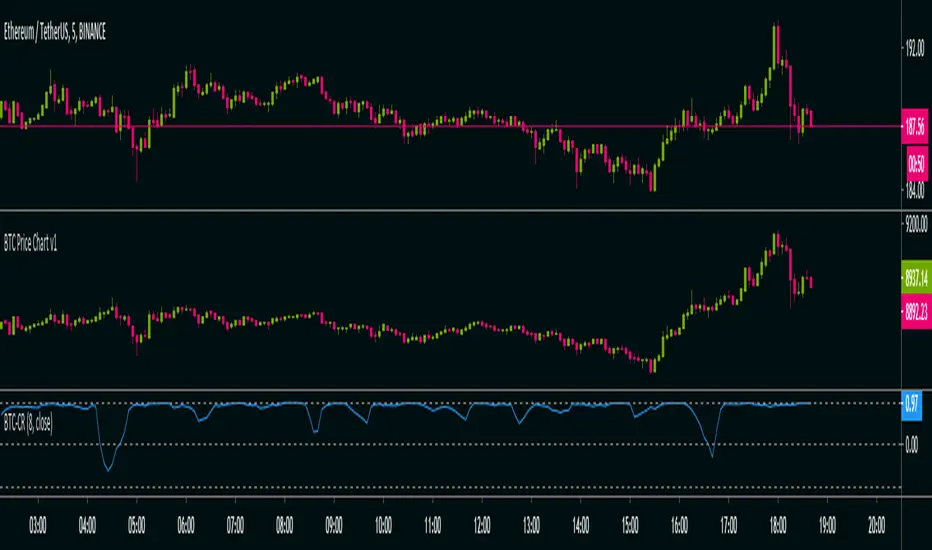
BTC Co-Relation v1Calculate Pearson-correlation-coefficient of selected cryptocurrency with Bitcoin average price of 10 different exchanges.
This is helpful in scalping(at least for me), by using this we can find co-relation between a cryptocurrency and Bitcoin .
Here we are using Bitcoin average price of 10 different exchanges.
It is an oscillator with minimum value -1 and maximum value +1.
👉-1 means current selected cryptocurrency price is completely out of relation with Bitcoin price, means Bitcoin price increasing and it's price decreasing or Bitcoin price decreasing and it's price increasing in selected time-frame.
👉+1 means current selected cryptocurrency price is completely in co-relation with Bitcoin price, means Bitcoin price increasing and it's price also increasing or Bitcoin price decreasing and it's price also decreasing in selected time-frame.
Happy trading 👍.
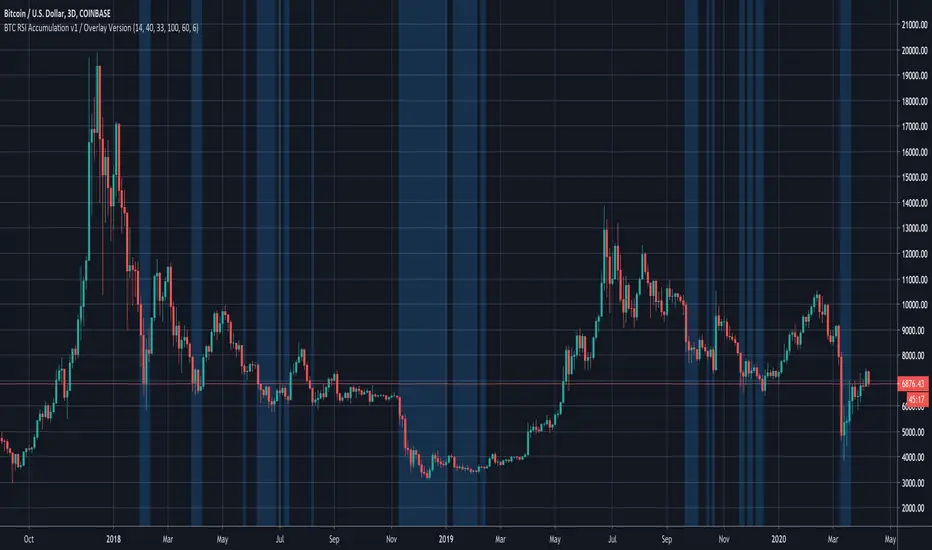
BTC RSI Accumulation Indicator for 3-Day ChartSimple indicator for highlighting typical Bitcoin accumulation RSI levels on a 3-day chart.

BTC RSI Accumulation Indicator for 3-Day Chart - Overlay VersionSimple indicator for highlighting typical Bitcoin accumulation RSI levels on a 3-day chart.
BTC Correlation CoefficientAn indicator that only calculates and displays the correlation coefficient with bitfinex:BTCUSD close.
By changing the settings, you can calculate any chart and correlation coefficient
0.7 to 1.0 There is a fairly strong positive correlation
0.4 to 0.7 Positive correlation
0.2 to 0.4 with a weak positive correlation
-0.2 ~ 0 ~ 0.2 Little correlation
-0.4 to -0.2 Weak negative correlation
-0.7 to -0.4 Negative correlation
-1 to -0.7 Significantly negative correlation
bitfinex:BTCUSDのcloseとの相関係数を計算して表示するだけのインジケーターです。
設定を変更すれば任意のチャートと相関係数の計算ができます
0.7 ~ 1.0 かなり強い正の相関がある
0.4 ~ 0.7 正の相関がある
0.2 ~ 0.4 弱い正の相関がある
-0.2 ~ 0 ~ 0.2 ほとんど相関がない
-0.4 ~ -0.2 弱い負の相関がある
-0.7 ~ -0.4 負の相関がある
-1 ~ -0.7 かなり強い負の相関がある
