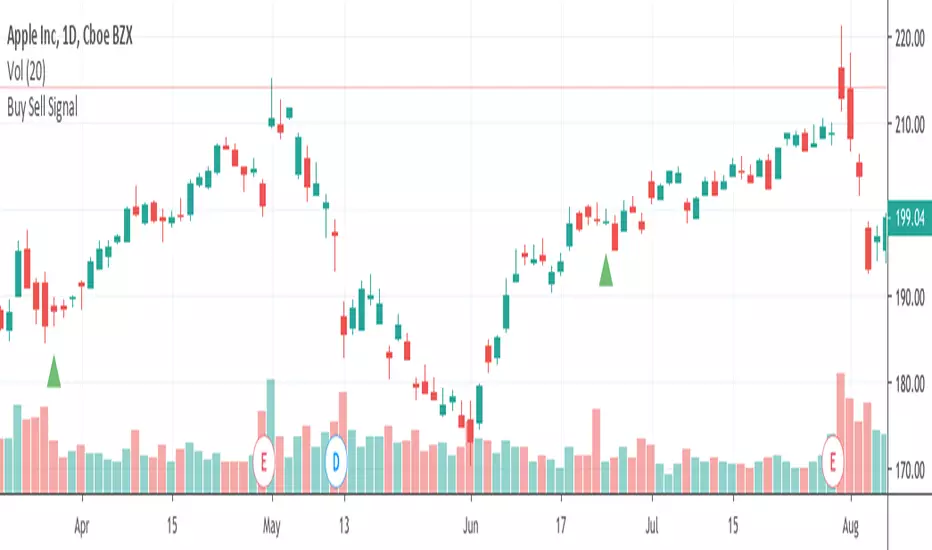
Buy Sell Signals 2Finding the highest winning percentage trade
Work best on stock (1D time frame)
Only available for a month.
If you like it, please message me
Cari dalam skrip untuk "Buy sell"

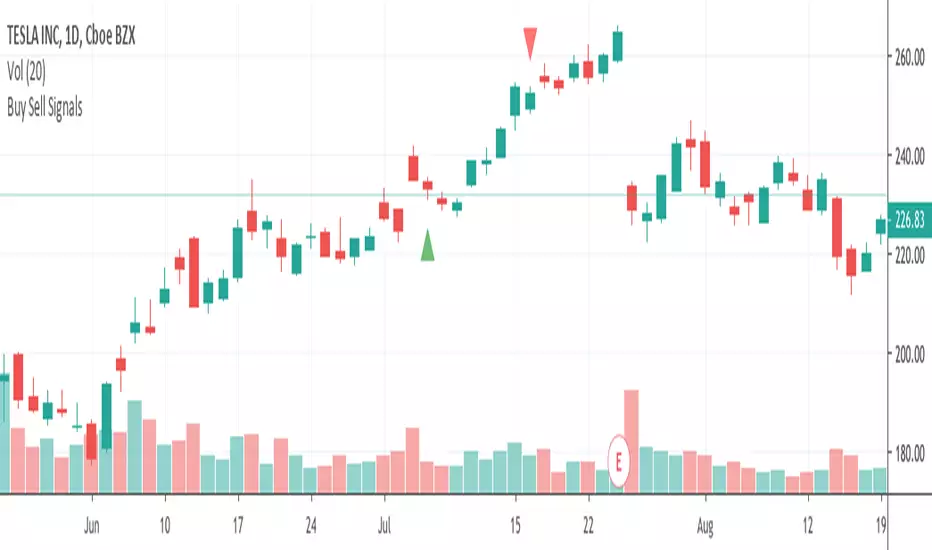
Buy Sell SignalFinding the highest winning percentage trade.
Work best on stock (1D time frame).
Only be available for a month.
If you like it, please message me
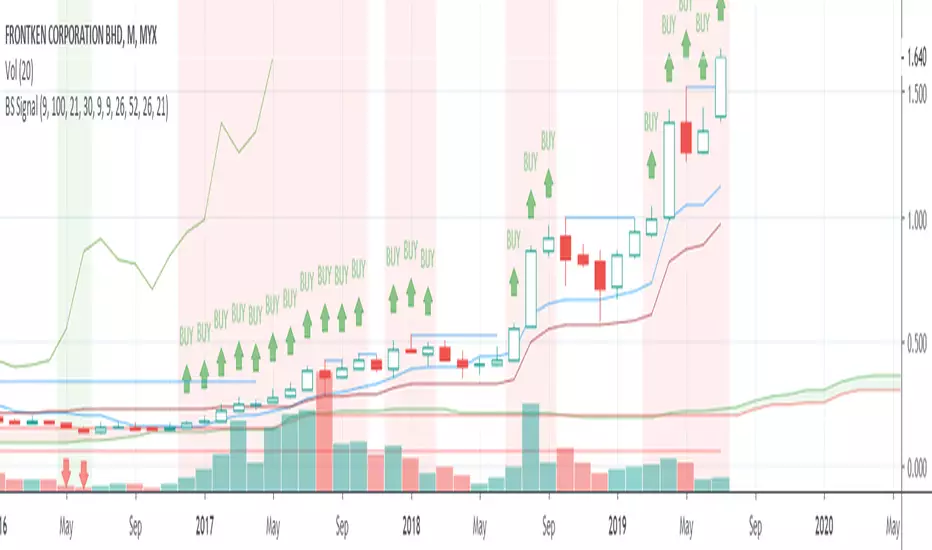
Buy Sell Signals 1Finding the high winning percentage trade signals.
It will be public for a month.
If you like it, please message me

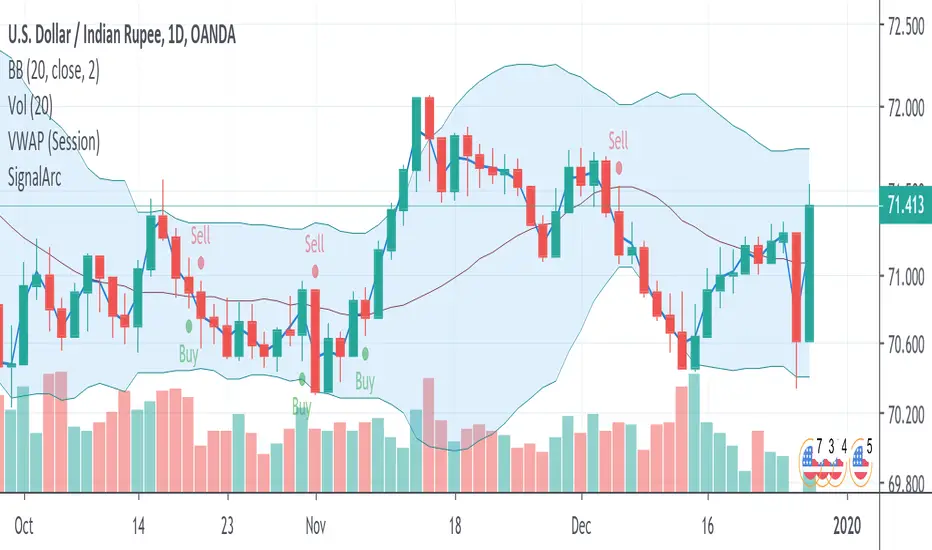
Buy Sell SignalsFinding the high winning percentage trade signals.
It will be public for a month.
If you like it, please message me
Buy Sell SignalsFinding the high winning percentage trade signals.
It will be public for a month.
If you like it, please message me

Buy Sell SignalsFinding the high winning percentage trade signals.
It will be public for a month.
If you like it, please message me

Buy Sell Signal & IchimokuThe script totally based on technical analysis. Indication of "Buy" will appear once the conditions are matched. Please don't follow "Buy" indication if it appear at top of chart.
Yellow candle is a pre-alert for any momentum coming together with increasing of price.
Yellow circle at volume bar is to show that the momentum was there.
Orange line is support & resistance.


Buy SellKıvanc hocanın yazdığı 2 stop loss indikatörünün birleşmesi sonucu bulundu. Çalışma mantığını kullandıkça anlayacaksınızıdır.


Buy Sell signal by Spicytrader
Get on board before going to the moon !
Spicytrader instantly identifies when a potential pump or dump is beginning.
Compatible with Autoview bot
GET ACCESS : spicytrader.com


Buy/Sell Ahmed Rashiedtrade with confidence good for both intra day and long term took me 2 yrs to finish it


UK100 London Judas & IFVG SetupUK100 London Judas & IFVG Setup
Overview This indicator is a specialized trading tool designed to automate the ICT Judas Swing strategy specifically for the UK100 (FTSE 100) index during the London Market Open. It combines institutional time-based logic with price action confirmation using Inversion Fair Value Gaps (IFVG) to identify high-probability reversal setups.
How It Works The strategy is based on the concept that the initial move after the London Open is often a "fake-out" (manipulation) designed to trap retail traders and engineer liquidity before the true trend of the day begins.
Session & Opening Price:
The script marks the London Open price (default 09:00 Warsaw / 08:00 London time) with a dashed line.
This serves as the "line in the sand." Prices moving away from this line initially are monitored for manipulation.
Judas Swing (Liquidity Sweep):
If price moves BELOW the open, it is hunting Sell-Side Liquidity (trapping sellers).
If price moves ABOVE the open, it is hunting Buy-Side Liquidity (trapping buyers).
The Entry Trigger: Inversion FVG (IFVG):
The indicator scans for Fair Value Gaps (FVG) created during the manipulation phase.
BUY Signal: The price manipulates lower, creates a Bearish FVG (Red Box), but then aggressively reverses and closes ABOVE that gap. The gap is now "Inverted" (turns Green), acting as support.
SELL Signal: The price manipulates higher, creates a Bullish FVG (Green Box), but then aggressively reverses and closes BELOW that gap. The gap is now "Inverted" (turns Orange), acting as resistance.
Key Features
Automated Pattern Recognition: No need to manually draw gaps. The script detects valid FVG inversions that align with the Judas Swing logic.
Built-in Risk Calculator: The signal labels display the exact Lot Size you should use based on your account balance and risk percentage (default 0.5%). It calculates this dynamically based on the Stop Loss distance.
Institutional Targets: The indicator fetches H1 Fractals (Liquidity) from the 1-hour timeframe and plots them on your 1-minute chart as blue lines. These are your primary Take Profit (TP) levels.
Stop Loss Visualization: Automatically suggests a Stop Loss placement behind the swing high/low of the reversal structure.
How to Use
Timeframe: Set your chart to 1 Minute (1m).
Asset: UK100 (FTSE 100).
Wait: Allow the London session to open. Watch for price to move away from the opening line.
Execute: When a BUY or SELL label appears:
Enter the trade using the Lot Size shown on the label.
Set your Stop Loss at the price shown on the label.
Target the blue H1 Liquidity lines for profit taking.
Settings
Timezone: Set this to your chart/exchange timezone (Default: Europe/Warsaw).
Account Balance: Input your current trading capital (e.g., 100,000) for accurate risk calculations.
Risk Per Trade %: The percentage of your account you are willing to lose if the Stop Loss is hit (Standard: 0.5% - 1.0%).
Contract Size: The value of 1 point movement (Check your broker's specifications. Usually 1 for CFDs).
Alerts You can set a single alert in TradingView to capture all signals. Select the indicator and choose "Any alert() function call". You will receive a notification with the direction (Buy/Sell), Entry Price, and Lot Size.

Sultan Weekly Level Manager XAUUSDThis script is a comprehensive "Level Management Utility" designed to help traders efficiently map, monitor, and react to their weekly Support and Resistance plans.
Instead of manually drawing rectangles and lines every week, this tool allows traders to input their specific price levels (Buy Zones, Sell Zones, and Invalidation Levels) into the settings. The script then automatically renders these zones, sets up alert conditions, and provides essential technical context (Trend and Momentum) in a single workspace.
Why this is a "Manager" (Use Case): Many traders execute "Level-to-Level" plans. This script streamlines that workflow by:
Visual Automation: Instantly drawing standardized zones based on user inputs.
Context Integration: Unlike simple drawing tools, this script integrates EMA Trend Filters (50/200 EMA) and RSI Momentum monitoring directly alongside the manual levels. This allows the trader to see if a price level is being approached with high momentum (RSI Overbought/Oversold) or against the major trend (EMA Cross), reducing the risk of blind limit orders.
Dashboard: A mini-dashboard tracks the current status (e.g., "Inside Buy Zone 1") so traders can assess the state of their plan at a glance.
How to Use:
Step 1: Open the settings and input your weekly Buy/Sell zone coordinates (High and Low prices). Note: The default values are placeholders; you must update them based on your analysis.
Step 2: Use the Trend Context (EMAs) to decide if you are trading with the flow or against it.
Step 3: Use the Momentum Context (RSI) to wait for overbought/oversold conditions before entering a zone.
Features:
Customizable Zones: 2 Buy Zones, 1 Sell Zone, 1 Invalidation Line.
Confluence Tools: Integrated 50/200 EMA and RSI readout.
Alerts: Built-in alert conditions trigger when price enters any of your defined zones.
Credits:
EMA and RSI logic are based on standard open-source library calculations.
Zone plotting logic utilizes standard Pine Script drawing functions.
