Bollinger Bands Touch MapThis simple script based on Bollinger Bands to collect Touch Point at bandsand display them on the map. Detail of rule as below:
1.Define Touch Point
1.1.Touch Point at Lower Band
+ Key bar:
- Open Price lower than BB lower band, Close Price higher than BB lower band
+ Touch Point:
- Median Price (HL2) of Key bar
1.2.Touch Point at Upper Band
+ Key bar:
- Open Price higher than BB upper band, Close Price lower than BB upper band
+ Touch Point:
- Median Price (HL2) of Key bar
1.3.Zero Point
- Close Price of Current bar
===================================
2.Touch Map
+ Last 5 Touch Point will be show on the map
+ Newest Touch point is numbered as (1) and show at the left of Zero Point
+ Each Point has a label show point's value
===================================
3.Fibonacci
+ Enable: Apply to number of Touch Points indicated
+ Style Up: 0 Level at the bottom
+ Style Down: 0 Level at the top
===================================
4.123 Pattern
+ Pattern: dot 2 and dot 3 at the Top and the Bottom of group 1234
+ M Pattern: dot 3 at the Top of group 135 and at the Bottom of group 234
+ W Pattern: dot 3 at the Bottom of group 135 and at the Top of group 234
===================================
5.Supply Demand Zone
5.1.Supply Zone
+ Supply Zone is area map structure change from upward to downward
+ Supply Zone is limited by 2 dots highest before upward structure broken
5.2.Demand Zone
+ Demand Zone is area map structure change from downward to upward
+ Demand Zone is limited by 2 dots lowest before downward structure broken
============================================================================
6.6.Over Block
6.1.Overbought Block
+ Overbought Block is location Long position covering
+ Ovb Block is limited by higest high and upper band at top of map
6.2.Oversold Block
+ Oversold Block is location Short position covering
+ Ovs Block is limited by lowest low and lower band at bottom of map
===================================
7.RSI Column
+ RSI Overbought is marked by Overbought color
+ RSI Oversold is marked by Oversold color
+ RSI Normal is marked by Normal color
+ Symbol ▲: RSI growing
+ Symbol ▼: RSI falling
===================================
8.Volume Direction
+ Volume growing is marked by Up Color
+ Volume falling is marked by Down Color
+ New Highest Volume on the map is marked by High Color and H Label
+ New Lowest Volume on the map is marked by Low Color and L Label
+ Volume higher than Median level is marked by Up Color and M Label
===================================
9.Useful features
+ Quickly find chart patter: 123, M, W...
+ Quickly find wave patter: I, V, N...
+ Quickly find Key level when moving between different Time Frame
+ Quickly recognize chart is trending or trendless
+ Quickly recognize divergence of Price and Volume
+ Quickly calculate Entry, Stoploss, Takeprofit by using Fibonacci
Cari dalam skrip untuk "COLORED VOLUME"

Tactical Deviation🎯 TACTICAL DEVIATION - Volume-Backed VWAP Deviation Analysis
What Makes This Different?
Unlike basic VWAP indicators, Tactical Deviation combines:
• Multi-timeframe VWAP deviation bands (Daily/Weekly/Monthly)
• Volume spike intelligence - signals only appear with volume confirmation
• Pivot reversal detection at deviation extremes
• Optional multi-VWAP confluence system
• Smart defaults for quality over quantity
This unique combination filters weak setups and identifies high-probability entries at extreme price deviations from fair value.
📊 DEFAULT SETTINGS (Ready to Use)
✅ Daily VWAP with ±2σ deviation bands
✅ Volume spike detection (1.5x average required)
✅ 2σ minimum deviation for signals
❌ Weekly/Monthly VWAPs (enable for multi-timeframe)
❌ Pivot reversal requirement (enable for stronger signals)
❌ Fill zones (optional visual enhancement)
Why: Daily VWAP is most relevant for intraday trading. 2σ bands catch meaningful moves. Volume spikes ensure conviction. Clean chart focuses on what matters.
🚀 HOW TO USE
BASIC USAGE:
• Green triangles (below bars) = Long signals at oversold deviations
• Red triangles (above bars) = Short signals at overbought deviations
SIGNAL QUALITY:
• Normal size, bright colors = Volume spike (best quality)
• Small size, lighter colors = Volume momentum
• Tiny size = No volume confirmation
DEVIATION ZONES:
• ±2σ = Extreme deviation (signals appear here)
• ±1σ to ±2σ = Extended but not extreme
• Within ±1σ = Normal range
TRADING APPROACHES:
Mean Reversion:
→ Enter when price reaches ±2σ with volume spike
→ Target: Return to VWAP or opposite band
→ Stop: Beyond extreme deviation
Trend Continuation:
→ Use bands to identify pullbacks
→ Enter pullback to VWAP in trending market
→ Volume confirms continuation
Reversal Trading:
→ Enable "Require Pivot Reversal" for stronger signals
→ Signals only when deviation + pivot reversal occur
→ Higher probability, fewer signals
⚙️ EXPLORE SETTINGS FOR FULL USE
VWAP SETTINGS:
• Show Weekly/Monthly VWAP = Multi-timeframe context
• Show ±1σ Bands = Normal deviation range
• Show ±3σ Bands = Extreme extremes (rare but powerful)
SIGNAL SETTINGS:
• Min Deviation: 1σ (more signals) | 2σ (default) | 3σ (fewer, extreme only)
• Require Pivot Reversal: OFF (default) | ON (stronger but fewer)
• Volume Spike Threshold: 1.5x (default) | 2.0x+ (major spikes) | 1.2x (more signals)
CONFLUENCE SETTINGS:
• Require Multi-VWAP Confluence: OFF (default) | ON (2+ VWAPs must agree)
• Min VWAPs: 2 (Daily + Weekly/Monthly) | 3 (all must agree)
VISUAL SETTINGS:
• Show Fill Zones = Shaded areas between bands
• Fill Opacity = Transparency adjustment
• Line Widths = Customize thickness
💡 PRO TIPS
1. Start with defaults, then enable features as you learn
2. Volume spike requirement filters weak moves - keep it enabled
3. Enable Weekly/Monthly VWAPs for higher timeframe context
4. Enable confluence for swing trading setups
5. Pivot reversals: ON for reversals, OFF for continuations
6. Check top-right info table for current deviation levels
🎨 VISUAL GUIDE
• Cyan Line = Daily VWAP (fair value)
• Cyan Bands = Daily deviation zones
• Orange Line = Weekly VWAP (if enabled)
• Purple Line = Monthly VWAP (if enabled)
• Green Triangle = Long signal (oversold)
• Red Triangle = Short signal (overbought)
⚠️ IMPORTANT
Educational purposes only. Always use proper risk management. Signals are based on statistical deviation, not guarantees. Volume confirmation improves quality but doesn't guarantee outcomes. Combine with your own analysis.
The unique combination of VWAP deviation analysis, volume profile confirmation, pivot identification, and multi-timeframe confluence in a single clean interface makes Tactical Deviation different from basic VWAP indicators.
Happy Trading! 📈

VRD-5: Volume Reversal Detector (5 Bars)Overview
This Pine Script indicator detects potential trend reversals based on volume patterns over a 5-bar period. It identifies accumulation (bullish) and distribution (bearish) patterns using volume analysis combined with price action.
Key Features
Volume Analysis:
Compares current volume to a 34-period SMA
Identifies strong/weak volume using configurable thresholds
Calculates volume "energy" as a 5-bar average ratio
Pattern Detection:
Bearish Signal: Looks for decreasing volume after a strong volume bar
Bullish Signal: Looks for increasing volume after weak volume bars
Visualization:
Colored volume histogram (bullish/bearish/neutral)
SMA volume line
Labels for detected signals
Customization Options:
Adjustable lookback period (3-10 bars)
Configurable thresholds for volume strength
Strict mode requiring confirming price action
Suggested Improvements
Performance Optimization:
Reduce the max_labels_count (currently 500) to improve performance
Consider using barstate.isconfirmed for more efficient calculations
Enhanced Visualization:
Add arrows on price chart for better visibility
Include a background color highlight for signal periods
Add option to display the energy level as a separate line
Additional Features:
Incorporate RSI or MACD for confirmation
Add multi-timeframe analysis capability
Include a strategy version for backtesting
Code Structure:
Separate the logic into distinct functions for better readability
Add more detailed comments for complex calculations
Consider using varip for real-time updates if needed
User Experience:
Add input options for label text size/position
Include sound options for alerts
Add a toggle for the information table
This indicator provides a solid foundation for volume-based reversal detection that could be further enhanced with these improvements while maintaining its core functionality.

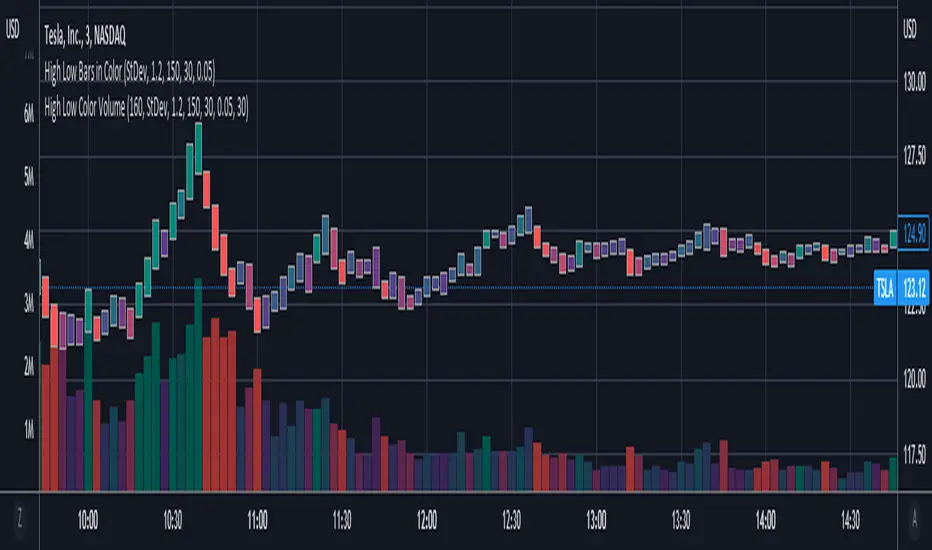
High Low Color VolumeCompanion to High Low Color Bars, for strategies that don't use open and close levels. Color is determined using change in midpoints between high and low ( hl2 ), with degrees of shading based on threshold levels in the settings. The default threshold is 1.2 standard deviations of the change in hl2.
I use this to get a less noisy visual of volume-driven momentum.

SONIC R BREAK FINAL (VER5)
Purpose: Capture breakouts through Support/Resistance (S/R) zones based on Pivot and filter signals using EMA 34 (High/Low/Close), EMA 89, volume, and candle structure. Includes a Higher Timeframe (H4) RSI risk warning (visual only, does not block entries).
How it works
S/R zones from Pivot
Draws Resistance and Support using ta.pivothigh/ta.pivotlow with Left/Right Bars.
S/R lines are locked with offset to reduce repaint.
EMA trend filters
EMA34 High/Low/Close build a “EMA 34 band”.
EMA89 works as the main trend filter.
Trend conditions:
Long: close above all EMA34 High/Low/Close and EMA89.
Short: close below all EMA34 High/Low/Close and EMA89.
Volume filter (optional)
Signal valid only if Volume > SMA(Volume, n).
Wick filter
Each wick (upper/lower) ≤ 50% of candle range to avoid weak breakouts.
Higher TF RSI risk (H4)
Fetches RSI from a higher timeframe (default H4).
If RSI exceeds threshold, breakout labels turn gray (risk warning only).
Anti-repeat mechanism
Each new pivot resets trigger.
Each S/R level triggers only once until the next pivot is formed.
Signals & Alerts
Label “B” (green) below candle: breakout above Resistance, valid EMA/Volume/Wick conditions.
Label “S” (red) above candle: breakout below Support, valid EMA/Volume/Wick conditions.
Gray labels = H4 RSI risk warning.
Unified alert: “S/R Breakout (Unified)” with message B=Buy, S=Sell, Gray=Risk.
Parameters
Show Breaks: toggle breakout detection.
Left/Right Bars: pivot sensitivity.
Require Volume > Average + Volume MA Length: volume filter.
Use H4 RSI Risk Warning: enable higher TF RSI check.
RSI Length, Higher TF (minutes), RSI thresholds for Buy/Sell risk.
Usage tips
Prioritize trades in the same direction as EMA89 and EMA34 trend.
Works on M5 to H4; best combined with RSI H4 when trading M15/M30.
Place SL behind the S/R just broken, TP by fixed RR or EMA trailing.
Increase Left/Right Bars for stronger zones and less noise in sideways markets.
Notes
Pivot still has repaint element (mitigated by offset).
This indicator is not financial advice. Always combine with proper risk management.
Version
Clean v4: added wick ≤50% filter, H4 RSI risk coloring, volume filter, anti-repeat pivot trigger, unified alert, EMA34 H/L/C background shading.
High Low Bars in ColorHigh Low bars de-emphasize open and close levels, but sacrifice color. Because traditional candles use open and close to determine color, a new approach was needed. This script uses change in midpoints between high and low ( hl2 ), with degrees of shading based on threshold levels in the settings. The default threshold is 1.2 standard deviations of the change in hl2 .
Optional "frosting" markers are available for open ("+") and close("x").
Best used in combination with High Low Color Volume .