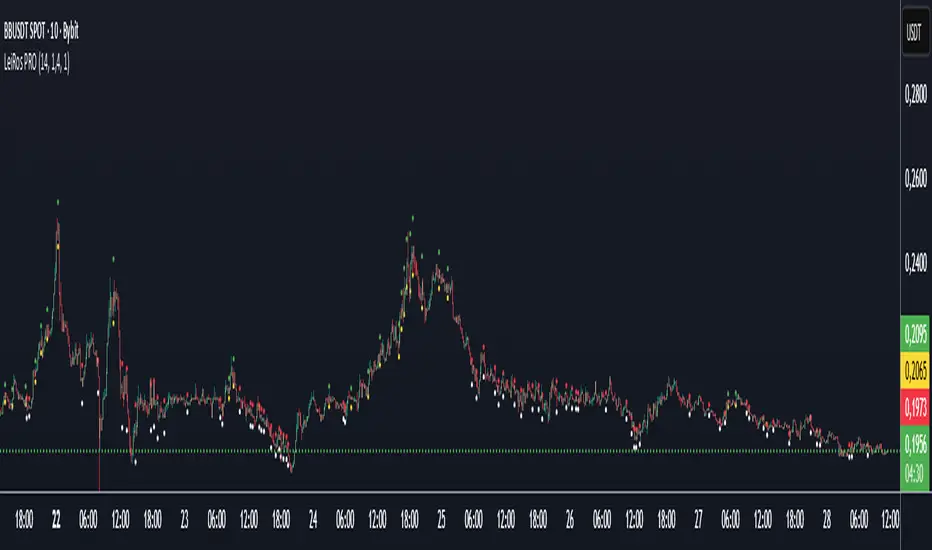
LeiRos PRO — Smart Entry & Target System⚡ Short Description
LeiRos PRO is more than an indicator.
It is an intelligent next-generation analytical tool designed to visualize the true trajectory of market movement.
It reveals the hidden mechanics of price — the attraction points where liquidity is collected and extremes are updated before reversal.
🟢 During bullish phases, the market often reaches for previous highs.
Green points of LeiRos PRO highlight the levels price is most likely to reach before completing the impulse.
⚪ In bearish phases, the market tends to sweep uncollected lows.
White points indicate where stop hunts and local reversals commonly occur.
Built upon the interaction of EMA20 / EMA50 / EMA200, volatility analysis and momentum strength,
LeiRos PRO doesn’t just mark levels — it displays realistic targets price is drawn to with high probability.
📈 The higher the timeframe, the clearer and more stable the picture becomes.
On H1 and above, the plotted points act as reference zones for those seeking structured, logical price behavior rather than noise.
💡 The main advantage of LeiRos PRO is clarity — it removes guessing.
You see where price tends to move and where impulses are likely to end.
This is not theory — it’s market behavior visualized.
📘 Full Description
LeiRos PRO is a proprietary analytical tool created to precisely visualize directional bias, target zones, and protective stop areas.
It combines trend structure, volatility, and price action logic — helping traders see the key areas where the market’s intent becomes clear.
📈 Core Features:
Automatic trend detection: analyzes direction using EMA20, EMA50, and EMA200 to define the dominant side of the market.
Target visualization (Take-Profit): marks potential liquidity-grab zones where price often completes its move.
Protective stop zones (Stop-Loss): highlights areas where logical stops can be placed based on current structure.
Adaptive to timeframe: higher timeframes provide cleaner and more reliable reference points, suitable for short-, medium-, and long-term analysis.
⚙️ Recommended Use:
As a visual analytical tool for confirming trade direction.
On lower TFs — for identifying intraday entry points and potential objectives.
On higher TFs (H1 and above) — for building overall market context and defining major targets.
Marked points are not entry signals,
but contextual reference zones showing potential areas of liquidity collection or impulse completion.
⚠️ Disclaimer:
LeiRos PRO is an analytical and visualization tool, not a trading signal or guarantee of results.
All trading decisions, entries, exits, and risk management remain solely the responsibility of the user.
✳️ Note:
This indicator is part of the LeiRos Project, which develops intelligent systems for advanced market analysis and visualization.
Displayed levels adapt dynamically to volatility and timeframe, providing a flexible view of current market structure.
Cari dalam skrip untuk "Candlestick"
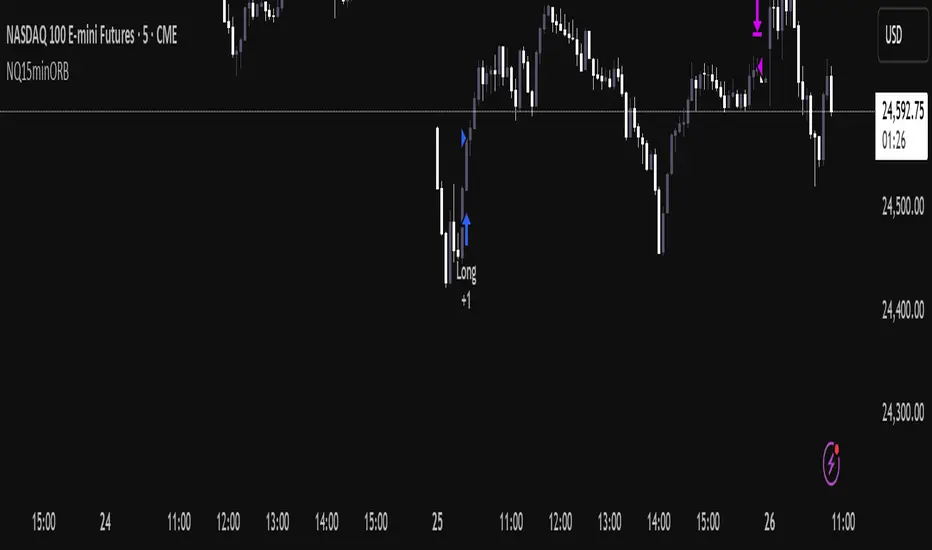
NQ Opening Range BreakoutOpening Range Breakout script with:
Customizable opening range timeframe selection.
Inputs for Risk to Reward ratio, EMAs, Vwap, and ATR sizing to avoid ranges that are too big or too small.
Features a toggle for reversal trades that when enabled will trade the other direction if the initial ORB gets stopped out.
Default it will use the entire opening range to determine stop loss and take profit and if neither the take profit or stop loss is hit it will end the trade at 16:00. There are toggles to use half the opening range as the stop loss and take profit will then be calculated as risk reward ratio * stop loss or you can select entry candle stop loss and risk reward ratio which places the stop loss at the entry candles opening price. There is also a take profit option that will only exit the trade when price closes below (for longs) or above (for shorts) a customizable ema length.
Note that if you have the opening range, for example, selected as 9:30 - 9:45 and are on a 5 minute chart it will enter on the first 5 min closure outside of that range and if you are on a 15 minute chart it will enter on the first 15 min closure outside of that range and so on.
You can automate the entries and exits by using a webhook service and using the strategy’s alerts.
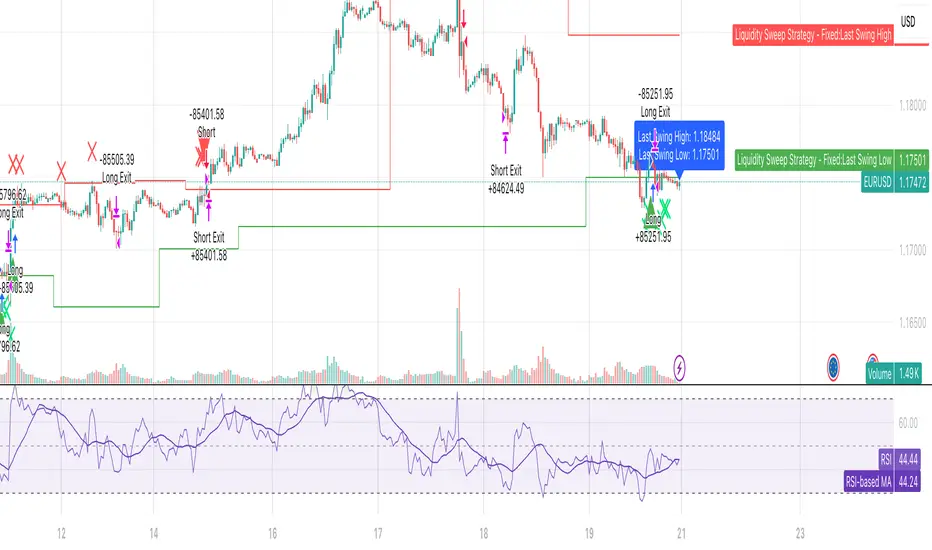
Liquidity SweeperStrategy Overview
This Pine Script implements a Liquidity Sweep Trading Strategy, a sophisticated approach that capitalizes on market manipulation tactics commonly used by institutional traders. The strategy identifies when price "sweeps" above recent swing highs or below swing lows to trigger stop losses and grab liquidity, then quickly reverses direction - creating high-probability trading opportunities.
Core Concept: What is a Liquidity Sweep?
A liquidity sweep occurs when:
Price breaks above a swing high (or below a swing low) to trigger retail stop losses
Institutional players absorb this liquidity at favorable prices
Price quickly reverses back into the previous range
This creates a "fake breakout" or "stop hunt" pattern
The strategy exploits these manipulative moves by entering trades in the direction of the reversal.
How the Strategy Works
1. Swing Point Detection
Uses a lookback period (default: 20 bars) to identify significant swing highs and lows
Employs proper pivot point detection using ta.highestbars() and ta.lowestbars()
Only considers confirmed swing points (not just recent highs/lows)
2. Liquidity Sweep Identification
High Sweep (Short Setup):
Price moves above the last swing high (triggering buy stops)
Same bar closes back below the swing high (showing rejection)
Low Sweep (Long Setup):
Price moves below the last swing low (triggering sell stops)
Same bar closes back above the swing low (showing support)
3. Confirmation Process
Requires price to stay within the swept range for a specified number of bars (default: 3)
This confirms the sweep was genuine and not just normal volatility
Prevents false signals and improves trade quality
4. Entry Logic
Long Entries: Triggered after confirmed low sweeps
Short Entries: Triggered after confirmed high sweeps
5. Risk Management
Stop Loss: Placed at a multiple of ATR (default: 1.5x) from entry price
Take Profit: Risk/Reward ratio based (default: 2:1)
Position Sizing: 10% of equity per trade (configurable)
Red X-crosses: High sweeps detected
Green X-crosses: Low sweeps detected
Red triangles (down): Short entry signals
Green triangles (up): Long entry signals
Horizontal lines: Current swing high/low levels
Info label: Shows last detected swing levels
Optimal Conditions:
Timeframes: 1H, 4H, and Daily work best
Market Conditions: Ranging and trending markets both suitable
Volatility: Moderate to high volatility preferred
Session Times: Most effective during active trading sessions
Strengths:
✅ Exploits institutional manipulation tactics
✅ Clear entry/exit rules with defined risk
✅ Works across multiple asset classes
✅ Includes proper confirmation to reduce false signals
✅ Visual clarity for manual verification
✅ Reasonable risk/reward parameters
Limitations:
⚠️ Requires patience - not a high-frequency strategy
⚠️ Market dependent - fewer signals in low volatility periods
⚠️ Needs sufficient lookback data for swing identification
⚠️ May have drawdown periods during strong trending moves
⚠️ Requires understanding of market structure concepts
Best Practices for Users
Optimization Tips:
Adjust lookback period based on timeframe (shorter for lower TFs)
Test different confirmation periods for your market
Consider market session times when backtesting
Use alongside volume analysis for additional confirmation
Risk Management:
Never risk more than 2-3% per trade of total capital
Consider reducing position size during high-impact news
Monitor correlation if trading multiple pairs simultaneously
Use additional filters (trend, support/resistance) for confluence
Backtesting Recommendations:
Test on at least 6 months of historical data
Include different market conditions (trending, ranging, volatile)
Consider transaction costs and slippage in results
Forward test on demo before live implementation
Expected Results
Based on typical liquidity sweep strategy performance:
Disclaimer
This strategy is based on market structure analysis and institutional trading behavior patterns. Past performance doesn't guarantee future results. Users should:
Thoroughly backtest before live trading
Start with small position sizes
Understand the underlying concepts before implementation
Consider combining with other analysis methods
Always use proper risk management
The strategy works best when traders understand the psychological and structural elements of liquidity sweeps rather than just following signals blindly.
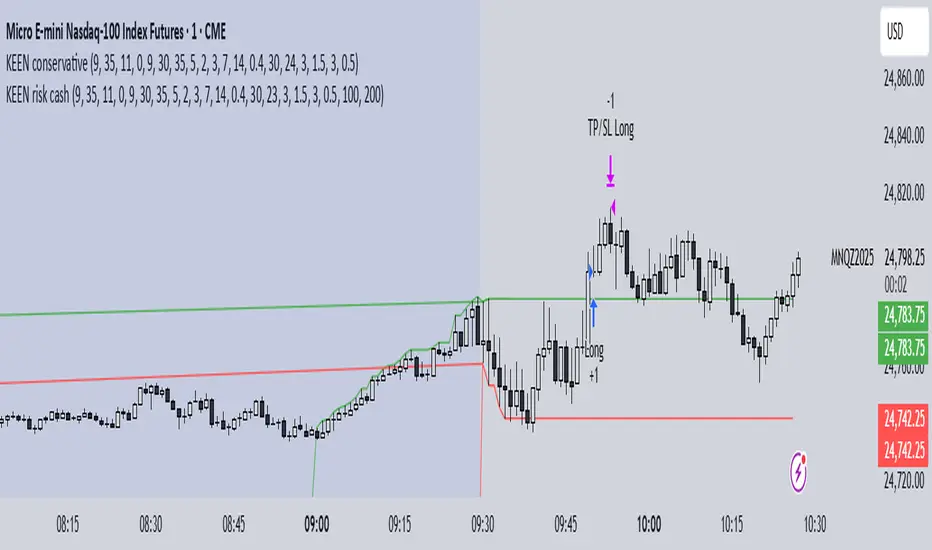
KEEN risk cashthis strategy is based on orb 5 minutes and is set off for risk per trade and take profit.
try yourself and let me know how it works
BSL/SSL Sweep + FVG Strategy Jobin (c) The New York ATM Model is a structured intraday strategy designed to capture algorithmic stop-hunts and reversals during the New York session open. It focuses on liquidity sweeps—either Buy-Side or Sell-Side—followed by a confirmation using Fair Value Gaps (FVGs).

Killzones SMT + IFVG detectorKillzones SMT + IFVG Detector
Summary
This strategy implements a specific intraday workflow inspired by ICT-style concepts.
It combines:
Killzone session levels (recording untouched highs/lows)
SMT divergence between NQ and ES (exclusive sweep logic)
IFVG confirmation (3-bar imbalance + width filter + inversion guard)
and an optional smart exit engine
The components are not simply mashed together: they interact in sequence.
A setup only confirms if all conditions line up (time window → untouched level sweep → divergence → valid IFVG → confirmation candle → risk filter).
Workflow
Killzones & session levels
Tracks highs/lows inside default killzones (19:00–23:00, 01:00–04:00, 08:30–10:00, 11:00–12:00, 12:30–15:00, chart timezone).
Stores untouched levels forward; sweeps trigger candidate signals.
SMT divergence (exclusive sweep)
Bullish SMT : one index sweeps its low while the other remains above its session low.
Bearish SMT : one index sweeps its high while the other remains below its session high.
Detection supports “Sweep (Cross)” or “Exact Tick.”
Session IDs are tracked so once a side has fired, later re-touches can’t re-trigger .
IFVG confirmation
Locks the first valid 3-bar IFVG after SMT.
Confirmation requires a candle close beyond the IFVG boundary in the direction of the close.
IFVGs must meet a minimum width filter (default 1.0 point).
Inversion guard: ignores IFVGs already inverted before SMT.
Optional “re-lock” keeps tracking the latest IFVG until confirmation/expiry.
Smart exit engine
Initial stop from opposite wick (+ buffer).
Fixed TP (default 40 points).
Dynamic stop escalation at progress thresholds (BE → 50% → 80% of target).
Safety gates
Weekend lockout (Fri 16:40 → Sun 18:00).
Same-bar sweep of high & low cancels setups.
Max initial stop filter skips oversized setups.
Optional cooldown bars.
Alerts
SMT Bullish/Bearish : divergence detected this bar.
Confirm Long/Short : IFVG confirmation triggered.
Default Strategy Properties (used in screenshots/backtests)
Initial capital: $25,000
Order size: 1 contract
Commission: $1.25 per contract per side
Slippage: 2 ticks
Backtest window: Jun 16, 2025 – Sep 14, 2025
These settings are intentionally conservative. If you change them, your results will differ.
How to use
Apply on an NQ or ES futures chart (1–5 min).
Choose your killzones and detection mode.
Select confirmation symbol (NQ, ES, or “Sweeper”).
Enable/disable IFVG re-lock.
Review signals and use alerts for automation if desired.
Limitations
Strict filters reduce trade count; extend backtest window for more samples.
Works best on NQ/ES; not validated elsewhere.
Past performance is not indicative of future results.
This is an educational tool ; not financial advice.

Structure Strategycreated to spot key area needed to take valid trades in most market conditions. use beside RSI MACD

Hilly's Reversal Scalping Strategy - 5 Min CandlesHow to Use
Copy the Code: Copy the script above.
Paste in TradingView: Open TradingView, go to the Pine Editor (bottom of the chart), paste the code, and click “Add to Chart.”
Set Timeframe: Ensure the chart is set to 5-minute candles (TradingView: right-click chart > Timeframe > 5 Minutes).
Check for Errors: Verify no errors appear in the Pine Editor console.
Apply to Chart: Use a liquid crypto pair (e.g., BTC/USDT, ETH/USDT on Binance or Coinbase).
Verify Signals:
Green “BUY” labels and triangle-up arrows for bullish reversals (e.g., bullish engulfing, hammer, doji, morning star, three white soldiers, double bottom in a downtrend).
Red “SELL” labels and triangle-down arrows for bearish reversals (e.g., bearish engulfing, shooting star, doji, evening star, three black crows, double top in an uptrend).
Green/red background highlights for signal candles.
Backtest: Use TradingView’s Strategy Tester to evaluate performance over 1–3 months, checking Net Profit, Win Rate, and Drawdown.
Demo Test: Run on a demo account to confirm signal visibility and performance before trading with real funds.
Troubleshooting
If Errors Occur: If any errors appear in TradingView’s Pine Editor console (e.g., “Syntax error” or “Invalid argument”), please share the exact error messages to diagnose environment-specific issues.
Signal Overload: If too many signals appear, increase patternLookback to 15 or set volFilter = volume > volMa * 2.0.
Missed Signals: If signals are too rare, set useVolumeFilter=false or reduce patternLookback to 5.
Additional Features: If you need alerts, other indicators (e.g., EMA, RSI), or dynamic arrow sizing, please specify. Note that dynamic sizing caused errors previously, so I’ve kept size=size.normal.

Hilly 3.0 Advanced Crypto Scalping Strategy - 1 & 5 Min ChartsHow to Use
Copy the Code: Copy the script above.
Paste in TradingView: Open TradingView, go to the Pine Editor (bottom of the chart), paste the code, and click “Add to Chart.”
Check for Errors: Verify no errors appear in the Pine Editor console. The script uses Pine Script v5 (@version=5).
Select Timeframe:
1-Minute Chart: Use defaults (emaFastLen=7, emaSlowLen=14, rsiLen=10, rsiOverbought=80, rsiOversold=20, slPerc=0.5, tpPerc=1.0, useCandlePatterns=false, patternLookback=10).
5-Minute Chart: Adjust to emaFastLen=9, emaSlowLen=21, rsiLen=14, rsiOverbought=75, rsiOversold=25, slPerc=0.8, tpPerc=1.5, useCandlePatterns=true, patternLookback=10.
Apply to Chart: Use a liquid crypto pair (e.g., BTC/USDT, ETH/USDT on Binance or Coinbase).
Verify Signals:
Green “BUY” or “EMA BUY” labels and triangle-up arrows below candles for bullish signals (EMA crossovers, bullish engulfing, hammer, doji, morning star, three white soldiers, double bottom).
Red “SELL” or “EMA SELL” labels and triangle-down arrows above candles for bearish signals (EMA crossovers, bearish engulfing, shooting star, doji, evening star, three black crows, double top).
Green/red background highlights for signal candles.
Backtest: Use TradingView’s Strategy Tester to evaluate performance over 1–3 months, checking Net Profit, Win Rate, and Drawdown.
Demo Test: Run on a demo account to confirm signal visibility and performance before trading with real funds.

C25_EngulfingEngulfing Testing Script. Best used for 5m MNQ futures. Can work on others with tweaks to parameters

7Lots v27Lots strategy
The strategy is a counter-trend with a return to the moving average. Based on the DCA strategy, but greatly simplified to 7 lots (limit orders) and using the default martingale x2.5
Strategy description
Two moving averages are used. The first MA can be used as a filter for opening a position and also closing if the second MA is disabled. If both are enabled, then the position is closed by the second MA, and the first is used as a filter. There is also a separate take profit and if the price does not reach it, the position will be closed when returning to the MA, which will act as a stop loss, but the risk of liquidation is still present since the strategy does not have a regular classic stop loss.
Main parameters
TP & SL - selection of closing a position only by MA or take profit + MA. If only MA is selected, the strategy ignores the take profit value and always closes the position by MA.
MA settings
MA length from 1 to 200
Sliding type ALMA, SMA, EMA, VWMA, WMA, RMA
MA data - Open, High, Low, Close, HL2, HL3, OHLC4, OC2
MA shift in %. The MA shift is set in % above or below the current prices. For the First MA, this function allows you to use it as a filter for opening a position. For example, if you specify a shift much lower, for example -1% or -2%, then there will be less noise for opening a position, but this affects the number of transactions.
DCA group settings
Take profit %. Set the take profit as usual, but if the price does not reach the take profit, then the closing will occur by MA when the price returns to its values.
Take profit from. There is a choice of take profit from the average position, or by closing the previous bar. The latter increases the profit factor, but also increases the risk of liquidation if the strategy is used on perpetual contracts or futures.
Position Entry % - specifies the condition for opening a position. 0% - opening will occur immediately. 2% - opening will occur when the price falls 2% below the bar closing if the Long mode is set. If Short, then vice versa.
Grid Scale - classic progressive grid step
Next comes the setup of lots as a percentage of the deposit. Simply specify how many percent of each lot will be used from the total deposit. By default, a percentage for each lot is already allocated according to Martingale with a multiplier of x2.5, but you can calculate your own. You can specify 0, then the lot will be disabled.
Leverage. By default, 1.
Extra lot. This is the 7th lot that I decided to allocate separately from the main grid, since it is not always really needed. And it is calculated from the last lot of the grid. You can set it to how much lower percentage of the last lot to set it for and also what percentage of the deposit it will use. If you trade futures, then this lot, as an auxiliary one, can greatly average the position in case of strong volatility in the market.
Next, you can specify the start and end dates of transactions.
The table displays the total percentage of the deposit involved in trading at the moment. By default, all lots and leverage are set to 100% deposit load. The table also shows the number of transactions of the last 5-6 lots and extra, so that you can understand how many of them there were throughout the history of trading and possibly draw some conclusions for yourself. Especially useful for extra lots. Max Historical Drawdown (%) shows the historical price drop at the moment from the average open position. This will make it possible to analyze what leverage this strategy could withstand over the entire trading history. The date of this drop is also indicated.
For novice traders, it is recommended to use only on spot without the risk of liquidation. It is also best to use large time frames to see the whole picture, but you can also use a minute chart, there are no restrictions, everything is in your hands.
Tips. If you use minute charts, it is better to greatly increase the length of the MA from 20 and above. Hourly charts from 1-7. It is better to set up on spot and if you need futures, then use the same settings from spot, but with correction for futures. This strategy does not work well in Short, but shows excellent results for Long even when the market falls. When selecting settings, take into account sharp market fluctuations, Max Historical Drawdown (%) will show you this information in the table. You need to set up from the first MA, when you set up for the best result, then turn on the second MA and transfer the settings of the first MA to the second. Then fine-tune both MAs. The results can increase significantly, but this is not always the case. Sometimes just one MA is enough
The strategy is paid, tested with my own experience and money since 2022. Own development for opening a position.

Ajay Nayak - EMA ATR Trailinge strategy RSI aur RSI ke SMA ke crossover par CALL aur PUT signal generate karti hai.
Saath me ATR based stoploss aur crossover target bhi diya gaya hai.
Algo trading ke liye useful hai.

Hilly 2.0 Advanced Crypto Scalping Strategy - 1 & 5 Min ChartsHow to Use
Copy the Code: Copy the script above.
Paste in TradingView: Open TradingView, go to the Pine Editor (bottom of the chart), paste the code, and click “Add to Chart.”
Check for Errors: Verify no errors appear in the Pine Editor console. The script uses Pine Script v5 (@version=5).
Select Timeframe:
1-Minute Chart: Use defaults (emaFastLen=7, emaSlowLen=14, rsiLen=10, rsiOverbought=80, rsiOversold=20, slPerc=0.5, tpPerc=1.0, useCandlePatterns=false).
5-Minute Chart: Adjust to emaFastLen=9, emaSlowLen=21, rsiLen=14, rsiOverbought=75, rsiOversold=25, slPerc=0.8, tpPerc=1.5, useCandlePatterns=true.
Apply to Chart: Use a liquid crypto pair (e.g., BTC/USDT, ETH/USDT on Binance or Coinbase).
Verify Signals:
Green “BUY” or “EMA BUY” labels and triangle-up arrows below candles.
Red “SELL” or “EMA SELL” labels and triangle-down arrows above candles.
Green/red background highlights for signal candles.
Arrows use size.normal for consistent visibility.
Backtest: Use TradingView’s Strategy Tester to evaluate performance over 1–3 months, checking Net Profit, Win Rate, and Drawdown.
Demo Test: Run on a demo account to confirm signal visibility and performance before trading with real funds.

swapstrategy-Reversal StrategyGenerate buy and sell signals and reverses position when chart turn buy or sell side

NIFTY_2min_FVG_Buy_StrategySummary
This strategy is designed for scalping Nifty on a 2-minute chart, focusing exclusively on long entries. The script's purpose is to identify and act on specific bullish reversal patterns based on volume analysis and price action.
Concept & Core Logic
The strategy operates on a two-stage confirmation process:
Volume Absorption: The initial condition seeks to identify potential bullish reversals by detecting signs of selling pressure being absorbed by buyers. This suggests that a downward move may be losing momentum.
Fair Value Gap (FVG) Confirmation: After a volume absorption signal, the strategy waits for a Fair Value Gap (FVG) to appear. A long entry signal is generated only after a candle closes above the FVG zone, serving as confirmation of bullish intent.
Risk Management
The strategy employs a fixed take profit and stop loss for each trade, based on the Nifty underlying price:
Take Profit: The exit signal is triggered when a trade reaches a 25-point profit.
Stop Loss: The exit signal is triggered when a trade reaches a 30-point loss.
Intended Use
This tool is intended for traders who:
Utilize mechanical, rule-based systems for intraday trading and scalping.
Are interested in studying a structured approach that combines volume analysis with price action inefficiencies like Fair Value Gaps.

Rev Smart Pivot V5.0 by SJKimRev Smart Pivot V5.0 by SJKim
Rev Smart Pivot V5.0 by SJKim
Rev Smart Pivot V5.0 by SJKim

fero.Laplace + MA TP/SL Strategy (10m)//@version=5Labne is a good technique for generating logic or theory.

fero.karma algoUnderstand what stocks, currencies (forex), and cryptocurrencies are. Learn common terms like bull market, bear market, volatility, and liquidity.
Study Analysis: There are two main types of analysis:

Intraday Alpha Pro - ORB + Trend/MomentumOverview
This is a pure intraday trading strategy designed for active traders seeking to capitalize on short-term price movements using two complementary modules: Opening Range Breakout (ORB) and Trend/Momentum. The strategy operates strictly within a user-defined trading session, automatically flattening all positions at session end to avoid overnight carry. It employs a points-based exit system with a trailing stop that activates only after the target is reached, ensuring disciplined risk management. Optional Martingale position sizing is included for users who prefer aggressive scaling after losses.Key Features Pure Intraday, No Carry: Trades are confined to a user-defined session (default: 9:15 AM–3:25 PM, Monday–Sunday). All positions are closed at session end.
Non-Repainting: Entries are evaluated only on confirmed bar closes (barstate.isconfirmed), ensuring no lookahead or repainting.
Dual Signal Modules: Opening Range Breakout (ORB): Captures breakouts above/below the high/low of a user-defined opening range (default: 9:15 AM–9:30 AM).
Trend/Momentum: Combines EMA (9/21) crossovers, RSI filters, volume confirmation, and an optional 200-period MA trend filter for robust trend-following signals.
Points-Based Exits: Uses fixed stop-loss (slPoints, default 16 points) and take-profit (tpPoints, default 32 points) distances. Once the take-profit level is reached, a trailing stop (trailDistPts, default 10 points) activates, ratcheting monotonically to lock in gains.
Martingale Sizing (Optional): Allows position size increases after losses (up to maxQtyInput) with a reset option after wins.
Cooldown Period: Prevents immediate re-entries after exits using a configurable cooldown (cooldownBars).
Flexible Inputs: Toggle long/short entries, enable/disable ORB or Trend/Momentum modules, and customize all parameters (e.g., MA lengths, RSI thresholds, volume multiplier).
Visuals & Alerts: Plots ORB high/low lines and moving averages (9, 21, 200). Includes alerts for long/short entries and end-of-day flattening.
How It Works Session Management: Trades only within the specified tradeSes (default: 9:15 AM–3:25 PM). The ORB module uses a separate orbSes (default: 9:15 AM–9:30 AM) to calculate breakout levels. Positions are closed automatically at session end.
Entry Conditions: ORB: Long when price closes above the ORB high after the ORB session ends; short when price closes below the ORB low.
Trend/Momentum: Long on fast MA (default EMA 9) crossing above slow MA (default EMA 21), with RSI above rsiBuy (default 55), volume exceeding volMult (default 1.5x prior bar), and price above the 200-period MA (if enabled). Shorts use the inverse.
Exit Logic: Stop-loss is set at entry price ± slPoints.
Take-profit is monitored using a running high/low since entry. Once price moves tpPoints in profit, the stop trails at trailDistPts behind the current price, adjusting only in the favorable direction (never loosening).
Exits use strategy.exit with stop only (no limit orders).
Position Sizing: Default size is baseQtyInput (minimum 1 contract). With useMartingale enabled, size increases by martingaleFactor after a loss, capped at maxQtyInput. If resetOnWin is true, size resets to baseQtyInput after a winning trade.
Cooldown: After an exit, no new trades are allowed for cooldownBars to prevent overtrading.
Futures-Safe Volume: Volume filter accommodates markets with missing or zero volume data (e.g., futures), ensuring signals aren’t blocked unnecessarily.
Inputs Trading Session: tradeSes (e.g., "0915-1525:1234567") and orbSes (e.g., "0915-0930:1234567").
Toggles: enableLong, enableShort, useORB, useTrendMom, useTrendFilter (200-MA).
Trend/Momentum: maType (EMA/SMA), fastLen (9), slowLen (21), trendLen (200), rsiLen (14), rsiBuy (55), rsiSell (45), volMult (1.5).
Exits: slPoints (16), tpPoints (32), trailDistPts (10).
Martingale: useMartingale, baseQtyInput, maxQtyInput, martingaleFactor, resetOnWin.
Cooldown: cooldownBars (1).
Legacy (Ignored): tp1RR, tp2RR, tp3RR, tp1Pct, tp2Pct, tp3Pct, stepTrail for backward compatibility.
Usage Notes Best suited for liquid, intraday markets (e.g., futures like ES, NQ, or forex pairs).
Adjust slPoints, tpPoints, and trailDistPts to match instrument volatility.
Use useMartingale cautiously, as it increases risk after losses.
Ensure tradeSes and orbSes align with your market’s trading hours.
Alerts can be set for long/short entries and EOD flattening.
The strategy avoids lookahead and repainting, ensuring reliability in live trading.
Risk Warning
Trading involves significant risk. Backtest thoroughly and use appropriate risk management. The Martingale option can amplify losses if not carefully monitored. Past performance is not indicative of future results.

FVG Ultra Assertive - Individual Filters (mtbr)FVG Ultra Assertive - Individual Filters (mtbr)
What this script offers:
This strategy detects and highlights FVGs (Fair Value Gaps) on the chart, providing traders with a visual and systematic approach to identify potential price inefficiencies. The script plots bullish and bearish FVG zones using customizable boxes and labels, allowing users to easily spot high-probability trading areas. In addition, it opens and closes simulated trades based on the detected FVGs, enabling full backtesting and strategy performance evaluation. It integrates multiple independent filters to validate the strength of each FVG signal before entering a trade.
How it works:
The script identifies:
Bullish FVGs when the current low is higher than the high of two bars ago.
Bearish FVGs when the current high is lower than the low of two bars ago.
Once an FVG is detected, it applies three optional independent filters:
GAP/ATR Filter:
Measures the FVG size relative to the Average True Range (ATR). Only gaps exceeding a user-defined multiple of ATR are considered valid.
Support/Resistance (S/R) Filter:
Uses pivot points to check if the FVG overlaps with recent high/low pivot levels within a tolerance percentage. This ensures the gap aligns with meaningful market levels.
Stochastic Filter:
Applies a stochastic oscillator to confirm momentum. Bullish FVGs are validated when stochastic values are oversold, and bearish FVGs when overbought.
After passing the selected filters, the strategy opens trades:
LONG FVG for bullish signals (buy)
SHORT FVG for bearish signals (sell)
The strategy automatically closes positions when an opposite signal appears, generating a backtest report with trades, profits, and statistics. The final bullish or bearish FVG signals are plotted as colored boxes on the chart with labels “BULL FVG” or “BEAR FVG” for immediate visual reference.
How to configure it for use:
Use GAP/ATR Filter: Enable or disable the ATR-based filter and adjust the ATR period (ATR Length) and minimum gap multiplier (Minimum Gap x ATR).
Use S/R Filter: Enable or disable the pivot-based S/R filter. Configure the pivot lookback periods (Pivot Left and Pivot Right) and the tolerance percentage (Gap Tolerance %).
Use Stochastic Filter: Enable or disable stochastic confirmation. Adjust the K and D lengths (Stoch K Length and Stoch D Length) and the overbought/oversold thresholds (Stoch Overbought and Stoch Oversold).
Colors: Customize the colors for bullish and bearish FVGs (FVG Bull and FVG Bear) to match your chart preferences.
Usage Tips:
Apply this strategy to any timeframe; shorter timeframes generate more frequent FVGs, while higher timeframes highlight stronger gaps.
Combine FVG signals with other technical analysis tools for better trade confirmation.
Use the box and label visualization to quickly scan charts for trade opportunities without cluttering the chart.
The strategy’s trades (LONG and SHORT) provide backtesting results and performance statistics for each signal.

Advanced Supertrend ADX Strategy with Highest ReturnOverview
This sophisticated trading strategy combines the proven Supertrend indicator with advanced momentum filters and trend strength analysis to identify high-probability long entries in trending markets.
Key Features
✅ Supertrend-Based Signals: Uses optimized ATR calculations for reliable trend detection
✅ Advanced Momentum Filtering: Multiple proprietary momentum filters ensure entry quality
✅ Trend Strength Validation: ADX-based confirmation prevents false signals in weak trends
✅ Intelligent Risk Management: Dynamic stop-loss system based on price action
✅ Visual Stop Loss Indicators: Clear visual representation of risk levels
How It Works
The strategy enters long positions when:
Supertrend indicator confirms bullish trend reversal
Proprietary momentum conditions align for optimal entry timing
Trend strength exceeds minimum threshold (ADX > 20)
Multiple timeframe momentum filters confirm signal quality
Ideal For
Trending markets (stocks, forex, crypto, indices)
Swing trading timeframes (15m to 4H work best)
Traders seeking systematic, rule-based entries
Risk-conscious traders wanting clear stop levels
Settings
ATR Period: Adjustable for different volatility environments (default: 10)
Supertrend Factor: Fine-tune sensitivity (default: 3.0)
ADX Parameters: Customize trend strength requirements
Performance Notes
Long-only strategy optimized for uptrending markets
Works best in trending conditions, may underperform in choppy markets
Designed for systematic execution with clear entry/exit rules
Disclaimer
Past performance does not guarantee future results. Always use proper risk management and position sizing appropriate for your account size. This is just for education purpose only and not recomanded for trading in s


VWAP Executor — v6 (VWAP fix)tarek helishPractical scalping plan with high-rate (sometimes reaching 70–85% in a quiet market)
Concept: “VWAP bounce with a clear trend.”
Tools: 1–3-minute chart for entry, 5-minute trend filter, VWAP, EMA(50) on 5M, ATR(14) on 1M, volume.
When to trade: London session or early New York session; avoid 10–15 minutes before/after high-impact news.
Entry rules (buy for example):
Trend: Price is above the EMA(50) on 5M and has an upward trend.
Entry zone: First bounce to VWAP (or a ±1 standard deviation channel around it).
Signal: Bullish rejection/engulfing candle on 1M with increasing volume, and RSI(2) has exited oversold territory (optional).
Order: Entry after the confirmation candle closes or a limit close to VWAP.
Trade Management:
Stop: Below the bounce low or 0.6xATR(1M) (strongest).
Target: 0.4–0.7xATR(1M) or the previous micro-high (small return to increase success rate).
Trigger: Move the stop to breakeven after +0.25R; close manually if the 1M candle closes strongly against you.
Filter: Do not trade if the spread widens, or the price "saws" around VWAP without a trend.
Sell against the rules in a downtrend.
Why this plan raises the heat-rate? You buy a "small discount" within an existing trend and near the institutional average price (VWAP), with a small target price.
مواقعي شركة الماسة للخدمات المنزلية
شركة تنظيف بالرياض
نقل عفش بالرياض
