PowerZone Trading StrategyExplanation of the PowerZone Trading Strategy for Your Users
The PowerZone Trading Strategy is an automated trading strategy that detects strong price movements (called "PowerZones") and generates signals to enter a long (buy) or short (sell) position, complete with predefined take profit and stop loss levels. Here’s how it works, step by step:
1. What is a PowerZone?
A "PowerZone" (PZ) is a zone on the chart where the price has shown a significant and consistent movement over a specific number of candles (bars). There are two types:
Bullish PowerZone (Bullish PZ): Occurs when the price rises consistently over several candles after an initial bearish candle.
Bearish PowerZone (Bearish PZ): Occurs when the price falls consistently over several candles after an initial bullish candle.
The code analyzes:
A set number of candles (e.g., 5, adjustable via "Periods").
A minimum percentage move (adjustable via "Min % Move for PowerZone") to qualify as a strong zone.
Whether to use the full candle range (highs and lows) or just open/close prices (toggle with "Use Full Range ").
2. How Does It Detect PowerZones?
Bullish PowerZone:
Looks for an initial bearish candle (close below open).
Checks that the next candles (e.g., 5) are all bullish (close above open).
Ensures the total price movement exceeds the minimum percentage set.
Defines a range: from the high (or open) to the low of the initial candle.
Bearish PowerZone:
Looks for an initial bullish candle (close above open).
Checks that the next candles are all bearish (close below open).
Ensures the total price movement exceeds the minimum percentage.
Defines a range: from the high to the low (or close) of the initial candle.
These zones are drawn on the chart with lines: green or white for bullish, red or blue for bearish, depending on the color scheme ("DARK" or "BRIGHT").
3. When Does It Enter a Trade?
The strategy waits for a breakout from the PowerZone range to enter a trade:
Buy (Long): When the price breaks above the high of a Bullish PowerZone.
Sell (Short): When the price breaks below the low of a Bearish PowerZone.
The position size is set to 100% of available equity (adjustable in the code).
4. Take Profit and Stop Loss
Take Profit (TP): Calculated as a multiple (adjustable via "Take Profit Factor," default 1.5) of the PowerZone height. For example:
For a buy, TP = Entry price + (PZ height × 1.5).
For a sell, TP = Entry price - (PZ height × 1.5).
Stop Loss (SL): Calculated as a multiple (adjustable via "Stop Loss Factor," default 1.0) of the PZ height, placed below the range for buys or above for sells.
5. Visualization on the Chart
PowerZones are displayed with lines on the chart (you can hide them with "Show Bullish Channel" or "Show Bearish Channel").
An optional info panel ("Show Info Panel") displays key levels: PZ high and low, TP, and SL.
You can also enable brief documentation on the chart ("Show Documentation") explaining the basic rules.
6. Alerts
The code generates automatic alerts in TradingView:
For a bullish breakout: "Bullish PowerZone Breakout - LONG!"
For a bearish breakdown: "Bearish PowerZone Breakdown - SHORT!"
7. Customization
You can tweak:
The number of candles to detect a PZ ("Periods").
The minimum percentage move ("Min % Move").
Whether to use highs/lows or just open/close ("Use Full Range").
The TP and SL factors.
The color scheme and what elements to display on the chart.
Practical Example
Imagine you set "Periods = 5" and "Min % Move = 2%":
An initial bearish candle appears, followed by 5 consecutive bullish candles.
The total move exceeds 2%.
A Bullish PowerZone is drawn with a high and low.
If the price breaks above the high, you enter a long position with a TP 1.5 times the PZ height and an SL equal to the height below.
The system executes the trade and exits automatically at TP or SL.
Conclusion
This strategy is great for capturing strong price movements after consolidation or momentum zones. It’s automated, visual, and customizable, making it useful for both beginner and advanced traders. Try it out and adjust it to fit your trading style!
Cari dalam skrip untuk "Candlestick"

Gold Scalping BOS & CHoCHThis strategy is designed for scalping gold (XAU/USD) on the 3-minute timeframe, utilizing Break of Structure (BOS) and Change of Character (CHoCH) to identify high-probability trade setups. Unlike traditional SMA crossover strategies, this method focuses purely on price action and market structure shifts, allowing for early entries and better risk management.
Core Concepts:
Break of Structure (BOS) – Confirms a continuation of the trend when price breaks the last swing high (bullish) or last swing low (bearish).
Change of Character (CHoCH) – Detects possible trend reversals by identifying a shift in market momentum.
Dynamic Support & Resistance – Uses the last 10-bar highs and lows to determine adaptive stop-loss (SL) and take-profit (TP) levels.
Risk-to-Reward Ratio (1:2 RR) – Ensures trades are executed with a favorable risk/reward ratio.
Entry Conditions:
Buy Entry:
BOS (Bullish) confirmed (price breaks the previous swing high).
CHoCH (Bullish) confirms trend shift.
Price crosses back above the last swing low (confirmation of support).
Sell Entry:
BOS (Bearish) confirmed (price breaks the previous swing low).
CHoCH (Bearish) confirms trend shift.
Price crosses back below the last swing high (confirmation of resistance).
Exit Conditions:
Stop Loss (SL): Set at the most recent dynamic support (for buys) or resistance (for sells).
Take Profit (TP): 2x the risk (1:2 risk-reward ratio).
Advantages of This Strategy:
✅ No lagging indicators – Uses price action for real-time entries.
✅ High probability setups – Focuses only on strong structural breaks.
✅ Adaptive SL/TP – Uses real market structure instead of fixed values.
✅ Optimized for Scalping – Best suited for quick in-and-out trades.
Best Time to Trade:
🔹 London & New York Sessions (High volatility for gold).

Premarket Gap MomoTrader(SC)🚀 Pre-Market Momentum Trader | Dynamic Position Sizing 🔥
📈 Trade explosive pre-market breakouts with confidence! This algorithmic strategy automatically detects high-momentum setups, dynamically adjusts position size, and ensures risk control with a one-trade-per-day rule.
⸻
🎯 Key Features
✅ Pre-Market Trading (4:00 - 9:30 AM EST) – Only trades during the most volatile session for early breakouts.
✅ Dynamic Position Sizing – Adapts trade size based on candle strength:
• ≥90% body → 100% position
• ≥85% body → 50% position
• ≥75% body → 25% position
✅ 1 Trade Per Day – Avoids overtrading by allowing only one high-quality trade daily.
✅ Momentum Protection – Stays in the trade as long as:
• Every candle remains green (no red candles).
• Each new candle has increasing volume (confirming strong buying).
✅ Automated Exit – Closes position if:
• A red candle appears.
• Volume fails to increase on a green candle.
⸻
🔍 How It Works
📌 Entry Conditions:
✔️ Candle gains ≥5% from previous close.
✔️ Candle is green & body size ≥75% of total range.
✔️ Volume >15K (confirming liquidity).
✔️ Occurs within pre-market session (4:00 - 9:30 AM EST).
✔️ Only the first valid trade of the day is taken.
📌 Exit Conditions:
❌ First red candle after entry → Exit trade.
❌ First green candle with lower volume → Exit trade.
⸻
🏆 Why Use This?
🔹 Eliminates Fake Breakouts – No trade unless volume & momentum confirm.
🔹 Prevents Overtrading – Restricts to one quality trade per day.
🔹 Adaptable to Any Market – Works on stocks, crypto, or forex.
🔹 Hands-Free Execution – No manual chart watching required!
⸻
🚨 Important Notes
📢 Not financial advice. Trading involves risk—always backtest & practice on paper trading before using real money.
📢 Enable pre-market data in your TradingView settings for accurate results.
📢 Optimized for 1-minute & 5-minute timeframes.
🔔 Like this strategy? Leave a comment, share your results, and don’t forget to hit Follow for more strategies! 🚀🔥

RSI, Volume, MACD, EMA ComboRSI + Volume + MACD + EMA Trading System
This script combines four powerful indicators—Relative Strength Index (RSI), Volume, Moving Average Convergence Divergence (MACD), and Exponential Moving Average (EMA)—to create a comprehensive trading strategy for better trend confirmation and trade entries.
How It Works
RSI (Relative Strength Index)
Helps identify overbought and oversold conditions.
Used to confirm momentum strength before taking a trade.
Volume
Confirms the strength of price movements.
Avoids false signals by ensuring there is sufficient trading activity.
MACD (Moving Average Convergence Divergence)
Confirms trend direction and momentum shifts.
Provides buy/sell signals through MACD line crossovers.
EMA (Exponential Moving Average)
Acts as a dynamic support and resistance level.
Helps filter out trades that go against the overall trend.
Trading Logic
Buy Signal:
RSI is above 50 (bullish momentum).
MACD shows a bullish crossover.
The price is above the EMA (trend confirmation).
Volume is increasing (strong participation).
Sell Signal:
RSI is below 50 (bearish momentum).
MACD shows a bearish crossover.
The price is below the EMA (downtrend confirmation).
Volume is increasing (intense selling pressure).
Backtesting & Risk Management
The strategy is optimized for scalping on the 1-minute timeframe (adjustable for other timeframes).
Default settings use realistic commission and slippage to simulate actual trading conditions.
A stop-loss and take-profit system is integrated to manage risk effectively.
This script is designed to help traders filter out false signals, improve trend confirmation, and increase trade accuracy by combining multiple indicators in a structured way.

[SHORT ONLY] 10 Bar Low Pullback█ STRATEGY DESCRIPTION
The "10 Bar Low Pullback" strategy is a contrarian short trading system designed to capture pullbacks after a new 10‐bar low is made. it identifies a potential short opportunity when the current bar’s low breaks below the lowest low of the previous 10 bars, provided that the bar exhibits strong internal momentum as measured by its IBS value. An optional trend filter further refines entries by requiring that the close is below a 200-period EMA.
█ WHAT IS INTERNAL BAR STRENGTH (IBS)?
Internal Bar Strength (IBS) measures where the closing price falls within the high-low range of a bar. It is calculated as:
ibs = (close - low) / (high - low)
- Low IBS (≤ 0.2): Indicates the close is near the bar's low, suggesting oversold conditions.
- High IBS (≥ 0.8): Indicates the close is near the bar's high, suggesting overbought conditions.
█ SIGNAL GENERATION
1. SHORT ENTRY
A Short Signal is triggered when:
The current bar’s low is below the lowest low of the past X bars (default: 10).
The bar’s IBS is greater than the specified threshold (default: 0.85).
The signal occurs within the defined trading window (between Start Time and End Time).
If the EMA Filter is enabled, the close must be below the 200-period EMA.
2. EXIT CONDITION
An exit Signal is generated when the current close falls below the previous bar’s low (close < low ), indicating a potential bearish reversal and prompting the strategy to close its short position.
█ ADDITIONAL SETTINGS
Lookback Period: Defines the number of bars (default is 10) over which the lowest low is calculated.
IBS Threshold: Sets the minimum required IBS value (default is 0.85) to qualify as a pullback.
Trading Window: Trades are only executed between the user-defined Start Time and End Time.
EMA Filter (Optional): When enabled, short entries are only considered if the current close is below the 200-period EMA, with the EMA period being adjustable (default is 200).
█ PERFORMANCE OVERVIEW
Designed for shorting opportunities, this strategy aims to capture pullbacks following an aggressive 10-bar low break.
It leverages a combination of a lookback low and IBS measurement to identify overextended bullish moves that may revert.
The optional EMA filter helps confirm a bearish market environment by ensuring the price remains under the trend line.
Suitable for use on various assets, including stocks and ETFs, on daily or similar timeframes.
Backtesting and parameter optimization are recommended to tailor the strategy to specific market conditions.

[SHORT ONLY] ATR Sell the Rip Mean Reversion Strategy█ STRATEGY DESCRIPTION
The "ATR Sell the Rip Mean Reversion Strategy" is a contrarian system that targets overextended price moves on stocks and ETFs. It calculates an ATR‐based trigger level to identify shorting opportunities. When the current close exceeds this smoothed ATR trigger, and if the close is below a 200-period EMA (if enabled), the strategy initiates a short entry, aiming to profit from an anticipated corrective pullback.
█ HOW IS THE ATR SIGNAL BAND CALCULATED?
This strategy computes an ATR-based signal trigger as follows:
Calculate the ATR
The strategy computes the Average True Range (ATR) using a configurable period provided by the user:
atrValue = ta.atr(atrPeriod)
Determine the Threshold
Multiply the ATR by a predefined multiplier and add it to the current close:
atrThreshold = close + atrValue * atrMultInput
Smooth the Threshold
Apply a Simple Moving Average over a specified period to smooth out the threshold, reducing noise:
signalTrigger = ta.sma(atrThreshold, smoothPeriodInput)
█ SIGNAL GENERATION
1. SHORT ENTRY
A Short Signal is triggered when:
The current close is above the smoothed ATR signal trigger.
The trade occurs within the specified trading window (between Start Time and End Time).
If the EMA filter is enabled, the close must also be below the 200-period EMA.
2. EXIT CONDITION
An exit Signal is generated when the current close falls below the previous bar’s low (close < low ), indicating a potential bearish reversal and prompting the strategy to close its short position.
█ ADDITIONAL SETTINGS
ATR Period: The period used to calculate the ATR, allowing for adaptability to different volatility conditions (default is 20).
ATR Multiplier: The multiplier applied to the ATR to determine the raw threshold (default is 1.0).
Smoothing Period: The period over which the raw ATR threshold is smoothed using an SMA (default is 10).
Start Time and End Time: Defines the time window during which trades are allowed.
EMA Filter (Optional): When enabled, short entries are only executed if the current close is below the 200-period EMA, confirming a bearish trend.
█ PERFORMANCE OVERVIEW
This strategy is designed for use on the Daily timeframe, targeting stocks and ETFs by capitalizing on overextended price moves.
It utilizes a dynamic, ATR-based trigger to identify when prices have potentially peaked, setting the stage for a mean reversion short entry.
The optional EMA filter helps align trades with broader market trends, potentially reducing false signals.
Backtesting is recommended to fine-tune the ATR multiplier, smoothing period, and EMA settings to match the volatility and behavior of specific markets.

[SHORT ONLY] Consecutive Bars Above MA Strategy█ STRATEGY DESCRIPTION
The "Consecutive Bars Above MA Strategy" is a contrarian trading system aimed at exploiting overextended bullish moves in stocks and ETFs. It monitors the number of consecutive bars that close above a chosen short-term moving average (which can be either a Simple Moving Average or an Exponential Moving Average). Once the count reaches a preset threshold and the current bar’s close exceeds the previous bar’s high within a designated trading window, a short entry is initiated. An optional EMA filter further refines entries by requiring that the current close is below the 200-period EMA, helping to ensure that trades are taken in a bearish environment.
█ HOW ARE THE CONSECUTIVE BULLISH COUNTS CALCULATED?
The strategy utilizes a counter variable, `bullCount`, to track consecutive bullish bars based on their relation to the short-term moving average. Here’s how the count is determined:
Initialize the Counter
The counter is initialized at the start:
var int bullCount = na
Bullish Bar Detection
For each bar, if the close is above the selected moving average (either SMA or EMA, based on user input), the counter is incremented:
bullCount := close > signalMa ? (na(bullCount) ? 1 : bullCount + 1) : 0
Reset on Non-Bullish Condition
If the close does not exceed the moving average, the counter resets to zero, indicating a break in the consecutive bullish streak.
█ SIGNAL GENERATION
1. SHORT ENTRY
A short signal is generated when:
The number of consecutive bullish bars (i.e., bars closing above the short-term MA) meets or exceeds the defined threshold (default: 3).
The current bar’s close is higher than the previous bar’s high.
The signal occurs within the specified trading window (between Start Time and End Time).
Additionally, if the EMA filter is enabled, the entry is only executed when the current close is below the 200-period EMA.
2. EXIT CONDITION
An exit signal is triggered when the current close falls below the previous bar’s low, prompting the strategy to close the short position.
█ ADDITIONAL SETTINGS
Threshold: The number of consecutive bullish bars required to trigger a short entry (default is 3).
Trading Window: The Start Time and End Time inputs define when the strategy is active.
Moving Average Settings: Choose between SMA and EMA, and set the MA length (default is 5), which is used to assess each bar’s bullish condition.
EMA Filter (Optional): When enabled, this filter requires that the current close is below the 200-period EMA, supporting entries in a downtrend.
█ PERFORMANCE OVERVIEW
This strategy is designed for stocks and ETFs and can be applied across various timeframes.
It seeks to capture mean reversion by shorting after a series of bullish bars suggests an overextended move.
The approach employs a contrarian short entry by waiting for a breakout (close > previous high) following consecutive bullish bars.
The adjustable moving average settings and optional EMA filter allow for further optimization based on market conditions.
Comprehensive backtesting is recommended to fine-tune the threshold, moving average parameters, and filter settings for optimal performance.

[SHORT ONLY] Consecutive Close>High[1] Mean Reversion Strategy█ STRATEGY DESCRIPTION
The "Consecutive Close > High " Mean Reversion Strategy is a contrarian daily trading system for stocks and ETFs. It identifies potential shorting opportunities by counting consecutive days where the closing price exceeds the previous day's high. When this consecutive day count reaches a predetermined threshold, and if the close is below a 200-period EMA (if enabled), a short entry is triggered, anticipating a corrective pullback.
█ HOW ARE THE CONSECUTIVE BULLISH COUNTS CALCULATED?
The strategy uses a counter variable called `bullCount` to track how many consecutive bars meet a bullish condition. Here’s a breakdown of the process:
Initialize the Counter
var int bullCount = 0
Bullish Bar Detection
Every time the close exceeds the previous bar's high, increment the counter:
if close > high
bullCount += 1
Reset on Bearish Bar
When there is a clear bearish reversal, the counter is reset to zero:
if close < low
bullCount := 0
█ SIGNAL GENERATION
1. SHORT ENTRY
A Short Signal is triggered when:
The count of consecutive bullish closes (where close > high ) reaches or exceeds the defined threshold (default: 3).
The signal occurs within the specified trading window (between Start Time and End Time).
2. EXIT CONDITION
An exit Signal is generated when the current close falls below the previous bar’s low (close < low ), prompting the strategy to exit the position.
█ ADDITIONAL SETTINGS
Threshold: The number of consecutive bullish closes required to trigger a short entry (default is 3).
Start Time and End Time: The time window during which the strategy is allowed to execute trades.
EMA Filter (Optional): When enabled, short entries are only triggered if the current close is below the 200-period EMA.
█ PERFORMANCE OVERVIEW
This strategy is designed for Stocks and ETFs on the Daily timeframe and targets overextended bullish moves.
It aims to capture mean reversion by entering short after a series of consecutive bullish closes.
Further optimization is possible with additional filters (e.g., EMA, volume, or volatility).
Backtesting should be used to fine-tune the threshold and filter settings for specific market conditions.

Moving Average Crossover StrategyCertainly! Below is an example of a professional trading strategy implemented in Pine Script for TradingView. This strategy is a simple moving average crossover strategy, which is a common approach used by many traders. It uses two moving averages (a short-term and a long-term) to generate buy and sell signals.
Input Parameters:
shortLength: The length of the short-term moving average.
longLength: The length of the long-term moving average.
Moving Averages:
shortMA: The short-term simple moving average (SMA).
longMA: The long-term simple moving average (SMA).
Conditions:
longCondition: A buy signal is generated when the short-term MA crosses above the long-term MA.
shortCondition: A sell signal is generated when the short-term MA crosses below the long-term MA.
Trade Execution:
The strategy enters a long position when the longCondition is met.
The strategy enters a short position when the shortCondition is met.
Plotting:
The moving averages are plotted on the chart.
Buy and sell signals are plotted as labels on the chart.
How to Use:
Copy the script into TradingView's Pine Script editor.
Adjust the shortLength and longLength parameters to fit your trading style.
Add the script to your chart and apply it to your desired timeframe.
Backtest the strategy to see how it performs on historical data.
This is a basic example, and professional traders often enhance such strategies with additional filters, risk management rules, and other indicators to improve performance.

Bollinger Bounce Reversal Strategy – Visual EditionOverview:
The Bollinger Bounce Reversal Strategy – Visual Edition is designed to capture potential reversal moves at price extremes—often termed “bounce points”—by using a combination of technical indicators. The strategy integrates Bollinger Bands, MACD, and volume analysis, and it provides rich on‑chart visual cues to help traders understand its signals and conditions. Additionally, the strategy enforces a maximum of 5 trades per day and uses fixed risk management parameters. This publication is intended for educational purposes and offers a systematic, transparent approach that you can further adjust to fit your market or risk profile.
How It Works:
Bollinger Bands:
A 20‑period simple moving average (SMA) and a user‑defined standard deviation multiplier (default 2.0) are used to calculate the Bollinger Bands.
When the price reaches or crosses these bands (i.e. falls below the lower band or rises above the upper band), it suggests that the price is in an extreme, potentially oversold or overbought, state.
MACD Filter:
The MACD (calculated with standard lengths, e.g. 12, 26, 9) provides momentum information.
For a bullish (long) signal, the MACD line should be above its signal line; for a bearish (short) signal, the MACD line should be below.
Volume Confirmation:
The strategy uses a 20‑period volume moving average to determine if current volume is strong enough to validate a signal.
A signal is confirmed only if the current volume is at or above a specified multiple (by default, 1.0×) of this moving average, ensuring that the move is supported by increased market participation.
Visual Cues:
Bollinger Bands and Fill: The basis (SMA), upper, and lower Bollinger Bands are plotted, and the area between the upper and lower bands is filled with a semi‑transparent color.
Signal Markers: When a long or short signal is generated, corresponding markers (labels) appear on the chart.
Background Coloring: The chart’s background changes color (green for long signals and red for short signals) on the bars where signals occur.
Information Table: An on‑chart table displays key indicator values (MACD, signal line, volume, average volume) and the number of trades executed that day.
Entry Conditions:
Long Entry:
A long trade is triggered when the previous bar’s close is below the lower Bollinger Band and the current bar’s close crosses above it, combined with a bullish MACD condition and strong volume.
Short Entry:
A short trade is triggered when the previous bar’s close is above the upper Bollinger Band and the current bar’s close crosses below it, with a bearish MACD condition and high volume.
Risk Management:
Daily Trade Limit: The strategy restricts trading to no more than 5 trades per day.
Stop-Loss and Take-Profit:
For each position, a stop loss is set at a fixed percentage away from the entry price (typically 2%), and a take profit is set to target a 1:2 risk-reward ratio (typically 4% from the entry price).
Backtesting Setup:
Initial Capital: $10,000
Commission: 0.1% per trade
Slippage: 1 tick per bar
These realistic parameters help ensure that backtesting results reflect the conditions of an average trader.
Disclaimer:
Past performance is not indicative of future results. This strategy is experimental and provided solely for educational purposes. It is essential to backtest extensively and paper trade before any live deployment. All risk management practices are advisory, and you should adjust parameters to suit your own trading style and risk tolerance.
Conclusion:
By combining Bollinger Bands, MACD, and volume analysis, the Bollinger Bounce Reversal Strategy – Visual Edition provides a clear, systematic method to identify potential reversal opportunities at price extremes. The added visual cues help traders quickly interpret signals and assess market conditions, while strict risk management and a daily trade cap help keep trading disciplined. Adjust and refine the settings as needed to better suit your specific market and risk profile.

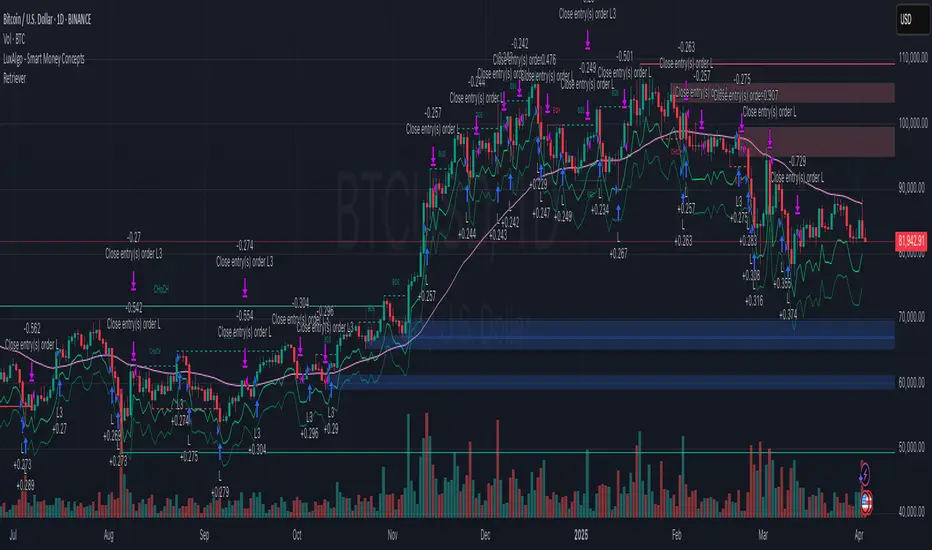
The RetrieverThis Pine Script strategy, named "The Retriever" aims to capitalize on price dips based on the size of the candlestick body. It uses a moving average of the body size to identify potential long entry points. Here's a breakdown:
Body Size Calculation: It calculates the absolute difference between the close and open prices (body) to determine the candlestick body size.
Entry Signals:
long: A long entry signal is generated when the close price is significantly higher than the moving average of the body size (ta.sma(body, 100)) multiplied by a factor (mult). Thanks to this principle we are entering just bigger dips but just in case it is sudden movement, typically dip during bulish trend.
longExtra: A second, more aggressive long entry signal is generated when the close price is even further above the moving average (multiplied by mult * 2). This signal is very rare and it is helping to decrease entry point in case huge market dips which can occor just few times per year.
Quantity Calculation: The order quantity (qty) is dynamically calculated based on the current equity and the price range between minRange and maxRange. It aims to adjust the quantity inversely to the price range, possibly increasing the quantity when the price range is smaller. It is actually very smart in several ways:
it is making bigger trades when market price is low (closer to manually defined minRange) and vice versa making smaller trades when market is close to maxRange
trade size is calculated based on current equity so it allows to use compound interest effect
as there is no SL in this strategy trade size is calculated to be max around 50-60% drawdown based on backtested results so it can survive 80-90% market drawdowns (entry point is after huge dip)
Exit Conditions: All open positions are closed when either of these conditions is met:
The last candle is green (close is lower than open). There is also minProfit param defined which is set to 0 so it means that our position has to be in profit. So we are never closing in loss. We have to differentiate here between order and position. Order can be in loss but overal position has to be always in profit.
Volatility Momentum Breakout StrategyDescription:
Overview:
The Volatility Momentum Breakout Strategy is designed to capture significant price moves by combining a volatility breakout approach with trend and momentum filters. This strategy dynamically calculates breakout levels based on market volatility and uses these levels along with trend and momentum conditions to identify trade opportunities.
How It Works:
1. Volatility Breakout:
• Methodology:
The strategy computes the highest high and lowest low over a defined lookback period (excluding the current bar to avoid look-ahead bias). A multiple of the Average True Range (ATR) is then added to (or subtracted from) these levels to form dynamic breakout thresholds.
• Purpose:
This method helps capture significant price movements (breakouts) while ensuring that only past data is used, thereby maintaining realistic signal generation.
2. Trend Filtering:
• Methodology:
A short-term Exponential Moving Average (EMA) is applied to determine the prevailing trend.
• Purpose:
Long trades are considered only when the current price is above the EMA, indicating an uptrend, while short trades are taken only when the price is below the EMA, indicating a downtrend.
3. Momentum Confirmation:
• Methodology:
The Relative Strength Index (RSI) is used to gauge market momentum.
• Purpose:
For long entries, the RSI must be above a mid-level (e.g., above 50) to confirm upward momentum, and for short entries, it must be below a similar threshold. This helps filter out signals during overextended conditions.
Entry Conditions:
• Long Entry:
A long position is triggered when the current closing price exceeds the calculated long breakout level, the price is above the short-term EMA, and the RSI confirms momentum (e.g., above 50).
• Short Entry:
A short position is triggered when the closing price falls below the calculated short breakout level, the price is below the EMA, and the RSI confirms momentum (e.g., below 50).
Risk Management:
• Position Sizing:
Trades are sized to risk a fixed percentage of account equity (set here to 5% per trade in the code, with each trade’s stop loss defined so that risk is limited to approximately 2% of the entry price).
• Stop Loss & Take Profit:
A stop loss is placed a fixed ATR multiple away from the entry price, and a take profit target is set to achieve a 1:2 risk-reward ratio.
• Realistic Backtesting:
The strategy is backtested using an initial capital of $10,000, with a commission of 0.1% per trade and slippage of 1 tick per bar—parameters chosen to reflect conditions faced by the average trader.
Important Disclaimers:
• No Look-Ahead Bias:
All breakout levels are calculated using only past data (excluding the current bar) to ensure that the strategy does not “peek” into future data.
• Educational Purpose:
This strategy is experimental and provided solely for educational purposes. Past performance is not indicative of future results.
• User Responsibility:
Traders should thoroughly backtest and paper trade the strategy under various market conditions and adjust parameters to fit their own risk tolerance and trading style before live deployment.
Conclusion:
By integrating volatility-based breakout signals with trend and momentum filters, the Volatility Momentum Breakout Strategy offers a unique method to capture significant price moves in a disciplined manner. This publication provides a transparent explanation of the strategy’s components and realistic backtesting parameters, making it a useful tool for educational purposes and further customization by the TradingView community.

SMA + RSI + Volume + ATR StrategySMA + RSI + Volume + ATR Strategy
1. Indicators Used:
SMA (Simple Moving Average): This is a trend-following indicator that calculates the average price of a security over a specified period (50 periods in this case). It's used to identify the overall trend of the market.
RSI (Relative Strength Index): This measures the speed and change of price movements. It tells us if the market is overbought (too high) or oversold (too low). Overbought is above 70 and oversold is below 30.
Volume: This is the amount of trading activity. A higher volume often indicates strong interest in a particular price move.
ATR (Average True Range): This measures volatility, or how much the price is moving in a given period. It helps us adjust stop losses and take profits based on market volatility.
2. Conditions for Entering Trades:
Buy Signal (Green Up Arrow):
Price is above the 50-period SMA (indicating an uptrend).
RSI is below 30 (indicating the market might be oversold or undervalued, signaling a potential reversal).
Current volume is higher than average volume (indicating strong interest in the move).
ATR is increasing (indicating higher volatility, suggesting that the market might be ready for a move).
Sell Signal (Red Down Arrow):
Price is below the 50-period SMA (indicating a downtrend).
RSI is above 70 (indicating the market might be overbought or overvalued, signaling a potential reversal).
Current volume is higher than average volume (indicating strong interest in the move).
ATR is increasing (indicating higher volatility, suggesting that the market might be ready for a move).
3. Take Profit & Stop Loss:
Take Profit: When a trade is made, the strategy will set a target price at a certain percentage above or below the entry price (1.5% in this case) to automatically exit the trade once that target is hit.
Stop Loss: If the price goes against the position, a stop loss is set at a percentage below or above the entry price (0.5% in this case) to limit losses.
4. Execution of Trades:
When the buy condition is met, the strategy will enter a long position (buying).
When the sell condition is met, the strategy will enter a short position (selling).
5. Visual Representation:
Green Up Arrow: Appears on the chart when the buy condition is met.
Red Down Arrow: Appears on the chart when the sell condition is met.
These arrows help you see at a glance when the strategy suggests you should buy or sell.
In Summary:
This strategy uses a combination of trend-following (SMA), momentum (RSI), volume, and volatility (ATR) to decide when to buy or sell a stock. It looks for opportunities when the market is either oversold (buy signal) or overbought (sell signal) and makes sure there’s enough volume and volatility to back up the move. It also includes take-profit and stop-loss levels to manage risk.

MA Crossover with Demand/Supply Zones + Stop Loss/Take ProfitStop Loss and Take Profit Inputs:
Added stopLossPerc and takeProfitPerc as inputs to allow the user to define the stop loss and take profit levels as a percentage of the entry price.
Stop Loss and Take Profit Calculation:
For long positions, the stop loss is calculated as strategy.position_avg_price * (1 - stopLossPerc), and the take profit is calculated as strategy.position_avg_price * (1 + takeProfitPerc).
For short positions, the stop loss is calculated as strategy.position_avg_price * (1 + stopLossPerc), and the take profit is calculated as strategy.position_avg_price * (1 - takeProfitPerc).
Exit Strategy:
Added strategy.exit to define the stop loss and take profit levels for each trade. The from_entry parameter ensures that the exit is tied to the specific entry order.
Flexibility:
The stop loss and take profit levels are dynamic and adjust based on the entry price of the trade.
How It Works:
When a buy signal is generated (MA crossover near a demand zone), the strategy enters a long position and sets a stop loss and take profit level based on the input percentages.
When a sell signal is generated (MA crossunder near a supply zone), the strategy enters a short position and sets a stop loss and take profit level based on the input percentages.
The trade will exit automatically if either the stop loss or take profit level is hit.
Example:
If the entry price for a long position is $100, and the stop loss is set to 1% while the take profit is set to 2%:
Stop loss level =
100
∗
(
1
−
0.01
)
=
100∗(1−0.01)=99
Take profit level =
100
∗
(
1
+
0.02
)
=
100∗(1+0.02)=102
Notes:
You can adjust the stopLossPerc and takeProfitPerc inputs to suit your risk management preferences.
Always backtest the strategy to ensure the stop loss and take profit levels are appropriate for your trading instrument and timeframe.

BuyTheDips Trade on Trend and Fixed TP/SL
This strategy is designed to trade in the direction of the trend using exponential moving average (EMA) crossovers as signals while employing fixed percentages for take profit (TP) and stop loss (SL) to manage risk and reward. It is suitable for both scalping and swing trading on any timeframe, with its default settings optimized for short-term price movements.
How It Works
EMA Crossovers:
The strategy uses two EMAs: a fast EMA (shorter period) and a slow EMA (longer period).
A buy signal is triggered when the fast EMA crosses above the slow EMA, indicating a potential bullish trend.
A sell signal is triggered when the fast EMA crosses below the slow EMA, signaling a bearish trend.
Trend Filtering:
To improve signal reliability, the strategy only takes trades in the direction of the overall trend:
Long trades are executed only when the fast EMA is above the slow EMA (bullish trend).
Short trades are executed only when the fast EMA is below the slow EMA (bearish trend).
This filtering ensures trades are aligned with the prevailing market direction, reducing false signals.
Risk Management (Fixed TP/SL):
The strategy uses fixed percentages for take profit and stop loss:
Take Profit: A percentage above the entry price for long trades (or below for short trades).
Stop Loss: A percentage below the entry price for long trades (or above for short trades).
These percentages can be customized to balance risk and reward according to your trading style.
For example:
If the take profit is set to 2% and the stop loss to 1%, the strategy operates with a 2:1 risk-reward ratio. BINANCE:BTCUSDT

Bearish Wick Reversal█ STRATEGY OVERVIEW
The "Bearish Wick Reversal Strategy" identifies potential bullish reversals following significant bearish price rejection (long lower wicks). This counter-trend approach enters long positions when bearish candles show exaggerated downside wicks relative to closing prices, then exits on bullish confirmation signals. Includes optional EMA trend filtering for improved reliability.
█ What is a Bearish Wick?
A price rejection pattern where:
Bearish candle (close < open) forms with extended lower wick
Wick represents failed selloff: Low drops significantly below close
Measured as: (Low - Close)/Close × 100 (Negative percentage indicates downward extension)
█ SIGNAL GENERATION
1. LONG ENTRY CONDITION
Bearish candle forms with close < open
Lower wick exceeds user-defined threshold (Default: -1% of close price)
The signal occurs within the specified time window
If enabled, the close price must also be above the 200-period EMA (Exponential Moving Average)
2. EXIT CONDITION
A Sell Signal is generated when the current closing price exceeds the highest high of the previous seven bars (`close > _highest `). This indicates that the price has shown strength, potentially confirming the reversal and prompting the strategy to exit the position.
█ PERFORMANCE OVERVIEW
Ideal Market: Volatile instruments with frequent price rejections
Key Risk: False signals in sustained bearish trends
Optimization Tip: Test various thresholds
Filter Impact: EMA reduces trades but improves win rate and reduces drawdown

Futures Engulfing Candle Size Strategy (Ticks, TP/SL)The Futures Candle Size Strategy is designed to identify and trade significant price movements in the futures market based on candle size. It is optimized for futures instruments like ES, NQ, or CL, where precise tick-level calculations are essential. The strategy includes a customizable take profit and stop loss in ticks and operates only within a specified time window (e.g., 7:00 AM to 9:15 AM CST).
Key Features:
Candle Size Threshold: Trades are triggered when the candle's high-to-low range exceeds the defined threshold in ticks.
Time Filter: Limits trades to the most active market hours, specifically between 7:00 AM and 9:15 AM CST.
Take Profit and Stop Loss: Customizable exit levels in ticks to manage risk and lock in profits.
Long and Short Trades: Automatically places buy or sell orders based on the candle's direction (bullish or bearish).
Alerts: Sends alerts whenever a trade is triggered, helping you stay informed in real-time.
How It Works:
The strategy calculates the size of each candle in ticks and compares it to the user-defined threshold.
If the candle size meets or exceeds the threshold within the specified time range, it triggers a long or short trade.
The trade automatically exits when the price hits the take profit or stop loss levels.

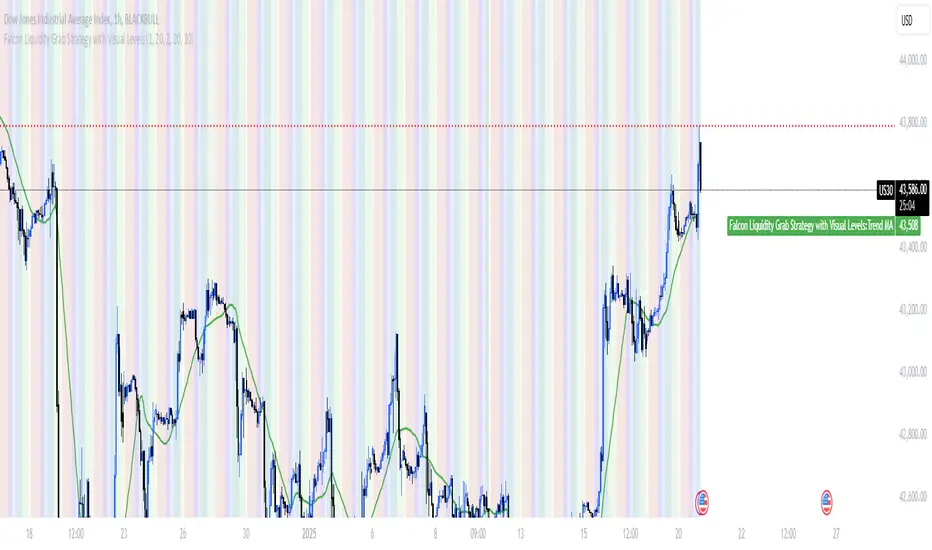
Falcon Liquidity Grab StrategyHow to Use This Script for Commodities and Indices
Best Timeframes: Start with 15-minute charts but test on higher timeframes like 1 hour for indices.
Risk Settings: Adjust the stop_loss_points and take_profit_multiplier to match the volatility of the chosen instrument.
IU 4 Bar UP StrategyIU 4 Bar UP Strategy
The IU 4 Bar UP Strategy is a trend-following strategy designed to identify and execute long trades during strong bullish momentum, combined with confirmation from the SuperTrend indicator. This strategy is suitable for traders aiming to capitalize on sustained upward market movements.
Features :
1. SuperTrend Confirmation: Incorporates the SuperTrend indicator as a dynamic support/resistance line to filter trades in the direction of the trend.
2. 4 Consecutive Bullish Bars: Detects a series of 4 bullish candles as a signal for strong upward momentum, ensuring robust trade setups.
3. Dynamic Alerts: Sends alerts for trade entries and exits to keep traders informed.
4. Visual Enhancements:
- Plots the SuperTrend indicator on the chart.
- Changes the background color while a trade is active for easy visualization.
Inputs :
- SuperTrend ATR Period: The period used to calculate the Average True Range (ATR) for the SuperTrend indicator.
- SuperTrend ATR Factor: The multiplier for the ATR in the SuperTrend calculation.
Entry Conditions :
A long entry is triggered when:
1. The last 4 consecutive candles are bullish (closing prices are higher than opening prices).
2. The current price is above the SuperTrend line.
3. The strategy is not already in a position.
4. The bar is confirmed (not a partially formed bar).
When all these conditions are met, the strategy enters a long position and provides an alert:
"Long Entry triggered"
Exit Conditions :
The strategy exits the long position when:
1. The closing price drops below the SuperTrend line.
2. An alert is generated: "Close the long Trade"
Visualization :
- The SuperTrend line is plotted, dynamically colored:
- Green when the trend is bullish.
- Red when the trend is bearish.
- The background color turns semi-transparent green while a trade is active, indicating a long position.
Do use proper risk management while using this strategy.

IU open equal to high/low strategyIU open equal to high/low strategy:
The "IU Open Equal to High/Low Strategy" is designed to identify and trade specific market conditions where the day's first price action shows a strong directional bias. This strategy automatically enters trades based on the relationship between the market's open price and its first high or low of the day.
Entry Conditions:
1. Long Entry: A long position is initiated when the first open price of the session equals the day's first low. This signals a potential upward move.
2. Short Entry: A short position is initiated when the first open price of the session equals the day's first high. This signals a potential downward move.
Exit Conditions:
1. Stop Loss (SL): For both long and short trades, the stop loss is calculated based on the low or high of the candle where the position was entered.
2. Take Profit (TP): The take profit is set using a Risk-to-Reward (RTR) ratio, which is customizable by the user. The TP is calculated relative to the entry price and the distance between the entry and the stop loss.
Additional Features:
- Plots are used to visualize the entry price, stop loss, and take profit levels directly on the chart, providing clear and actionable insights.
- Labels are displayed to indicate the occurrence of the "Open == Low" or "Open == High" conditions for easier identification of potential trade setups.
- A dynamic fill highlights the areas between the entry price and the stop loss or take profit, offering a clear visual representation of the trade's risk and reward zones.
This strategy is designed for traders looking to capitalize on directional momentum at the start of the trading session. It is customizable, allowing users to set their desired Risk-to-Reward ratio and tailor the strategy to fit their trading style.

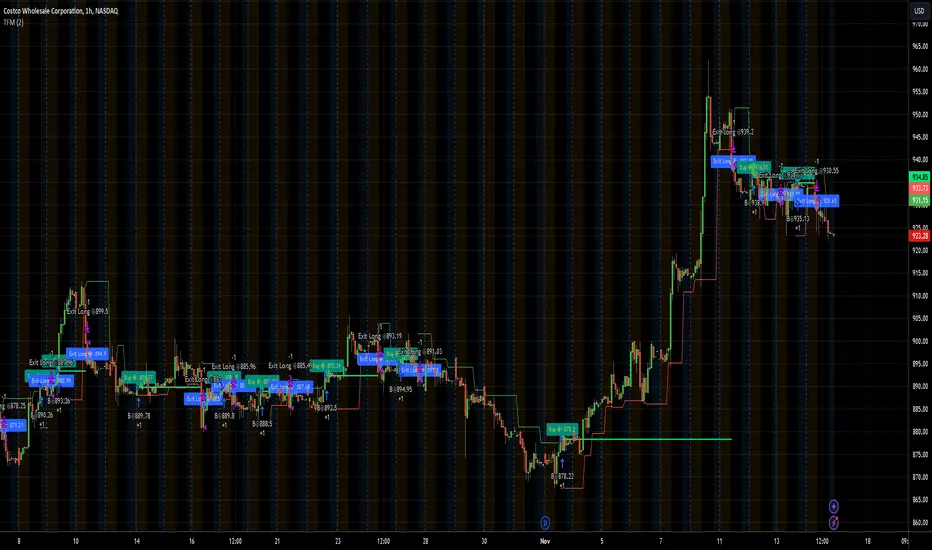
TFMTFM Strategy Explanation
Overview
The TFM (Timeframe Multiplier) strategy is a PineScript trading bot that utilizes multiple timeframes to identify entry and exit points.
Inputs
1. tfm (Timeframe Multiplier): Multiplies the chart's timeframe to create a higher timeframe for analysis.
2. lns (Long and Short): Enables or disables short positions.
Logic
Calculations
1. chartTf: Gets the chart's timeframe in seconds.
2. tfTimes: Calculates the higher timeframe by multiplying chartTf with tfm.
3. MintickerClose and MaxtickerClose: Retrieve the minimum and maximum closing prices from the higher timeframe using request.security.
- MintickerClose: Finds the lowest low when the higher timeframe's close is below its open.
- MaxtickerClose: Finds the highest high when the higher timeframe's close is above its open.
Entries and Exits
1. Long Entry: When the current close price crosses above MaxtickerClose.
2. Short Entry (if lns is true): When the current close price crosses below MintickerClose.
3. Exit Long: When the short condition is met (if lns is false) or when the trade is manually closed.
Strategy
1. Attach the script to a chart.
2. Adjust tfm and lns inputs.
3. Monitor entries and exits.
Example Use Cases
1. Intraday trading with tfm = 2-5.
2. Swing trading with tfm = 10-30.
Tips
1. Experiment with different tfm values.
2. Use lns to control short positions.
3. Combine with other indicators for confirmation.
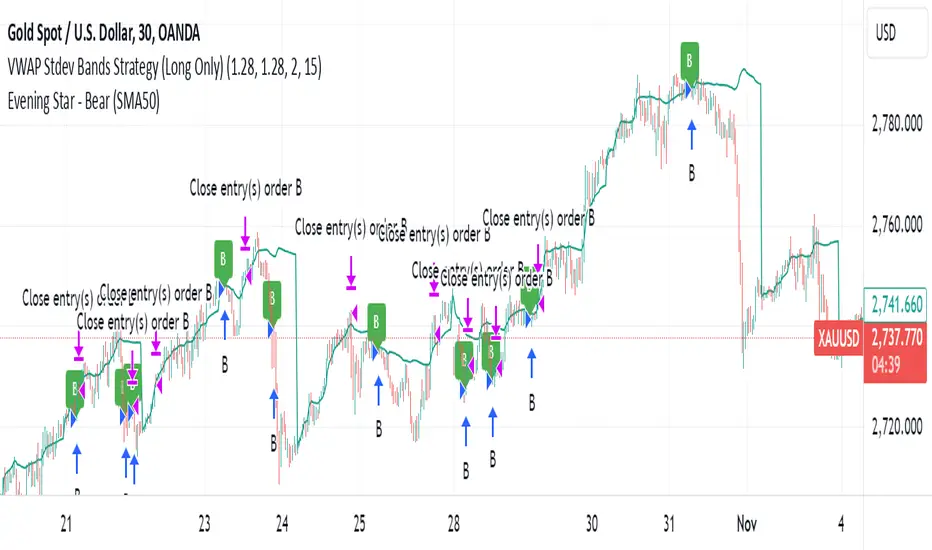
VWAP Stdev Bands Strategy (Long Only)The VWAP Stdev Bands Strategy (Long Only) is designed to identify potential long entry points in trending markets by utilizing the Volume Weighted Average Price (VWAP) and standard deviation bands. This strategy focuses on capturing upward price movements, leveraging statistical measures to determine optimal buy conditions.
Key Features:
VWAP Calculation: The strategy calculates the VWAP, which represents the average price a security has traded at throughout the day, weighted by volume. This is an essential indicator for determining the overall market trend.
Standard Deviation Bands: Two bands are created above and below the VWAP, calculated using specified standard deviations. These bands act as dynamic support and resistance levels, providing insight into price volatility and potential reversal points.
Trading Logic:
Long Entry Condition: A long position is triggered when the price crosses below the lower standard deviation band and then closes above it, signaling a potential price reversal to the upside.
Profit Target: The strategy allows users to set a predefined profit target, closing the long position once the specified target is reached.
Time Gap Between Orders: A customizable time gap can be specified to prevent multiple orders from being placed in quick succession, allowing for a more controlled trading approach.
Visualization: The VWAP and standard deviation bands are plotted on the chart with distinct colors, enabling traders to visually assess market conditions. The strategy also provides optional plotting of the previous day's VWAP for added context.
Use Cases:
Ideal for traders looking to engage in long-only positions within trending markets.
Suitable for intraday trading strategies or longer-term approaches based on market volatility.
Customization Options:
Users can adjust the standard deviation values, profit target, and time gap to tailor the strategy to their specific trading style and market conditions.
Note: As with any trading strategy, it is important to conduct thorough backtesting and analysis before live trading. Market conditions can change, and past performance does not guarantee future results.
Premium Signal Strategy [BRTLab]🔍 Overview
BRTLab Premium Signal Strategy is a comprehensive multi-indicator trading strategy based on the integration of key technical indicators such as ADX, RSX, CAND, V9, PP, MA, and LVL. The strategy allows users to flexibly adjust the parameters of each indicator to optimize for specific market conditions, making it effective for both trending markets and for identifying reversals and breakouts.
🌟 What makes this strategy unique is its seamless compatibility with the BRT Premium Signals tool, allowing traders not only to receive real-time signals but also to conduct robust backtests. This feature enables users to fine-tune the best parameter settings or even test out their own trading ideas through historical data analysis. The ability to backtest empowers traders to validate strategies before going live, significantly improving the chances of success by offering data-driven insights.
💡 Signal Logic:
ADX
The ADX-based signals reflect the strength of market trends. Bullish or bearish signals are generated when directional indicators (+DI or -DI) show increasing strength relative to one another, indicating the start or continuation of a strong trend.
RSX
These signals focus on divergences within RSI, identifying potential reversals by detecting either classic or hidden divergences when the market is overbought or oversold.
V9
Signals are generated when the price interacts with a dynamic threshold, indicating trend continuation or reversal. Additional filters can be applied to refine these signals further, enhancing the dashboard's overall effectiveness.
CAND
Candlestick-based signals are triggered by key patterns such as bullish or bearish engulfing formations. These signals are cross-checked with other conditions, such as RSI levels and candle stability, making them especially useful for short-term trading.
PP (Pivot Points)
Pivot Point signals reinforce candlestick patterns by aligning with key support or resistance levels, suggesting potential reversals or continuation opportunities at significant price points.
MA (Moving Average)
MA signals help identify trends by analyzing price action relative to a moving average. Optional filters like ADX add an additional layer of validation, ensuring only high-confidence signals are displayed on the dashboard.
LVL (Levels)
These signals are based on shifts in RSI and help traders spot potential breakouts or reversals. The dashboard integrates these signals alongside MA and ADX filters to enhance their accuracy.
📊 Risk Management
This strategy includes built-in risk management features to help minimize losses:
Initial Capital: The user can set the initial capital (default is 10000), adjusting the strategy to their financial goals.
Position Size: Set the position size (default is 1000), allowing better risk management and controlling potential losses.
Stop-Loss: Multiple stop-loss methods are available, including ATR-based, fixed percentage, or prior high/low levels.
Take-Profit: Users can configure take-profit settings (default is 1.3%) to lock in gains while managing risk effectively.
⚠️ RISK DISCLAIMER
Trading involves significant risks, and most day traders experience losses. All content, tools, scripts, and educational materials from BRTLab are provided for informational and educational purposes only. Past performance is not a guarantee of future results. Please ensure you use realistic backtesting settings, including proper account size, commission, and slippage, to reflect market conditions.
⚡ CONCLUSION
We believe that successful trading comes from using indicators as supportive tools rather than relying on them for guaranteed success. The BRTLab Premium Signal Strategy is designed to be a comprehensive, customizable toolset that helps traders understand and interpret technical indicators more effectively.
By leveraging the power of backtesting and indicator optimization, traders can make well-informed decisions and develop a deeper understanding of market dynamics. Use this strategy to build a trading framework that aligns with your personal goals and trading style.
Follow the author’s instructions below to access the BRTLab Premium suite and unlock the full potential of this strategy.
