[w3ss1] TimewindowsYou can use this if you want some subtle indication of a specific timewindow on the chart.
You can use it to see the macrowindows, or set the time of a session or any timewindow you want.
You can choose the color and plot it on the bottom or the top of the chart.
Cari dalam skrip untuk "Cycle"

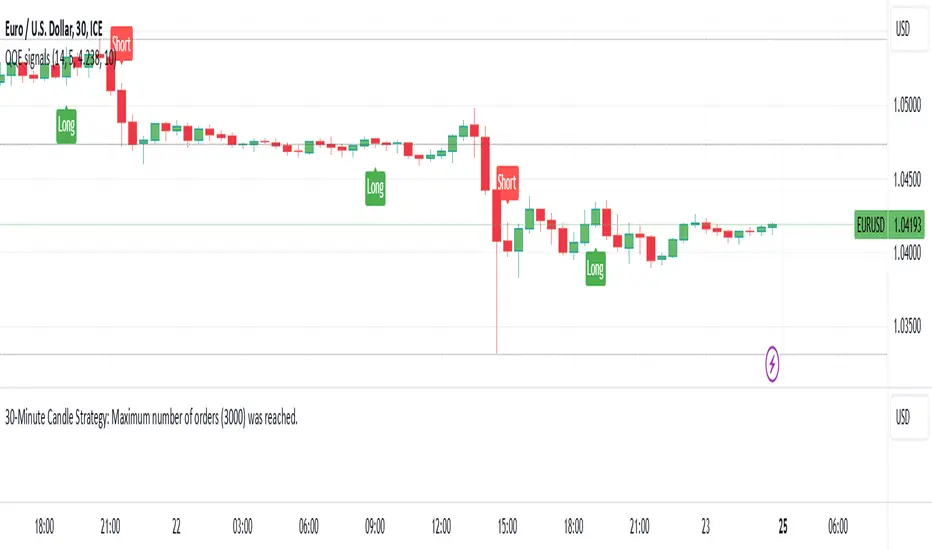
30-Minute Candle Strategy30-Minute Candle Trading Strategy
This strategy works on a 30-minute candle timeframe. When a new 30-minute candle opens, the following actions will take place based on the previous 30-minute candle's closing price:
Buy Trade Setup:
If the market opens above the previous 30-minute candle's closing price, a buy trade will be executed immediately at the market price.
The stop-loss will be set at the previous 30-minute candle's closing price.
There will be no fixed target.
The trade will be closed 1 minute before the current 30-minute candle closes, regardless of profit or loss.
Sell Trade Setup:
If a buy trade hits the stop-loss and the market moves below the previous 30-minute candle's closing price, a sell trade will be executed immediately at the market price.
The stop-loss for the sell trade will also be set at the previous 30-minute candle's closing price.
There will be no fixed target.
The trade will be closed 1 minute before the current 30-minute candle closes, regardless of profit or loss.
Procedure:
This process will repeat for every 30-minute candle.
If the market crosses the previous 30-minute candle's closing price to the upside, a buy trade will be executed, and the stop-loss will be set at the previous candle's closing price.
If the market crosses the previous 30-minute candle's closing price to the downside, a sell trade will be executed, and the stop-loss will also be set at the previous candle's closing price.
Each trade will be closed 1 minute before the current candle closes.
Key Points:
This strategy applies to every new 30-minute candle.
The stop-loss will always be based on the previous 30-minute candle's closing price.
If a stop-loss is hit, the strategy will automatically switch to the opposite trade (buy to sell or sell to buy) based on market movement crossing the previous candle's closing price.
This is a repetitive and systematic approach to trading, ensuring the rules are followed for every 30-minute candle.
NUTJP CDC ActionZone 20241. Core Components of the Strategy
• Fast EMA and Slow EMA:
• The Fast EMA (shorter period) is more reactive to recent price changes.
• The Slow EMA (longer period) reacts slower and provides a smoother view of the overall trend.
• Relationship Between Fast EMA and Slow EMA:
• When the Fast EMA is above the Slow EMA, the market is considered Bullish.
• When the Fast EMA is below the Slow EMA, the market is considered Bearish.
2. Zones Based on Price and EMAs
The strategy defines six zones based on the position of the price, Fast EMA, and Slow EMA:
1. Green Zone (Buy):
• Bullish trend (Fast EMA > Slow EMA)
• Price is above the Fast EMA.
• Indicates a strong uptrend and suggests buying.
2. Blue and Light Blue Zones (Pre-Buy):
• Price is above the Fast EMA but below or near the Slow EMA.
• Represents potential bullish signals but not strong enough to trigger a buy.
3. Red Zone (Sell):
• Bearish trend (Fast EMA < Slow EMA)
• Price is below the Fast EMA.
• Indicates a strong downtrend and suggests selling or avoiding long trades.
4. Orange and Yellow Zones (Pre-Sell):
• Price is below the Fast EMA but above or near the Slow EMA.
• Represents potential bearish signals but not strong enough to trigger a sell.
These zones help traders visualize the market conditions and determine whether to buy, hold, or sell.
3. Buy and Sell Conditions
• Buy Condition:
A buy signal is triggered when:
• The price enters the Green Zone (Bullish trend and price > Fast EMA).
• It’s the first green candle after a non-green candle.
• Sell Condition:
A sell signal is triggered when:
• The price enters the Red Zone (Bearish trend and price < Fast EMA).
• It’s the first red candle after a non-red candle.
4. Trade Execution Logic
• Buy:
The strategy enters a long position (buy) when the above buy condition is met.
• Sell:
The strategy exits the long position when the sell condition is met.
Note: It doesn’t support short trades, meaning it doesn’t enter sell positions.
5. Momentum-Based Signals (Optional)
The indicator also includes momentum signals using Stochastic RSI to provide additional buy/sell signals:
• These are based on oversold and overbought levels of the Stochastic RSI.
• It filters signals depending on whether the trend is Bullish or Bearish.
6. Visual Features
The indicator is designed to make the trading zones and signals visually intuitive:
• Bar Colors:
Candlesticks are colored based on the current zone (e.g., Green for Buy, Red for Sell).
• EMA Lines:
The Fast EMA and Slow EMA are plotted, making it easy to see crossover points.
• Buy/Sell Signals:
Marked with shapes (e.g., circles) below/above bars for clarity.
7. Strategy Assumptions
• Trend-Following Nature:
This strategy assumes that trends persist. It works best in trending markets but might give false signals in ranging markets.
• Lagging Nature of EMAs:
As EMAs are lagging indicators, buy and sell signals may occur after significant moves have already begun or ended.
• Momentum Confirmation (Optional):
Adding momentum signals can help filter false signals, though it’s not part of the core logic.
8. Usage Recommendations
• Timeframes:
Works on various timeframes but may perform better on higher timeframes (e.g., 1H, Daily) to reduce noise.
• Markets:
Can be applied to stocks, forex, and cryptocurrencies.
• Backtesting and Optimization:
Before live trading, backtest the strategy with different EMA periods and other parameters to find optimal settings for your market and timeframe.

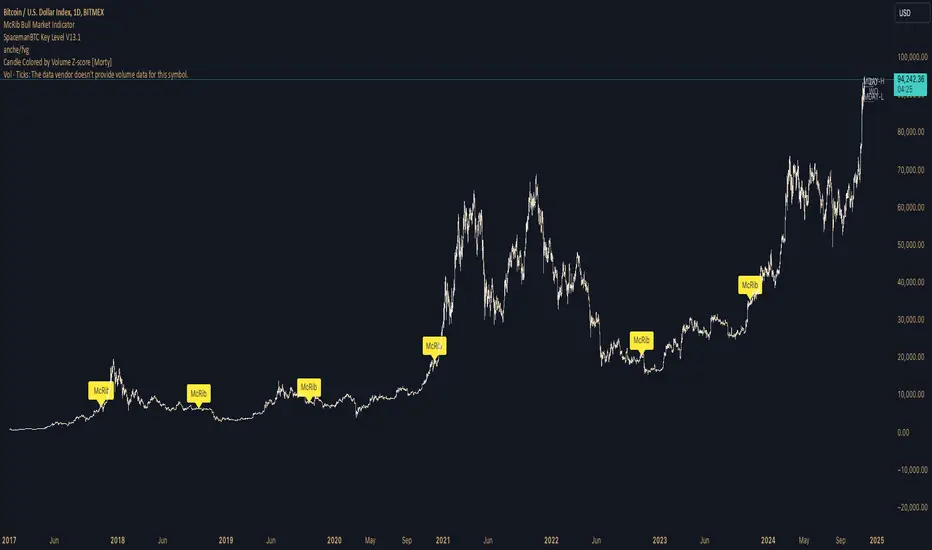
McRib Bull Market Indicator# McRib Bull Market Indicator
## Overview
The McRib Bull Market Indicator is a unique technical analysis tool that marks McDonald's McRib sandwich release dates on your trading charts. While seemingly unconventional, this indicator serves as a fascinating historical reference point for market analysis, particularly for studying periods of market expansion.
## Key Features
- Visual yellow labels marking verified McRib release dates from 2012 to 2024
- Clean, unobtrusive design that overlays on any chart timeframe
- Covers both U.S. and international releases (including UK and Australia)
## Historical Reference Points
The indicator includes release dates from:
- December 2012
- October-December 2014
- January 2015
- October 2016
- November 2017
- October 2018
- October 2019
- December 2020
- October 2022
- November 2023
- December 2024
## Usage Guide
1. Add the indicator to any chart by searching for "McRib Bull Market Indicator"
2. The indicator will automatically display yellow labels above price candles on McRib release dates
3. Use these reference points to:
- Analyze market conditions during McRib releases
- Study potential correlations between releases and market movements
- Compare market behavior across different McRib release periods
- Identify any patterns in market expansion phases coinciding with releases
## Trading Application
While initially created as a novelty indicator, it can be used to:
- Mark specific historical points of reference for broader market analysis
- Study potential market psychology around major promotional events
- Compare seasonal market patterns with recurring release dates
- Analyze market expansion phases that coincide with releases
Remember: While this indicator provides interesting historical reference points, it should be used as part of a comprehensive trading strategy rather than as a standalone trading signal.
Daily Manipulation and Distribution Levels with Buy/Sell SignalsIndicator Summary:
This indicator is designed for intraday traders, highlighting key price levels and providing simple buy/sell signals based on price manipulation and distribution concepts.
Key Features:
Core Levels:
Manipulation Plus/Minus: Derived from the daily open and a portion of the daily range (e.g., 25%).
Distribution Levels: Daily high and low serve as ultimate targets or resistance/support levels.
Buy and Sell Signals:
Buy Signal: Triggered when the price crosses above the Manipulation Plus level. A green "BUY" label marks the entry.
Sell Signal: Triggered when the price crosses below the Manipulation Minus level. A red "SELL" label marks the entry.
Clean Chart Design:
Hides unnecessary clutter, showing only relevant key levels and labeled signals for clarity.
How to Use:
Entry Points:
Buy Entry: When a green "BUY" label appears after the price breaks above the Manipulation Plus level.
Sell Entry: When a red "SELL" label appears after the price breaks below the Manipulation Minus level.
Exit Strategy:
Take Profit: Use the Distribution Levels (daily high/low) as take-profit zones.
Stop Loss: Set just above/below the Manipulation Levels to manage risk effectively.
One to Two Trades per Session: Focus on high-probability moves to ensure clarity and reduce overtrading.
Who It’s For:
This indicator is ideal for traders seeking a structured and visual approach to intraday trading, with clear entry/exit criteria based on price manipulation and distribution theory. It simplifies decision-making and ensures clean chart setups without overwhelming visuals.
ATT Model with Buy/Sell SignalsIndicator Summary
This indicator is based on the ATT (Arithmetic Time Theory) model, using specific turning points derived from the ATT sequence (3, 11, 17, 29, 41, 47, 53, 59) to identify potential market reversals. It also integrates the RSI (Relative Strength Index) to confirm overbought and oversold conditions, triggering buy and sell signals when conditions align with the ATT sequence and RSI level.
Turning Points: Detected based on the ATT sequence applied to bar count. This suggests high-probability areas where the market could turn.
RSI Filter: Adds strength to the signals by ensuring buy signals occur when RSI is oversold (<30) and sell signals when RSI is overbought (>70).
Max Signals Per Session: Limits signals to two per session to reduce over-trading.
Entry Criteria
Buy Signal: Enter a buy trade if:
The indicator displays a green "BUY" marker.
RSI is below the oversold level (default <30), suggesting a potential upward reversal.
Sell Signal: Enter a sell trade if:
The indicator displays a red "SELL" marker.
RSI is above the overbought level (default >70), indicating a potential downward reversal.
Exit Criteria
Take Profit (TP):
Define TP as a fixed percentage or point value based on the asset's volatility. For example, set TP at 1.5-2x the risk, or a predefined point target (like 50-100 points).
Alternatively, exit the position when price approaches a key support/resistance level or the next significant swing high/low.
Stop Loss (SL):
Place the SL below the recent low (for buys) or above the recent high (for sells).
Set a fixed SL in points or percentage based on the asset’s average movement range, like an ATR-based stop, or limit it to a specific risk amount per trade (1-2% of account).
Trailing into Profit
Use a trailing strategy to lock in profits and let winning trades run further. Two main options:
ATR Trailing Stop:
Set the trailing stop based on the ATR (Average True Range), adjusting every time a new candle closes. This can help in volatile markets by keeping the stop at a consistent distance based on recent price movement.
Break-Even and Partial Profits:
When the price moves in your favor by a set amount (e.g., 1:1 risk/reward), move SL to the entry (break-even).
Take partial profit at intermediate levels (e.g., 50% at 1:1 RR) and trail the remainder.
Risk Management for Prop Firm Evaluation
Prop firms often have strict rules on daily loss limits, max drawdowns, and minimum profit targets. Here’s how to align your strategy with these:
Limit Risk per Trade:
Keep risk per trade to a conservative level (e.g., 1% or lower of your account balance). This allows for more room in case of a drawdown and aligns with most prop firm requirements.
Daily Loss Limits:
Set a daily stop-loss that ensures you don’t exceed the firm’s rules. For example, if the daily limit is 5%, stop trading once you reach a 3-4% drawdown.
Avoid Over-Trading:
Stick to the max signals per session rule (one or two trades). Taking only high-probability setups reduces emotional and reactive trades, preserving capital.
Stick to a Profit Target:
Aim to meet the evaluation’s profit goal efficiently but avoid risky or oversized trades to reach it faster.
Avoid Major Economic Events:
News events can disrupt technical setups. Avoid trading around significant releases (like FOMC or NFP) to reduce the chance of sudden losses due to high volatility.
Summary
Using this strategy with discipline, a structured entry/exit approach, and tight risk management can maximize your chances of passing a prop firm evaluation. The ATT model’s turning points, combined with the RSI, provide an edge by highlighting reversal zones, while limiting trades to 1-2 per session helps maintain controlled risk.

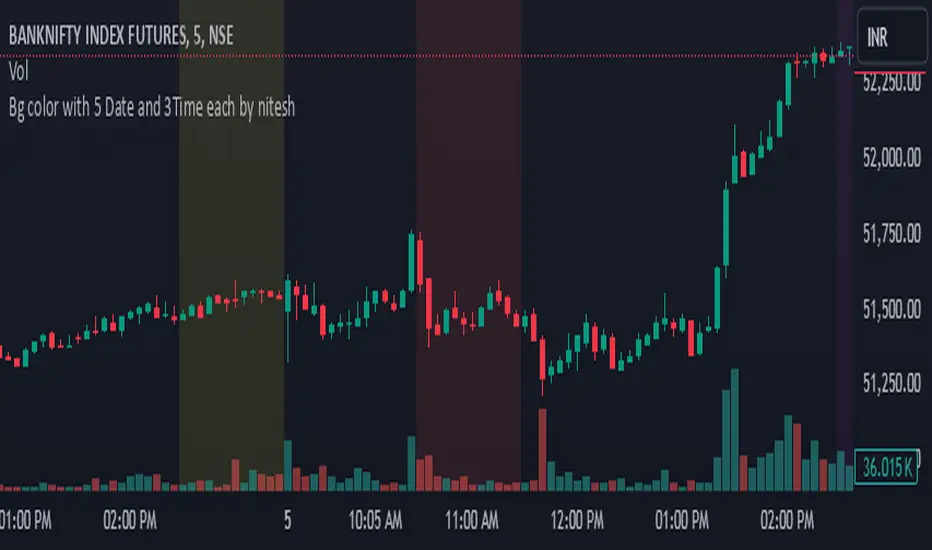
Bg color with 5 Date and 3 Time each by nitesh Bg color with 5 Date and 3Time each by nitesh this indicator will plot background color on the chart on your selected date and time spaan it hase three time spaan you can select time according to your need i have created this indicator to backtest time based price movments may this be helpful to you too (jai shree ram)
Cumulative Volume Distribution Spread Intrabar with BandsUpdated Description:
This script, "Cumulative Volume Spread by Levels with Histogram", analyzes cumulative buying and selling pressure at various price levels of each bar, based on intra-bar data from a lower timeframe (like 1-second bars). It visualizes the results using lines, histograms, and color-filled areas.
Key Concepts:
Price Levels: The script splits each bar into four distinct levels:
High to max(open, close): The range from the highest price of the bar to the higher of the open or close prices.
Max(open, close) to midline: The range from the higher of the open or close to the midpoint of the bar.
Midline to min(open, close): The range from the midpoint to the lower of the open or close.
Min(open, close) to low: The range from the lower of the open or close to the lowest price of the bar.
Volume Pressures:
The script fetches volume data from a lower timeframe (default is 1-second bars) to capture intra-bar buying and selling pressure.
Buying Pressure: Calculated when the close is greater than the open.
Selling Pressure: Calculated when the close is less than the open.
Cumulative Pressures:
The script accumulates buy and sell volumes within each of the four price levels described above.
At the beginning of a new day, these cumulative values are reset.
Spread Calculation:
For each level, the script calculates the spread between cumulative buying and selling volumes (i.e., buy pressure minus sell pressure). A positive spread indicates more buying pressure, and a negative spread indicates more selling pressure.
The script calculates an Exponential Moving Average (EMA) of the spread changes for each section:
EMA Spread High to Max Open/Close
EMA Spread Max Open/Close to Midline
EMA Spread Midline to Min Open/Close
EMA Spread Min Open/Close to Low
Fill Between Levels:
The areas between the key price levels are filled based on whether the EMA of the spread is positive (green) or negative (red). This helps to visually indicate where buying or selling pressure is stronger.
Background Color:
The script determines an overall background color based on the relative strength of cumulative buying vs. selling pressure. If cumulative buying pressure is stronger across the levels, the background turns green; if selling pressure dominates, it turns red.

Fluid Dynamics-Inspired Indicator with Bidirectional ScalingThe "Enhanced Fluid Dynamics-Inspired Indicator with Bidirectional Scaling" is a sophisticated technical analysis tool that draws inspiration from the principles of fluid dynamics to measure both upward and downward price movements, while also incorporating volatility and momentum into its calculations. The indicator aims to provide traders with a clear understanding of market dynamics by analyzing "streamflow" (price and volume movements) in both directions, enhanced with adaptive scaling techniques.
Key Features:
Bidirectional Price Momentum:
The indicator separately calculates positive and negative momentum using the price's rate of change. This allows for independent analysis of upward and downward price movements, providing a balanced view of the market's direction.
Streamflow Model:
The "streamflow" is calculated by multiplying volume flow with price momentum. This approach treats the market as a fluid system, where the momentum and volume of trades influence the flow of prices in both upward and downward directions. Streamflow is calculated independently for each direction.
Adaptive Volatility Scaling:
Volatility is dynamically calculated using the Average True Range (ATR) and is weighted to adjust to varying market conditions. An adaptive logarithmic scaling factor is applied to the volatility to capture the dynamic nature of market environments.
DRMA (Displaced Rolling Moving Average):
The indicator uses the DRMA function to smooth out price and volume data, improving the accuracy of its measurements. This allows the indicator to capture longer-term trends while still being responsive to short-term fluctuations.
Non-Linear Scaling and Normalization:
To ensure that the output values are within a usable range, the indicator employs a sigmoid-based non-linear scaling function. This helps normalize the composite output, making it easier to interpret overbought and oversold conditions.
Visual Representation:
The indicator plots two separate lines for upward and downward market movements, making it easy to distinguish between bullish and bearish trends. Background colors are also used to highlight periods of strong upward or downward momentum, as well as high volatility.
Overbought/Oversold Conditions:
Upper and lower thresholds are used to signal potential overbought and oversold conditions. Alerts are triggered when the market moves into extreme levels, helping traders identify potential entry and exit points.
Usage:
This indicator is designed for traders who are looking for a more nuanced and dynamic tool to measure both bullish and bearish trends. By using bidirectional scaling, it provides clearer signals for market direction, while adaptive volatility and momentum adjustments ensure the indicator responds to different market environments. The alert conditions make it especially useful for timing trades in highly volatile conditions or when price movements reach extreme levels.

Bernoulli Price Dynamics with IntraBar Volume (Bidirectional)This indicator adapts the principles of Bernoulli’s equation from fluid dynamics to analyze price and volume dynamics in the market. By incorporating intrabar volume data and splitting price movements into upward and downward components, it provides a bidirectional view of the market's kinetic and potential energies. This approach helps assess market pressure in both upward and downward directions, offering insights into potential price movement with energy-based mechanics.
Key Features:
Intrabar Volume Integration: The indicator collects up and down volume data from a lower timeframe, such as seconds or minutes, to provide more granular insights.
Bidirectional Market Pressure: By separating upward and downward price movements, it calculates market pressure in both directions, which is akin to fluid pressure. The separation enables tracking of distinct upward and downward energy flows in the market.
Energy Calculation:
Kinetic Energy: This represents the "movement" aspect of the price, weighted by volume. It is calculated for both upward and downward movements based on price velocity squared.
Potential Energy: This represents the "position" aspect of the price, calculated as the product of volume and the current price level. It is also separated into upward and downward components.
Market Pressure: The difference between the total energy (sum of kinetic and potential energies) and the highest observed total energy over a defined period (N). This provides an insight into the current momentum of price movement in both directions.
Visualization:
Market Pressure Up/Down: Plots the calculated market pressure for upward (green) and downward (red) movements.
Kinetic and Potential Energies: Provides individual plots for kinetic and potential energy in both directions to analyze the behavior of price and volume in more detail.
This indicator can be used to track market momentum and potential reversals by understanding the energy and pressure dynamics in both upward and downward price movements.

RSI Ignoring Gaps Between DaysThe RSI Ignoring Gaps Between Days indicator is an advanced modification of the traditional Relative Strength Index (RSI) designed to exclude price gaps that occur between the last bar of one trading day and the first bar of the next. This ensures that the RSI calculations remain focused on the actual price action during the trading session, avoiding distortions caused by overnight price gaps.
Key Features:
Gap Ignoring Mechanism: The indicator detects when a new day begins and skips the price change between the last bar of the previous day and the first bar of the current day. This ensures that only the intra-day price changes are included in the RSI calculation.
Intra-day Price Movement: The RSI calculations are based on real price changes within each trading day, providing a clearer reflection of momentum without interference from overnight events.
Dynamic RSI Calculation: The traditional RSI formula is preserved, but gains and losses are recalculated based on price changes from bar to bar within the same day.
Overbought/Oversold Levels: The indicator retains standard RSI overbought (70) and oversold (30) levels, allowing traders to easily identify potential reversal zones.
Alerts for Crossovers: Built-in alert conditions trigger when the RSI crosses key levels (30 or 70), signaling potential buying or selling opportunities.
This indicator is particularly useful for traders looking to focus on intra-day price action and avoid the influence of gaps caused by overnight market activity. It is suitable for intraday trading strategies where consistency in price movement measurement is crucial.
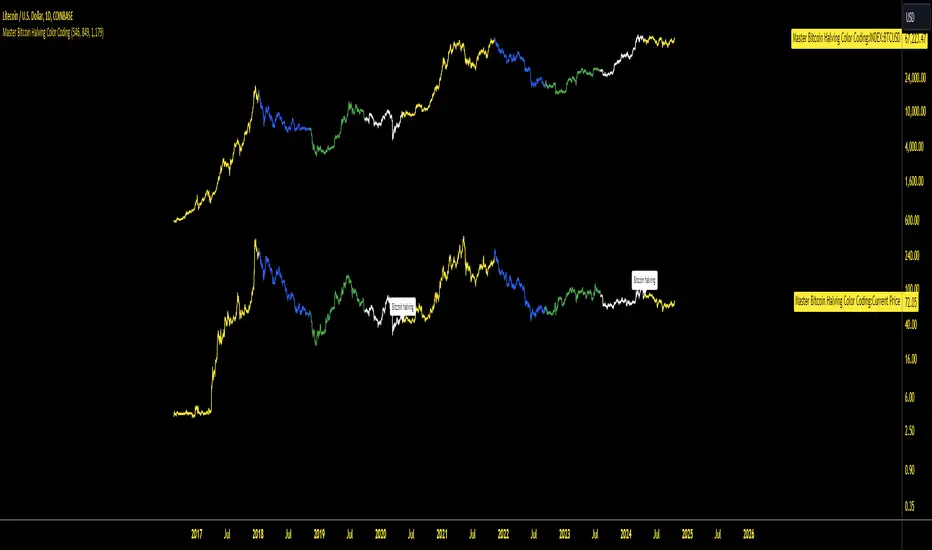
Master Bitcoin Halving Color CodingMaster Bitcoin Halving Color Coding is a customizable TradingView indicator that visualizes Bitcoin price trends relative to its halving events. It color-codes price data based on the number of days since the most recent halving:
Yellow: 0–546 days post-halving
Blue: 547–849 days
Green: 850–1179 days
White: 1180+ days
Ichimoku Wave Oscillator with Custom MAIchimoku Wave Oscillator with Custom MA - Pine Script Description
This script uses various types of moving averages (MA) to implement the concept of Ichimoku wave theory for wave analysis. The user can select from SMA, EMA, WMA, TEMA, SMMA to visualize the difference between short-term, medium-term, and long-term waves, while identifying potential buy and sell signals at crossover points.
Key Features:
MA Type Selection:
The user can select from SMA (Simple Moving Average), EMA (Exponential Moving Average), WMA (Weighted Moving Average), TEMA (Triple Exponential Moving Average), and SMMA (Smoothed Moving Average) to calculate the waves. This script is unique in that it combines TEMA and SMMA, distinguishing it from other simple moving average-based indicators.
TEMA (Triple Exponential Moving Average): Best suited for capturing short-term trends with quick responsiveness.
SMMA (Smoothed Moving Average): Useful for identifying long-term trends with minimal noise, providing more stable signals.
Wave Calculations:
The script calculates three waves: Wave 9-17, Wave 17-26, and Wave 9-26, each of which analyzes different time horizons.
Wave 9-17 (blue): Primarily used for analyzing short-term trends, ideal for detecting quick changes.
Wave 17-26 (red): Used to analyze medium-term trends, providing a more stable market direction.
Wave 9-26 (green): Represents long-term trends, suitable for understanding broader trend shifts.
Baseline (0 Line):
Each wave is visualized around the 0 line, where waves above the line indicate an uptrend and waves below the line indicate a downtrend. This allows for easy identification of trend reversals.
Crossover Signals:
CrossUp: When Wave 9-17 (short-term wave) crosses Wave 17-26 (medium-term wave) upward, it is considered a buy signal, indicating a potential upward trend shift.
CrossDown: When Wave 9-17 (short-term wave) crosses Wave 17-26 downward, it is considered a sell signal, indicating a potential downward trend shift.
Background Color for Signal:
The script visually highlights the signals with background colors. When a buy signal occurs, the background turns green, and when a sell signal occurs, the background turns red. This makes it easier to spot reversal points.
Calculation Method:
The script calculates the difference between moving averages to display the wave oscillation. Wave 9-17, Wave 17-26, and Wave 9-26 represent the difference between the moving averages for different time periods, allowing for analysis of short-term, medium-term, and long-term trends.
Wave 9-17 = MA(9) - MA(17): Represents the difference between the short-term moving averages.
Wave 17-26 = MA(17) - MA(26): Represents the difference between medium-term moving averages.
Wave 9-26 = MA(9) - MA(26): Provides insight into the long-term trend.
This calculation method effectively visualizes the oscillation of waves and helps identify trend reversals at crossover points.
Uniqueness of the Script:
Unlike other moving average-based indicators, this script combines TEMA (Triple Exponential Moving Average) and SMMA (Smoothed Moving Average) to capture both short-term sensitivity and long-term stability in trends. This duality makes the script more versatile for different market conditions.
TEMA is ideal for short-term traders who need quick signals, while SMMA is useful for long-term investors seeking stability and noise reduction. By combining these two, this script provides a more refined analysis of trend changes across various timeframes.
How to Use:
This script is effective for trend analysis and reversal detection. By visualizing the crossover points between the waves, users can spot potential buy and sell signals to make more informed trading decisions.
Scalping strategies can rely on Wave 9-17 to detect quick trend changes, while those looking for medium-term trends can analyze signals from Wave 17-26.
For a broader market overview, Wave 9-26 helps users understand the long-term market trend.
This script is built on the concept of wave theory to anticipate trend changes, making it suitable for various timeframes and strategies. The user can tailor the characteristics of the waves by selecting different MA types, allowing for flexible application across different trading strategies.
Ichimoku Wave Oscillator with Custom MA - Pine Script 설명
이 스크립트는 다양한 이동 평균(MA) 유형을 활용하여 일목 파동론의 개념을 기반으로 파동 분석을 시도하는 지표입니다. 사용자는 SMA, EMA, WMA, TEMA, SMMA 중 원하는 이동 평균을 선택할 수 있으며, 이를 통해 단기, 중기, 장기 파동 간의 차이를 시각화하고, 교차점에서 상승 및 하락 신호를 포착할 수 있습니다.
주요 기능:
이동 평균(MA) 유형 선택:
사용자는 SMA(단순 이동 평균), EMA(지수 이동 평균), WMA(가중 이동 평균), TEMA(삼중 지수 이동 평균), SMMA(평활 이동 평균) 중 하나를 선택하여 파동을 계산할 수 있습니다. 이 스크립트는 TEMA와 SMMA의 독창적인 조합을 통해 기존의 단순한 이동 평균 지표와 차별화됩니다.
TEMA(삼중 지수 이동 평균): 빠른 반응으로 단기 트렌드를 포착하는 데 적합합니다.
SMMA(평활 이동 평균): 장기적인 추세를 파악하는 데 유용하며, 노이즈를 최소화하여 안정적인 신호를 제공합니다.
파동(Wave) 계산:
이 스크립트는 Wave 9-17, Wave 17-26, Wave 9-26의 세 가지 파동을 계산하여 각각 단기, 중기, 장기 추세를 분석합니다.
Wave 9-17 (파란색): 주로 단기 추세를 분석하는 데 사용되며, 빠른 추세 변화를 포착하는 데 유용합니다.
Wave 17-26 (빨간색): 중기 추세를 분석하는 데 사용되며, 좀 더 안정적인 시장 흐름을 보여줍니다.
Wave 9-26 (녹색): 장기 추세를 나타내며, 큰 흐름의 방향성을 파악하는 데 적합합니다.
기준선(0 라인):
각 파동은 0 라인을 기준으로 변동성을 시각화합니다. 0 위에 있는 파동은 상승세, 0 아래에 있는 파동은 하락세를 나타내며, 이를 통해 추세의 전환을 쉽게 확인할 수 있습니다.
파동 교차 신호:
CrossUp: Wave 9-17(단기 파동)이 Wave 17-26(중기 파동)을 상향 교차할 때, 상승 신호로 간주됩니다. 이는 단기적인 추세 변화가 발생할 수 있음을 의미합니다.
CrossDown: Wave 9-17(단기 파동)이 Wave 17-26(중기 파동)을 하향 교차할 때, 하락 신호로 해석됩니다. 이는 시장이 약세로 돌아설 가능성을 나타냅니다.
배경 색상 표시:
교차 신호가 발생할 때, 상승 신호는 녹색 배경, 하락 신호는 빨간색 배경으로 시각적으로 강조되어 사용자가 신호를 쉽게 인식할 수 있습니다.
계산 방식:
이 스크립트는 이동 평균 간의 차이를 계산하여 각 파동의 변동성을 나타냅니다. Wave 9-17, Wave 17-26, Wave 9-26은 각각 설정된 주기의 이동 평균(MA)의 차이를 통해, 시장의 단기, 중기, 장기 추세 변화를 시각적으로 표현합니다.
Wave 9-17 = MA(9) - MA(17): 단기 추세의 차이를 나타냅니다.
Wave 17-26 = MA(17) - MA(26): 중기 추세의 차이를 나타냅니다.
Wave 9-26 = MA(9) - MA(26): 장기적인 추세 방향을 파악할 수 있습니다.
이러한 계산 방식은 파동의 변동성을 파악하는 데 유용하며, 추세의 교차점을 통해 상승/하락 신호를 잡아냅니다.
스크립트의 독창성:
이 스크립트는 기존의 이동 평균 기반 지표들과 달리, TEMA(삼중 지수 이동 평균)와 SMMA(평활 이동 평균)을 함께 사용하여 짧은 주기와 긴 주기의 트렌드를 동시에 파악할 수 있도록 설계되었습니다. 이를 통해 단기 트렌드의 민감한 변화와 장기 트렌드의 안정성을 모두 반영합니다.
TEMA는 단기 트레이더에게 빠르고 민첩한 신호를 제공하며, SMMA는 장기 투자자에게 보다 안정적이고 긴 호흡의 트렌드를 파악하는 데 유리합니다. 두 지표의 결합으로, 다양한 시장 환경에서 추세의 변화를 더 정교하게 분석할 수 있습니다.
사용 방법:
이 스크립트는 추세 분석과 변곡점 포착에 효과적입니다. 각 파동 간의 교차점을 시각적으로 확인하고, 상승 또는 하락 신호를 포착하여 매매 시점 결정을 도울 수 있습니다.
스캘핑 전략에서는 Wave 9-17을 주로 참고하여 빠르게 추세 변화를 잡아내고, 중기 추세를 참고하고 싶은 경우 Wave 17-26을 사용해 신호를 분석할 수 있습니다.
장기적인 시장 흐름을 파악하고자 할 때는 Wave 9-26을 통해 큰 트렌드를 확인할 수 있습니다.
이 스크립트는 파동 이론의 개념을 기반으로 시장의 추세 변화를 예측하는 데 유용하며, 다양한 시간대와 전략에 맞추어 사용할 수 있습니다. 특히, 사용자가 선택한 MA 유형에 따라 파동의 특성을 변화시킬 수 있어, 여러 매매 전략에 유연하게 대응할 수 있습니다.

Relative PPP for USDBRLThis indicator calculates the USDBRL exchange rate using the Relative Purchasing Power Parity method, which considers that the variation in the exchange rate is equal to the variation in inflation in Brazil minus the variation in inflation in the US. It is derived from the Law of One Price, which states that an identical good should have the same price in different markets when adjusted for exchange rates, assuming the absence of arbitrage barriers such as transaction costs or trade restrictions.
The indicator is calculated starting from June 1994, at the launch of the Real Plan, which equalized the value of the Brazilian Real and the US Dollar at that time. This indicator is useful for providing an idea of the long-term trend of the Dollar exchange rate (months or years), acting similarly to a moving average, around which the exchange rate gravitates.
It's useful for analysts who have to forecast the USDBRL in the long term.

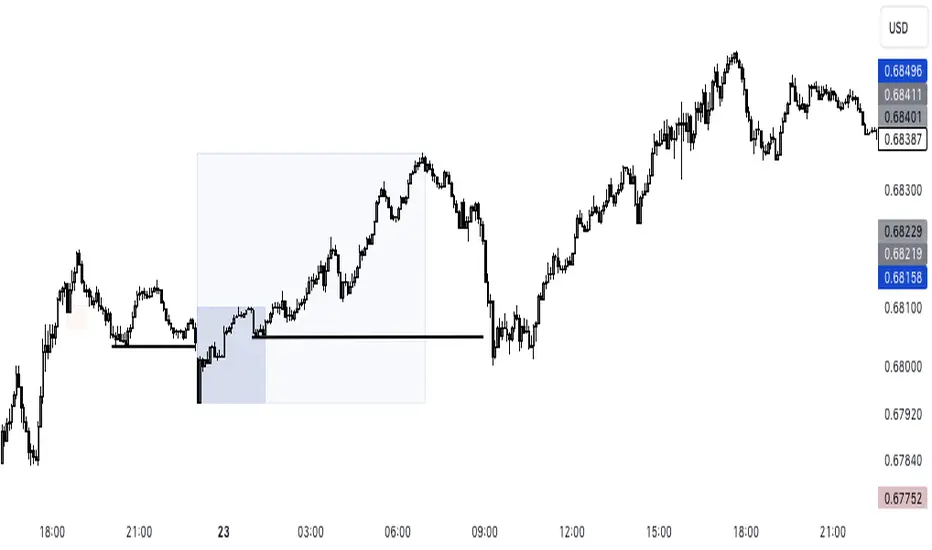
asia session w shieldIntroduction
This Script displays the Asia Session Range
Description
The Indicator is based on UTC -7 timing but displays the Session Boxes automatically correct at your chart so you do not have to adjust any timings based on your Time Zone and don't have to do any calculations based on your UTC. It is already perfect.
You will see on default settings the blue Asia Box, the special ' invalid shield ' feature is there because first two hours are spread timing.
Most Timing-based Indicators have "bugged" boxes or don't show clean boxes at all and don't adjust at daylight savings times, we made sure that everything automatically gets adjusted so you don't have to! So the timings will always display at the correct time regarding the daylight savings times.
Combining Timing with Liquidity Zones the right way and in a clear, clean, and simple format.
Different than others this script also shows the "true" Asia range as it respects the "day open gap" which affects the Asia range in other scripts and it also covers the full 8 hours of Asia Session.
Recommended Use
The most beautiful display is on the M5 Timeframe as you have a clear overview of all sessions without losing the intraday view. You can also use it on the M1 for more details or the M15 for the bigger picture. The Template can hide on higher time frames starting from the H1 to not flood your chart with boxes.
How to use the Asia Session Range Box
Use the Asia Range Box as your intraday Guide, keep in mind that a Breakout of Asia high or low induces Liquidity and a common price behavior is a reversal after the fake breakout of that range.
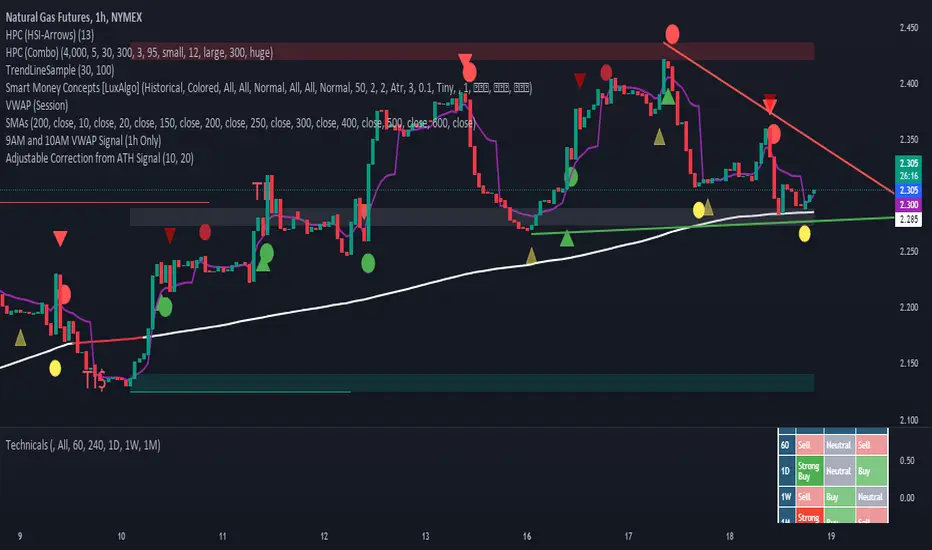
Adjustable Correction from ATH SignalA "Correction Signal from All-Time High" is an indicator used to identify potential reversals or pullbacks in an asset's price after it has reached its highest historical level, known as an all-time high (ATH). This signal typically occurs when the price begins to decline after hitting the ATH, suggesting a correction phase where the asset retraces part of its upward movement.
Key elements of this signal include:
Overbought Conditions: The asset may have experienced a strong rally leading to an overbought condition, where the price could be considered too high relative to recent trends.
Reversal Patterns: The correction signal is often accompanied by technical patterns or indicators that suggest a reversal, such as bearish candlestick formations, negative divergence in momentum indicators, or moving average crossovers.
Percentage Decline: A correction is generally defined as a price drop of at least 10% from the ATH, although smaller pullbacks may also signal potential market shifts.
Volume Analysis: Increased selling volume after the ATH can validate the correction signal, indicating that more market participants are taking profits or exiting positions.
This signal helps traders and investors anticipate periods of market consolidation or potential downturns after significant price advances, allowing for better risk management or entry points for new positions.