DCA Alpha 1.0 Trading Tool for Dollar-Cost Averaging
Description:
DCA Alpha 1.0 is a precision-engineered trading tool designed to assist traders and investors in accumulating assets during market downturns. Using proprietary algorithms that combine momentum decay, extreme price deviation metrics, trend dynamics, divergence analysis, and mean regression, it identifies potential bottom extreme zones in various asset classes such as indices, stocks, crypto, and commodities.
This indicator highlights market conditions where assets are oversold, undervalued, or experiencing capitulation—providing disciplined, unleveraged dollar-cost averaging (DCA) opportunities. Ideal for long-term growth strategies, DCA Alpha 1.0 helps cut through market noise, pinpointing moments of peak fear and maximum reward potential.
Whether navigating volatile crypto markets, timing corrections in indices, or accumulating commodities, DCA Alpha 1.0 serves as a vital tool for mastering the art of buying low and building your assets up strategically.
Instructions:
Getting Started:
Add the Indicator:
Install DCA Alpha 1.0 on your TradingView chart.
Select your preferred asset class: stocks, indices, crypto, or commodities.
Choose an appropriate timeframe (e.g., daily or weekly for long-term DCA strategies).
Customize Inputs: Adjust the following settings to align with your strategy:
Percentage of Equity to Trade: Define the portion of your portfolio to allocate per signal (default: 1% equity).
Profit Target Percentages: Set thresholds for locking in gains (default: 50% on lower timeframes, 500% on higher timeframes).
Zones and Signals:
Extreme Negative Zones:
What It Represents:
These zones highlight conditions where prices are deeply oversold, indicating extreme bearish sentiment. The market is likely nearing a bottom, offering high-probability buying opportunities.
Entry Signals:
When the price enters these extreme negative zones, visual markers (e.g., green triangles or other indicators) will signal a potential buying opportunity. These moments are indicative of market exhaustion, signaling that a reversal could be imminent.
Momentum Decay & Divergence:
Momentum decay occurs when price movement slows over time. In extreme negative zones, if prices continue to fall but at a diminishing rate (e.g., decreased volume or a fading oscillator), it suggests weakening bearish momentum. This, coupled with bullish divergence (oscillator forming higher lows while price makes lower lows), signifies a reversal, making it an ideal point to consider dollar-cost averaging into the asset.
Neutral Zones:
What It Represents:
The neutral zone is a state of market equilibrium, where prices are neither overbought nor oversold. The market is in a balanced state, with no strong trend emerging.
Mean Regression:
In a neutral zone, the market is reverting to its mean or average price after overreacting in either direction. A price transition from extreme zones (overbought/oversold) to the neutral zone suggests a reversion to the market's long-term average, making this a period of reduced volatility and uncertainty.
Entering or Exiting Neutral Zones:
Traders should avoid entering or exiting positions during neutral zone conditions unless transitioning from an extreme zone (negative or positive). Transitioning from an extreme negative zone to neutral may suggest an opportunity to accumulate assets gradually, while a shift from neutral to an extreme negative zone may indicate a deeper correction and warrant caution.
Momentum Decay & Divergence (Exiting Neutral Zone):
If prices are rising but the oscillator shows lower highs (bearish divergence), and momentum is fading, this could signal a pullback. A transition out of the neutral zone in this context may prompt traders to hold off on new positions or consider profit-taking.
Extreme Positive Zones:
What It Represents:
Markets can also become overbought or overvalued. When price enters extreme positive zones, the asset may be overvalued, suggesting potential selling or a waiting period.
Exit Signals:
Red triangle indicators signal potential exit points when prices reach overbought conditions, signaling a time to lock in profits and reduce exposure.
Momentum Decay & Divergence (Exiting Positive Zone):
When prices are making new highs but momentum is weakening (momentum decay) and the oscillator is showing lower highs (bearish divergence), this could indicate a faltering rally. Such conditions represent an ideal time to reduce exposure or exit positions.
Key Inputs for Customization:
Percentage of Equity to Trade:
This setting allows you to allocate a portion of your total portfolio per buy signal. By default, 1% of equity is used per signal, but this can be adjusted based on your risk tolerance and strategy.
Profit Target Percentages:
These thresholds help lock in gains once the price moves a set percentage in your favor.
Lower Timeframes: Default profit target of 50%.
Higher Timeframes: Default profit target of 500%.
These settings can be customized for specific risk/reward preferences.
Warning!!! : Aggressive Mode
Aggressive Mode is an advanced feature designed for traders who want to increase the frequency of signals during periods of market volatility. This mode will trigger more frequent entries, even into slightly less extreme zones, capturing short-term reversals.
What Aggressive Mode Does:
It amplifies signals by allowing the tool to identify more frequent price reversals, including brief market corrections, increasing trade frequency. While this can offer more trading opportunities, it also exposes you to higher risk.
Warning:
Aggressive Mode should be used only by experienced traders familiar with short-term volatility. The increased frequency of signals could lead to higher risk exposure. Ensure robust risk management practices, such as stop-loss orders and profit-taking strategies, are in place before activating this mode.
Default Setting:
Aggressive Mode is disabled by default. It can be activated at your discretion based on your experience level and risk appetite.
Best Practices:
Focus on High-Quality Assets: Prioritize assets with strong recovery potential (e.g., major indices, blue-chip cryptocurrencies).
Use Longer Timeframes: Minimize market noise and optimize your DCA strategy by focusing on higher timeframes (e.g., daily or weekly charts).
Review Trading Inputs: Regularly adjust your inputs to ensure they align with your financial goals and risk tolerance.
Implement Risk Management: Use stop-loss orders and profit targets to manage risk, especially when using Aggressive Mode.
Disclaimer:
DCA Alpha 1.0 is designed specifically for unleveraged, long-term dollar-cost averaging strategies. It is not intended for day trading or leveraged positions. The tool excels at identifying market dips but cannot guarantee success. Users are fully responsible for their own risk management, including the use of stop-losses, profit targets, and position sizing.
Aggressive Mode increases trade frequency and may lead to higher exposure and potential losses. Only experienced traders should consider using this mode. Always understand the risks involved before incorporating this tool into your trading strategy.
Cari dalam skrip untuk "Divergence"

PA Builder [PrimeAutomation]1. PA Builder – Overview
PA Builder is not a fixed strategy; it’s a framework for building strategies. Instead of giving traders one rigid system, it provides a toolbox where entries, exits, filters, risk parameters, and automation rules can all be defined and combined. The core philosophy is confluence: the idea that a trade should only be taken when multiple independent signals agree. The Builder is built around this principle. Every module; trend, reactors, bands, reversals, volume, structure, divergences, externals can be treated as one layer of confidence. The stronger the alignment across layers, the higher the quality of the setup in theory.
In practice, this means PA Builder encourages traders to think in terms of “confluence,” not single indicators. Trend and positioning define whether you should even be looking for longs or shorts. Timing tools such as bands, reversals and candlestick structures determine when inside that broader bias you want to engage. Confirmation tools like volume and flow tell you whether capital is actually supporting the move. Filter systems then ensure that even if everything looks good locally, you still respect higher-timeframe or opposing warnings. The Builder’s philosophy is simple: enter less often, but only when conditions are genuinely in your favour.
2. Core Entry Signal Components
The entry logic in PA Builder is built on a set of signal engines that can be combined in many ways. Trend Signals form a natural foundation. They use low-lag low-pass filters, borrowed from audio signal processing, to extract directional bias from price without the classic delay of classical moving averages. The sensitivity parameter controls how reactive this engine is: lower values favour cleaner trends and fewer whipsaws, while higher values are better suited to short-term intraday trading where speed matters more than smoothness. Many traders start by requiring that Trend Signals show “all bullish” or “all bearish” before allowing any entries in that direction.
Trend signals firing short positions
On top of this directional backbone, the Dynamic Reactor behaves as an adaptive baseline. It accelerates in volatile phases and slows down during consolidation, effectively acting as a moving reference point for both trend and price position. A typical use of this module is to insist that, for long trades, the price sits above a bullish reactor; for shorts, below a bearish one. At the higher-timeframe level, the Quantum Reactor provides a VWAP-style reference that can be anchored to larger candles than the chart you are trading. A common configuration is to trade on a 15-minute chart while requiring that price is above the 4-hour Quantum Reactor for longs or below it for shorts. The “fast” and “slow” options determine how quickly this reference adapts to new information.
Timing is then refined with tools like Quantum Bands, reversals and candle structure analysis. Quantum Bands identify extremes within the current environment. In an uptrend, a tag of the lower band can be treated as a pullback rather than a breakdown; in a downtrend, the upper band acts like a shorting zone. Many traders combine “trend up and above higher-timeframe reactor” with “price temporarily below lower band” to construct a mean-reversion entry inside a larger uptrend. Reversal detection modules examine recent bars to find turning points, with shorter lookbacks capturing fast flips and longer lookbacks tracking deeper structural changes. Candle structure logic goes beyond classical candlestick names and instead focuses on whether price action confirms follow-through or reversion behaviour, with options like “2X” modes that wait for two successive confirmations before acting.
Before and after filtering using reactor applied.
Additional confirmation layers come from Volume Matrix, Money Flow, OSC True7 and divergence detection. Volume and flow tools answer whether actual capital is participating in the move or whether price is drifting on thin activity. OSC True7 categorises the state of the trend into intuitive buckets, strong, healthy, neutral, or exhausted, making it easier to avoid chasing extremes. Divergences between price and momentum can be used either as entry triggers in contrarian systems or as hard filters that block trades when warning signs are present. Finally, two external indicator inputs make it possible to integrate RSI, MACD, custom indicators or even other strategies into the Builder, either as simple thresholds or as comparative logic between two external sources (for example, requiring a fast EMA to be above a slow EMA before allowing longs).
3. Exit System & Trade Management
The exit systems in PA Builder are designed to be as vital as the entry logic. It assumes exits are not an afterthought, but half of the edge. Instead of forcing a single take profit point, the system uses a three-tier structure where you can assign different portions of the position to different targets. A common pattern is to scale out a small portion early (for example at one ATR), another portion at an intermediate level, and keep the largest slice for a deeper move. This creates a natural balance: you book something early to reduce emotional stress, while leaving room to participate in the full potential of a trend.
Targets can be defined using ATR multiples or risk-to-reward ratios that are directly tied to the initial stop distance. Using ATR keeps exits proportional to current volatility. A two ATR target in a quiet environment is very different in absolute price distance from the same multiple in a high-volatility environment, yet conceptually it represents the same “size” move. Risk-to-reward exits build on this by ensuring that if you risk one unit (1R), the reward targets are set at predefined multiples of that risk. This enforces positive expectancy at the structural level: the strategy cannot generate entries with inherently negative payoffs.
Once price begins to move in your favour, trailing logic takes over if you choose to enable it. Trailing can begin immediately from entry or only after a target has been hit. Many users prefer to let TP1 and TP2 behave as fixed profit points and then apply a trailing stop or trailing take profit to the final remainder. That way, routine winners are banked mechanically, while occasional explosive moves can be ridden for as long as the market allows. The breakeven module supports this behaviour by automatically moving stops to entry (or slightly through entry into profit) after a specified condition such as TP1 being hit. This transforms the risk profile mid trade: once breakeven has been secured, remaining size can be managed with much less psychological pressure.
The system also recognises the cost of time. Kill Switch functionality exits trades that have been open too long under mediocre conditions, typically when they are in modest profit but not progressing. This protects you from capital being tied up while better opportunities appear elsewhere. Underlying all of this are several trailing stop mechanisms: percentage-based, tick-based for very short-term strategies, TP linked trailing that activates only once a certain profit threshold has been achieved, and ATR based trailing that automatically scales the trail distance with volatility. Each method serves a slightly different profile of strategy, but all share the same aim: preserve gains and limit downside in a structured way rather than rely on discretionary judgement after the fact.
4. Filters and Risk Management
The filter systems in PA Builder formalise the idea that good trading is often about knowing when not to act. “Do Not Trade” conditions can be configured so that even a perfectly aligned bullish entry stack is overridden if certain bearish evidence is present. These can include higher timeframe reversal structures, powerful opposing divergences, or conflicting signals in key modules. By assigning conditions specifically to “Do Not Long” and “Do Not Short” rather than only to entries, you create asymmetry: buying requires bullish evidence and an absence of strong bearish warnings; selling requires the mirror.
Volatility filters extend this logic to the regime level. Some strategies are inherently suited to low volatility, range bound environments where fading extremes is profitable; others require expansion and energy to function properly. By binding trading permission to volatility ranges, you ensure that a mean-reversion system does not blindly attempt to fade a breakout, and that a momentum system does not spin its wheels in a dead, sideways market. You can even reference volatility from a higher timeframe than the one you trade, so that a five-minute strategy is still aware of the broader one-hour volatility regime it sits inside.
Applied DO NOT TRADE - removes poor signal
Risk management and position sizing are configured so each trade is expressed in units of risk rather than arbitrary size. Leverage, in this framework, is simply a scaling factor for capital efficiency; the actual risk per trade is still controlled by the distance between entry and stop and the percentage of equity you choose to expose. Reinvestment options then decide what proportion of accumulated profit is fed back into position sizing. A more aggressive reinvestment setting accelerates compounding but increases the amplitude of drawdowns; a more conservative one smooths the equity curve at the cost of slower growth. The Base Trade Value parameter ties all of this together by deciding how much nominal capital or how many contracts are committed per trade in light of your maximum allowed simultaneous positions and your intended use of leverage.
External exit conditions provide further flexibility. For example, you might design a system whose entries rely purely on PA Builder’s internal modules, but whose exits use RSI readings, moving average crosses, or a proprietary external indicator. The separation of entry and exit logic allows you to bolt on different behaviours at the tail end of trades while keeping your core signal engine intact. In all cases, the objective is the same: express risk in a controlled, repeatable way that can survive long stretches of unfavourable market conditions.
5. PDT, Cooldowns and Visual Modes
For traders subject to Pattern Day Trading rules, PA Builder includes a day-trade tracking system that counts business days correctly and respects the three-trades-in-five-days limit. This goes beyond simple compliance; it forces discipline. When intraday trading is heavily constrained, you are naturally pushed toward swing-oriented strategies with fewer, more selective entries. The tool visually marks your PDT status so you never inadvertently cross the line and trigger a lockout.
Cooldown systems address another reality: psychological vulnerability after streaks. Following several consecutive wins, many traders unconsciously loosen their standards, take marginal signals, oversize positions, or overtrade. A win-streak cooldown deliberately pauses trading after a configured number of wins, giving you time to reset. The same applies to losing streaks. After a run of losses, the strongest temptation is often to “make it back now,” which is exactly when discipline is weakest. A loss-streak cooldown enforces a break in activity during this high-risk emotional state, helping to prevent cascading damage driven by revenge trading.
Visualisation comes in two main modes. Classic mode emphasises precision: it draws explicit entry lines, stop levels, target levels and fill zones, making it easy to audit risk/reward on each trade, verify that the exit logic behaves as intended, and review historical trades in detail. Modern mode emphasises market feel: instead of focusing on exact levels, it colours candles and backgrounds to reflect momentum, profit state and dynamics.
This helps you see at a glance whether a strategy is operating in a smooth trending environment or a choppy, fragmented one, and whether current trades are broadly working or struggling. Many users develop and debug in Classic mode and then monitor live performance in Modern mode, so both representations become part of the workflow.
6. Strategy Design Workflow, Examples and Cautions
Designing with PA Builder is inherently iterative. You begin with a simple theory and a minimal configuration, perhaps just a trend filter and a basic stop/target structure, and run a backtest. You then examine where the system fails. If you see many losses occurring in counter-trend conditions, you add an additional directional filter or restrict entries with a higher-timeframe reactor condition. If you observe many small whipsaw losses, you might require candle structure confirmation or volume confirmation before allowing an entry. Each change is made one at a time and evaluated. This process gradually builds a layered system where every component has a clear purpose: some reduce drawdown, some increase win rate, some cut out only the worst trades, and others help capture more of the best ones.
A conservative swing strategy might need an agreement between short-term trend signals, a higher-timeframe Quantum position, and a bullish Dynamic Reactor state, while checking that volume supports the move and that no significant bearish reversals or divergences are present on higher timeframes. It might accept relatively few trades, but each trade would be tightly controlled, scaled out over several ATR-based targets and protected with breakeven and trailing logic. On the opposite end, an aggressive scalping configuration would relax some filters, favour faster sensitivities, use short lookback reversals, and tighten stops and targets dramatically, relying on high frequency and careful volatility filtering to maintain edge.
Throughout all of this, overfitting remains the main danger. The more parameters you tune and the more coincidental rules you add to make the backtest equity curve smoother, the more likely it is that you are capturing noise rather than a real, repeatable edge. Signs of overfitting include heavily optimised numeric values with no intuitive justification, large differences between in-sample and out-of-sample results, or strategies that work spectacularly in very specific regimes and collapse elsewhere. To mitigate this, keep strategies as simple as possible, test across different market regimes (bull, bear, range), and accept that robust systems usually look less “perfect” on the historical chart.
Bridging the gap from backtest to live trading is another critical step. Before risking capital, it is wise to paper trade the configuration for a number of trades to confirm that signal frequency, behaviour and execution align with expectations. When going live, starting with minimal size and gradually scaling up based on real-world performance helps manage both financial and psychological risk. If live results diverge significantly from backtest expectations due to slippage, fees, or changing market conditions, you can adjust, reduce size, or temporarily pause rather than commit fully to a failing configuration.
Ultimately, PA Builder is designed to be a tool for building structured, rules-driven trading systems. It gives you the tools to express your ideas, test them, refine them, and run them under controlled risk. It does not remove uncertainty or guarantee results, but it does provide a clear, transparent way to translate trading concepts into executable, testable logic, and to evolve those systems as markets change and your understanding deepens.

Kaito Box with RSI Div(Dynamic Adjustment + MA + Long)The script implements a dynamic trading strategy that combines box range detection, RSI divergence signals, and moving average trend analysis. It is designed for use on OKX Signal Bots and includes features for dynamic position scaling and partial position closing. Below is a summary of its key functionalities:
Key Features:
Box Range Detection:
The script identifies price ranges using the highest high and lowest low of a configurable boxLength period.
These levels are plotted on the chart to visualize the price range.
RSI Divergence Detection:
The script calculates RSI using a configurable rsiLength.
Detects bullish divergence when price makes a lower low, but RSI makes a higher low.
Detects bearish divergence when price makes a higher high, but RSI makes a lower high.
Includes separate left and right lookback periods (leftLookback, rightLookback) for precise local extrema detection.
Customizable Moving Averages:
Supports multiple types of Moving Averages (SMA, EMA, SMMA, WMA, VWMA).
Calculates and plots MA20, MA50, MA100, and MA200 on a user-defined timeframe (custom_timeframe).
Identifies uptrends and downtrends based on the alignment of the moving averages and price levels.
Dynamic Position Scaling:
Implements dynamic position sizing for long entries and partial position closing for exits.
The percentage of position size added or closed is based on the difference between the current price and the average position price (avgPrice), with configurable minimum thresholds (minEnterPercent, minExitPercent).
Signal Integration for OKX Bots:
Sends buy/sell signals to OKX Signal Bots using the configured signalToken.
Supports market or limit orders with configurable price offsets and investment types.
Trend-Based Signal Filtering:
Only triggers long signals during downtrends and short signals during uptrends, ensuring trades align with the overall market context.
Visual Annotations:
Plots bullish and bearish divergence signals on the chart.
Displays labels showing dynamic position size adjustments and current average price during trades.
How It Works:
Long Signals:
Triggered when the price breaches the lower box range, and a bullish RSI divergence is detected.
Additional filtering ensures long trades are executed only during downtrend conditions.
Dynamically adjusts the position size based on the price difference from the average entry price.
Short Signals:
Triggered when the price breaches the upper box range, and a bearish RSI divergence is detected.
Additional filtering ensures short trades are executed only during uptrend conditions.
Dynamically closes portions of the position based on price movement relative to the average entry price.
Alerts:
Generates actionable alerts formatted for OKX bots, including order type, signal token, and dynamically calculated position sizes.
Use Case:
This strategy is well-suited for automated trading on platforms like OKX, where it can:
Exploit price ranges and RSI divergences for precise entries and exits.
Dynamically manage position sizes to optimize risk-reward.
Adapt to different market conditions using configurable parameters like moving averages, divergence lookbacks, and trend filters.
This script provides a robust foundation for traders looking to automate their strategies while maintaining flexibility and control over their trading logic.

Reversal Trading Bot Strategy[BullByte]Overview :
The indicator Reversal Trading Bot Strategy is crafted to capture potential market reversal points by combining momentum, volatility, and trend alignment filters. It uses a blend of technical indicators to identify both bullish and bearish reversal setups, ensuring that multiple market conditions are met before entering a trade.
Core Components :
Technical Indicators Used :
RSI (Relative Strength Index) :
Purpose : Detects divergence conditions by comparing recent lows/highs in price with the RSI.
Parameter : Length of 8.
Bollinger Bands (BB) :
Purpose : Measures volatility and identifies price levels that are statistically extreme.
Parameter : Length of 20 and a 2-standard deviation multiplier.
ADX (Average Directional Index) & DMI (Directional Movement Index) :
Purpose : Quantifies the strength of the trend. The ADX threshold is set at 20, and additional filters check for the alignment of the directional indicators (DI+ and DI–).
ATR (Average True Range) :
Purpose : Provides a volatility measure used to set stop levels and determine risk through trailing stops.
Volume SMA (Simple Moving Average of Volume ):
Purpose : Helps confirm strength by comparing the current volume against a 20-period average, with an optional filter to ensure volume is at least twice the SMA.
User-Defined Toggle Filters :
Volume Filter : Confirms that the volume is above average (or twice the SMA) before taking trades.
ADX Trend Alignment Filter : Checks that the ADX’s directional indicators support the trade direction.
BB Close Confirmation : Optionally refines the entry by requiring price to be beyond the upper or lower Bollinger Band rather than just above or below.
RSI Divergence Exit : Allows the script to close positions if RSI divergence is detected.
BB Mean Reversion Exit : Closes positions if the price reverts to the Bollinger Bands’ middle line.
Risk/Reward Filter : Ensures that the potential reward is at least twice the risk by comparing the distance to the Bollinger Band with the ATR.
Candle Movement Filter : Optional filter to require a minimum percentage move in the candle to confirm momentum.
ADX Trend Exit : Closes positions if the ADX falls below the threshold and the directional indicators reverse.
Entry Conditions :
Bullish Entry :
RSI Divergence : Checks if the current close is lower than a previous low while the RSI is above the previous low, suggesting bullish divergence.
Bollinger Confirmation : Requires that the price is above the lower (or upper if confirmation is toggled) Bollinger Band.
Volume & Trend Filters : Combines volume condition, ADX strength, and an optional candle momentum condition.
Risk/Reward Check : Validates that the trade meets a favorable risk-to-reward ratio.
Bearish Entry :
Uses a mirror logic of the bullish entry by checking for bearish divergence, ensuring the price is below the appropriate Bollinger level, and confirming volume, trend strength, candle pattern, and risk/reward criteria.
Trade Execution and Exit Strateg y:
Trade Execution :
Upon meeting the entry conditions, the strategy initiates a long or short position.
Stop Loss & Trailing Stops :
A stop-loss is dynamically set using the ATR value, and trailing stops are implemented as a percentage of the close price.
Exit Conditions :
Additional exit filters can trigger early closures based on RSI divergence, mean reversion (via the middle Bollinger Band), or a weakening trend as signaled by ADX falling below its threshold.
This multi-layered exit strategy is designed to lock in gains or minimize losses if the market begins to reverse unexpectedly.
How the Strategy Works in Different Market Conditions :
Trending Markets :
The ADX filter ensures that trades are only taken when the trend is strong. When the market is trending, the directional movement indicators help confirm the momentum, making the reversal signal more reliable.
Ranging Markets :
In choppy markets, the Bollinger Bands expand and contract, while the RSI divergence can highlight potential turning points. The optional filters can be adjusted to avoid false signals in low-volume or low-volatility conditions.
Volatility Management :
With ATR-based stop-losses and a risk/reward filter, the strategy adapts to current market volatility, ensuring that risk is managed consistently.
Recommendation on using this Strategy with a Trading Bot :
This strategy is well-suited for high-frequency trading (HFT) due to its ability to quickly identify reversal setups and execute trades dynamically with automated stop-loss and trailing exits. By integrating this script with a TradingView webhook-based bot or an API-driven execution system, traders can automate trade entries and exits in real-time, reducing manual execution delays and capitalizing on fast market movements.
Disclaimer :
This script is provided for educational and informational purposes only. It is not intended as investment advice. Trading involves significant risk, and you should always conduct your own research and analysis before making any trading decisions. The author is not responsible for any losses incurred while using this script.

Easy Trade Pro [Buy and Sell Strategy + Backtesting System]Hello Traders,
Easy Trade Pro is a comprehensive tool that combines multiple technical indicators into a single customizable one. This tool is the culmination of an extensive trading career, it is designed to help traders navigate the markets in any timeframe and financial asset, like Equities, Futures, Crypto, Forex and Commodities.
Before we deep dive into the comprehensive guide on what Easy Trade Pro is, let's kick off by showcasing the strategy used in this example. Please note, we have adopted an extremely conservative approach strictly following the Tradingview House Rules, which you can review here: www.tradingview.com
The backtest strategy parameters:
Currency pair: EUR USD
Timeframe: 15-min chart
Market: Spot, no leverage
Broker: FXCM
Trading range: 2022-09-01 07:30 — 2023-06-26 20:00
Backtesting range: 2022-08-31 23:00 — 2023-06-26 20:00
Initial Capital: $10,000
Buy Order Size: 20% of the capital, $2,000
Stop Loss: 0.50%
Sell orders: Four different take profits where we unload the position by 25% each time
Broker Fees: Commission set at 0.08$
Slippage: 10 ticks
Understanding FXCM Commissions and Setting Realistic Slippage for EUR/USD Spot Trading:
◉I would like to provide some clarity on the commission structure and slippage setting used in the study for trading the EUR/USD pair on the FXCM spot market. Based on the information available, FXCM charges a commission of $4.00 per standard lot (100,000) on both sides of the trade (meaning at open and close) for the EUR/USD pair. Since the study involve an order size of $2,000 USD, which is equivalent to 0.02 lots, the commission fee for one side of the trade (either buying or selling) would be calculated as $4.00 multiplied by 0.02, which is $0.08. This means that for each individual trade, whether it be a buy or sell, the commission fee would be $0.08.
◉As for slippage, it is crucial to account for the inherent uncertainty in the execution price due to market fluctuations. In the forex market, the EUR/USD pair is quoted with a precision of five decimal places, with the smallest price change being a "pipette" (0.00001). Given that slippage can vary based on market conditions, it is considered fair practice to use a slippage of around 10 ticks under normal market conditions for the EUR/USD pair. This allows for a more realistic representation of the execution price, especially in a liquid and fast-moving market such as forex.
More detailed information about FXCM fees structure in the link below:
docs.fxcorporate.com
Enter a Trade conditions:
For our buy order, we utilize a custom buy signal called 'Bullish Reversal'. A detailed explanation of this and other buy orders can be found later in the guide, specifically in section 1).
To enhance realism in our trading strategy, we have implemented a confirmation mechanism. When utilizing the strategy tester, you have the option to input a value to determine the number of confirmation candles to consider.
For example, if you set the input to 1, the system will check if the next candle following the signal meets the criteria for confirmation. If set to 2, the system will evaluate the second candle, and so on for higher values. The confirmation is determined by comparing the closing or opening price of the selected buy signal candle with the corresponding closing price of the confirmation candle.
In this case we choose as buy signal: 'Bullish Reversal' + 2 candle of confirmation
Exit a trade conditions:
On the sell side, we exit a trade in four different types of sell orders where we take profits. Inside '', you will encounter unique labels attributed to our custom sell signals. A detailed explanation of these sell orders can be found later in the guide, specifically in section 1). We used custom order called:
1TP 'Good Sell'
2TP 'Good Sell'
3TP 'Good Sell'
4TP 'Bearish Reversal' + 4 confirmation candles
Our confirmation logic, for sell signals, is applied only to 'Bearish Reversal' signal. The confirmation is determined by comparing the closing or opening price of the selected 'Bearish Reversal' candle with the corresponding closing price of the confirmation candle. In this case, we wait for the fourth candle from the 'Bearish Reversal' signal to confirm the sell trade.
Protect your capital:
This super-conservative study involves a clear low risk, with the use of $2,000, 20% of our capital. If the stop loss of 0.5% were triggered, we lose 10$, equating to 0.10% of $10,000 - thus affecting only 0.10% of our capital.
Super Conservative Approach & Results:
With 353 closed trades, we achieved a net profit of 2.03%, or $203.34$ relative to our initial $10,000 capital, and a win rate of 73.37%.
Less Conservative Approach & Results:
We could also consider increasing our risk to 0.5% of our capital per trade. We would maintain our stop loss at 0.50%, but we would need to use all our capital to enter the market. If the stop loss of 0.5% will be triggered, we would lose 50$, equating to 0.5% of $10,000.
In this scenario, our net profit would have increased to 10.15%, equivalent to $1015.
Please be aware:
While fully automated strategies can bring considerable advantages, they are not without their cons. For one, relying solely on an automated system may not take into account the potential confluence of other strategies or indicators, such as the significance of support and resistance zones. These elements often require a more nuanced, human understanding of the markets and cannot always be perfectly replicated by an algorithm.
Additionally, it's essential to remember that a significant percentage of traders are not consistently profitable. As such, prudent risk management, a conservative approach, and acceptance of a reasonable profit are crucial aspects of successful trading. While the allure of high returns can be tempting, the sustainability of your trading strategy should always take precedence. Achieving steady, reliable profits over time often outweighs the appeal of a risky, high-return strategy that could potentially lead to substantial losses.
So, while automation can be a powerful tool in your trading arsenal, it's also important to consider other strategies and factors. Always ensure you're managing your risk effectively and approaching trading with a realistic and informed perspective.
------------------------------------------------------------------------ Why Easy Trade Pro is Original? ----------------------------------------------------------------------------------
We developed Easy Trade Pro as a unique and comprehensive solution, and we decided to protect our code to preserve its originality. We invested significant time and effort into making it a realistic trading strategy simulator. The standout features that set Easy Trade Pro apart include:
☀ Versatile Stop Loss Mechanisms: Stop loss execution can be complex and often requires careful coding to work as intended. In most freely available open-source codes, stop losses are implemented using the Average True Range (ATR). ATR can be beneficial but has limitations:
☁ Lagging Indicator - Like most technical indicators, the ATR is a lagging indicator. This means it is based on past data, and so it may not accurately reflect future market volatility. If market conditions change rapidly, the ATR may not adjust quickly enough, potentially leading to suboptimal stop loss levels.
☁ No Directional Information - The ATR measures volatility, but it does not provide any indication of the direction of the trend. Therefore, it should not be used as a standalone tool for making trading decisions, but should be used in conjunction with other technical analysis tools that can provide directional cues.
☁ Inefficiency in Trending Markets - In strongly trending markets, ATR-based stops can sometimes be too far from the current price level. This could lead to larger losses if the price moves against your trade before hitting the stop loss. On the flip side, in less volatile, sideways markets, an ATR-based stop might be set too close to the entry point, leading to premature stop outs.
☁ Overoptimization Risk - If you're backtesting a trading strategy, there's a risk of overoptimizing your stop loss settings by fine-tuning them to past data. The best ATR multiplier that worked in the past might not necessarily work in the future, leading to potential performance issues.
☀ We countered these by implementing four different types of 'protect the trade' mechanisms:
✔ Fixed Percentage Stop Loss
✔ Trailing Stop Loss
✔ Stop Loss Moved to Entry Upon Reaching Certain Gain
✔ Stop Loss Moved to Entry Upon Reaching First Take Profit Order ("Custom Order").
☀ Dual Exit Strategy: We incorporated two distinct methods of exiting a trade. The first uses our custom signals, while the second triggers exit at a certain percentage of gain.
☀ Multiple Take Profit Orders: You have the flexibility to establish up to four different sell orders. This feature enables you to fractionate your exit strategy according to your needs. You can choose to trigger these fractions based on our custom signals or determine your own exit points by setting targeted gains at a fixed percentage.
☀ Confirmation Candle System: This feature enhances trade precision by requiring confirmation candles after a buy or sell signal. This confirmation, dependent on the next candle's closing price, helps reduce false signals and improves entry and exit points. While our confirmation system is applicable to all custom buy signals, it's solely dedicated for the bearish reversal when it comes to sell signals.
☀ Universal Compatibility: Easy Trade Pro's Strategy Tester works perfectly with any asset class. The code can handle different contract types, including the SPX contracts and fractional assets like Bitcoin. It's optimized to ensure proper execution of trades without rounding issues.
☀ Bullish and Bearish Reversal candles: Our method of detecting these pivotal candles combines conditions from buy and sell signals with pertinent divergences in Price, RSI, and Volume (OBV). The distinguishing factor, however, lies in recognizing significant shifts in market structure and liquidity grabs. To further enhance the credibility of our indicator, we've incorporated Bollinger Bands, serving as an additional layer in spotting potential trend reversals, particularly when aligned with long-wick candlesticks, engulfing patterns, and morning or evening star formations.
☀ Non-Repainting Indicator: Our indicator signals are designed not to repaint. Once a signal appears, it stays fixed, offering a reliable tool for your trading decisions.
================================================== EXTENSIVE TECHNICAL DESCRIPTION ====================================================
Easy Trade Pro is versatile, allowing you to analyze market trends across any financial asset. With its rigorous testing, our tool can be used confidently on any timeframe, from 1D to 1min, whether you prefer longer-term or shorter-term trades.
Although we recommend trading on timeframes between 1D and 1min, higher timeframes like 1W chart, can also provide broader insights.
Our study combines a variety of popular technical indicators, such as RSI, Stochastic RSI, MACD, DMI, Bollinger Bands as well as relevant EMAs. On the volume side OBV and MFI. Using a data-driven approach, “Easy Trade Pro” analyzes historical market trends to identify optimal ways to combine these indicators with significant divergences between price and oscillators. On top of that the code considers relevant changes in market structure and liquidity grabs, to generate reliable and accurate signals for potential buy and sell opportunities.
* ☎ --> Please not that MACD, BBs, and EMAs account for a minimal part of our script <--- ☎, If you're looking for a simpler tool, consider checking out our open-source indicator, 'RSI, SRSI, MACD, and DMI cross - Open source code'. You can find it here:
With our customizable system, traders will be able to identify:
1) Three types of buy signals🐂,💰,💎 and sell signals 🐻,🔨,💀
2) Bullish and bearish reversal candles with support and resistance lines
3) Bull and bear momentum signals
4) A function that utilizes Color bars to identify the strength of the trend
5) Three customizable moving averages
6) Alerts direct to your email or phone
7) Advanced and customizable settings menu
8) Our software also includes a backtesting system that that allows users to test their trading strategies on historical data, to check how they would have performed in real-world market conditions. This can help refine a trading strategy and make more informed decisions.
------------------------------------------------------------------------------ 1) BUY AND SELL SIGNALS ---------------------------------------------------------------------------------
Our buy and sell signals are generated using a custom combination of RSI, MFI, and Stochastic RSI levels, as well as relevant MACD and Stochastic RSI crosses. These indicators are carefully analyzed to identify potential trading opportunities and determine optimal entry and exit points for trades.
RSI (Relative strength index) measures the strength of a security's price action, while the SRSI (Stochastic Relative Strength Index) is a momentum oscillator that measures the current price relative to its high and low range over a set period. The Money Flow Index (MFI) is another momentum indicator that uses both price and volume data to measure buying and selling pressure. MACD (Moving Average Convergence Divergence) is a popular technical indicator used in financial markets to analyze price trends and momentum.
▶ With our system, you'll be able to identify three different levels of buy signals:
◉ The first level of buy signal is represented by a 🐂 emoji and is a "Good Buy". This signal indicates a possible buying opportunity. It indicates that could be a good opportunity to enter in a long trade. It's important to note that, the "Good Buy" signal can sometimes be supplemented with a green "Bull" text and a flag plotshape positioned beneath the signal. In these scenarios, we categorize this as a "Good Buy Bull" signal.
◉ The second level of buy signal is represented by a 💰 emoji and is a "Great Buy". This signal indicates a stronger buying opportunity than the "Good Buy" signal.
◉ The third and strongest buy signal is represented by a 💎 emoji and is an "Incredible Buy". This signal indicates a stronger buying opportunity than the "Good Buy" and "Great Buy" signals
▶ With our system, you'll be able to identify three different levels of sell signals:
◉ On the sell side, the first level is represented by a 🐻 emoji and is a "Good Sell". This signal indicates a possible selling opportunity. It indicates that could be a good opportunity to exit a trade or open a short position. It's important to note that, the "Good Sell" signal can occasionally be accompanied by a red "Bear" text and a flag plotshape positioned beneath the signal. In such instances, we refer to this as a "Good Sell Bear" signal.
◉ The second sell signal is represented by a 🔨 emoji and is a "Great Sell". This signal indicates a stronger selling opportunity than the "Good Sell" signal.
◉ The third and strongest sell signal is represented by a 💀 emoji and is an "Incredible Sell". This signal indicates a stronger selling opportunity than the "Good Sell" and "Great Sell" signals.
------------------------------------------2) "BULLISH AND BEARISH REVERSAL CANDLES PLUS SUPPORT AND RESISTANCE LINES" ------------------------------------------------
Bullish and bearish reversal candles are specific candles that have more probability to reverse the trend.
Our trading indicator is designed to identify bullish and bearish reversal candles. Our method of detecting these pivotal candles combines conditions from buy and sell signals with pertinent divergences in Price, RSI, and Volume (OBV). The distinguishing factor, however, lies in recognizing significant shifts in market structure and liquidity grabs. To further enhance the credibility of our indicator, we've incorporated Bollinger Bands, serving as an additional layer in spotting potential trend reversals, particularly when aligned with long-wick candlesticks, engulfing patterns, and morning or evening star formations.
These candles are represented by blue and orange colors respectively by default. Additionally, the indicator also uses lines that are drawn at either the opening or closing of candles to help identify pivot points of support or resistance. These candles, lines color or shape are customizable in the settings menu.
How can I benefit the most from bullish reversal candles? To make the most of bullish reversal candles, a powerful strategy is:
E.g, 1D chart - Wait for the next 1 or 2 candles to close above the support line linked to the bullish reversal candle. For lower timeframes, it is recommended to wait for 2 or 3 candles before making a trading decision. A good tip is also to look for other signals (confluence), like a buy signal. Traders should decide based on their risk tolerance.
Here below we can see an example of a bullish reversal candle in the BTC/USDT, 1D, chart. The system identify a bullish reversal candle (blue color), the next 2 candles are green and closed above the support blue line, in addition we have other bullish signals (confluence).
How can I benefit the most from bullish reversal lines? Bullish reversal lines can help traders to identify key level of support and maintain control of their position until a clear break below occurs.
In the example below we se how the price retrace to the support line:
After touching the price bounce up.
How can I benefit the most from bearish reversal candles? To make the most of bearish reversal candles, a powerful strategy is:
E.g, 1D chart - Wait for the next 1 or 2 candles to close below the resistance line linked to the bearish reversal candle. For lower timeframes, it is recommended to wait for 2 or 3 candles before making a trading decision. Traders should decide based on their risk tolerance.
Here below we can see an example of a bearish reversal candle in the ETH/USDT, 1D, chart. The system identify a bearish reversal candle (orange color), the next candle is red and closes below the resistance orange line. A good tip is also to look for other signals (confluence), like a sell signal.
How can I benefit the most from bearish reversal lines? Bearish reversal lines can help traders to identify key level of resistance and maintain control of their position until a clear break above occurs.
In the example below we se how the price bounce back to the resistance line and get rejected.
------------------------------------------------------------------------- 3) BULL AND BEAR MOMENTUM SIGNALS -----------------------------------------------------------------------
We analyzed factors such as buy or sell signals, long or short confirmation signals, DMI crossup or crossdown and breaks of market structure (BOS) or change of character (CHoCh) to determine the strength and direction of the trend. These study give us bull trend or bear trend signals that can help traders identify potential trading opportunities and make informed decisions.
These conditions are represented by a green word "BULL" and a flag shape below (bull momentum) and by a red word "BEAR" and a flag shape above (bear momentum) respectively by default. These plots shapes are customizable in the settings menu.
How can I benefit the most from bull momentum signals? To make the most of bull momentum signals, a powerful strategy is:
E.g, 1D chart - Look for confluence. If bull signal comes with a "Good Buy 🐂" in the same candle the signal is more strong. Another good combo is to look for a bullish reversal candle prior or after this signal, usually within a range of 1/2 candles. For lower timeframes, it is recommended to wait 2/3 candles before making a trading decision.
In the picture below we can see an example of a bull momentum signal in the US500, 1D, chart.
How can I benefit the most from bear momentum signals? To make the most of bear momentum signals, a powerful strategy is:
E.g, 1D chart - Look for confluence. If bear signal comes with a "Good Sell 🐻" in the same candle the signal is more strong. Another good combo is to look for a bearish reversal candle prior or after this signal, usually within a range of 1/2 candles. For lower timeframes, it is recommended to wait 2/3 candles before making a trading decision.
In the picture below we can see an example of a bear momentum signal in combo with a sell signal, NETFLIX, 1D, chart.
-------------------------------------------------------------- 4) "COLOR BARS THAT INDICATE THE STRENGTH OF THE TREND -----------------------------------------------------
This code is responsible for changing the color of the bars on a chart based on certain conditions. The gradient colors are defined for green and red, and the algorithm checks if the current bar is within a certain range of either a bearish reversal or bullish reversal candle and whether the price is above or below certain exponential moving averages or if important break of market structure occurs.
Ultimately, this feature helps traders visually identify potential trends and market shifts and avoid getting distracted by price fluctuations. Please note that every gradient of color can be customize by the user. We set 3 different bullish colors and 3 different bearish colors.
Below the picture of the settings menu related to the bar color.
----------------------------------------------------------------------5)THREE CUSTOMIZABLE MOVING AVERAGES ----------------------------------------------------------------------
You can choose up to three moving averages, any length and any type like SMA, EMA, WMA, HMA, RMA, SWMA and VWMA. Furthermore, you have the freedom to adjust the color and width of the lines to your preference.
Below the picture of the settings menu related to the moving averages.
----------------------------------------------------------------------6) ALERTS DIRECT TO YOUR EMAIL OR PHONE --------------------------------------------------------------------
Our alert feature sends real-time notifications directly to your email or phone when a signal is generated, allowing you to take immediate action and stay ahead of the market.
With our system, you first establish your own rules for trading in the strategy tester - this includes your criteria for entering and exiting trades.
Once you've defined these conditions, our system will start sending you alerts. These alerts will be triggered whenever your specified conditions are met. So, if the market matches your 'enter trade' conditions, you'll receive an alert prompting. Similarly, when your 'exit trade' conditions are met, you'll receive another alert.
Remember, these alerts are purely based on the conditions you set.
Once the condition is met, you will receive alerts directly to your email or phone when enter and exit a trade based on your custom conditions. To make sure you receive these notifications click on notifications tab.
---------------------------------------------------------------7) ADVANCED AND CUSTOMIZABLE SETTINGS MENU----------------------------------------------------------------------
We designed Easy Trade indicators with traders in mind, so it's user-friendly, easy to navigate and users can customize inputs, style, and colors of every feature in the indicator's settings menu.
-----------------------------------------------------------------------8) EASY TRADE PRO - BACKTESTING SYSTEM----------------------------------------------------------------------
Easy Trade Pro features a highly effective and realistic backtesting system, designed to mirror as closely as possible the real-world scenarios of entering and exiting trades.
Step 1:
Open the settings menu of the Indicator.
Once opened the settings menu click on properties.
Decide on the capital you wish to invest. Choose whether to use contracts or USD and determine the size of your orders. For the sake of realism, we recommend not exceeding 25% of your capital per order. However, if you decide to utilize your entire capital, make sure to adjust your stop loss accordingly. For instance, if you have a capital of 10K and use 10K with a stop loss at 2%, your potential loss would be $200. Conversely, if you use only 2K of your 10K capital with a stop loss at 10%, you would still lose the same 2% of your capital. To make your simulation even more authentic, consider incorporating broker fees or commissions into your calculations. For example, spot market fees are typically around 0.10%. If you're backtesting markets with low liquidity, consider factoring in slippage as well.
Step 2:
Navigate to the 'Inputs' section and scroll down until you come across 'Backtesting System - Strategy Test'. Once you locate this, click on the box and activate the 'USE STRATEGY SYSTEM' option by checking the tick box.
Also You will then need to set a 'Start Date' and 'End Date', establishing a specific time period during which you wish to test your strategy.
Otherwise you can consider to use the deep backtesting feature.
Step 3:
It's now time to establish the conditions for entering a trade. You can choose from five different types of custom buy signals: Good Buy, Good Buy Bull, Great Buy, Incredible Buy, and Bullish Reversal. Note that 'Great Buy' and 'Incredible Buy' are rare signals, so we advise against using them frequently in mechanical strategy tests; instead, consider them more for manual live tests. For more consistent results, we recommend using the other buy signals.
After determining your preferred buy signal, you can choose how many confirmation candles you wish to wait for before entering a trade. A 'confirmation' means that if the next candle closes above the opening or closing price of the chosen buy signal, it's considered a confirmation. This could be the opening or closing price, depending on whether the candle is green (close > open) or red.
You can set the number of confirmation candles in different time frames: below 2h, between 2h and 10h, and above 10h.
Step 4:
It's now time to safeguard your trade by managing risk. You can choose to implement a stop loss, expressed in percentage terms, or opt for a trailing stop. A trailing stop is a type of stop loss order that moves with the market price. It is designed to protect gains by enabling a trade to remain open and continue to profit as long as the market price is moving in a favorable direction. However, the trade closes if the market price changes direction by a specified amount (the 'trailing stop distance').
Additionally, you can minimize losses and move the stop loss to your entry point once the price reaches a certain percentage of profit. This strategy can help secure potential gains while limiting the potential for losses.
Step 5:
Now it's time to set the conditions for exiting the trade. You have the option to divide your exit into a maximum of four parts, with each part representing 25% of the position size. For each take profit point, you can choose from three different custom sell signals: Good Sell, Good Sell Bear, and Bearish Reversal.
Similarly, the concept of confirmation candles also applies here, but in this case, the candles are not closing above. A 'confirmation' for a sell signal means that if the next candle closes below the opening or closing price of the selected sell signal, it's considered a confirmation. This could be the opening or closing price, depending on whether the candle is green (open > close) or red (close < open).
So, when you're looking to sell, a confirmation would occur if the next candlestick's closing price is lower than the opening or closing price of the candlestick that triggered the sell signal. This indicates a potential bearish trend, providing the confirmation to execute the sell order.
Additionally, we've introduced a feature that allows you to move your stop loss to the entry point whenever the first take profit (1TP) is reached, which equates to hitting one custom sell signal.
Step 6:
We've also designed an alternative method for taking profits. With this approach, you can choose to exit your position once a fixed percentage gain from the entry point is reached. For instance, you might decide to exit when a 10% profit is achieved. Similarly to the previous method, this approach allows you to choose up to four exit points and determine the proportion of your position you want to close at each stage.
Conclusion:
Easy Trade Pro provides users with various options for entering and exiting trades. To effectively utilize the indicator, we strongly recommend conducting thorough backtesting and considering the results across your preferred trading pairs. It is advisable to analyze a substantial number of trades, ideally exceeding 100 trades, to obtain reliable insights into the indicator's performance. This approach will help you gain a better understanding of how Easy Trade Pro aligns with your trading strategy and objectives.
❗Keep attention❗
It is important to note that no trading indicator or strategy is foolproof, and there is always a risk of losses in trading. While this indicator may provide useful information for making conclusions, it should not be used as the sole basis for making trading decisions. Traders should always use proper risk management techniques and consider multiple factors when making trading decisions.
It is also important to be aware of the limitations of simulated performance results. Hypothetical or simulated results do not represent actual trading, and since trades have not been executed, results may be over- or under-compensated for market factors such as lack of liquidity. Simulated trading programs are also designed with the benefit of hindsight, and no representation is being made that any account will achieve profits or losses similar to those shown. Therefore, our indicators are for informative purposes only and not intended to be used as financial advice.
We encourage traders to use our indicators as part of a well-rounded trading strategy and to always be aware of the risks involved in trading. Remember that past performance is not indicative of future results and always trade responsibly.

AlgoWay GRSIM🧭 What this strategy tries to do
This strategy detects when a market move is losing strength and prepares for a potential reversal, but it waits for fresh momentum confirmation before acting.
It combines:
• RSI-based divergence (to spot exhaustion and potential turning points),
• Impulse MACD (to verify that the new direction actually has force behind it).
________________________________________
⚙️ When it takes trades
Long (Buy):
• A bullish RSI divergence appears (a clue that selling pressure is fading);
• Within a short time window, the Impulse MACD turns strongly positive;
• Optionally, the impulse line itself must be rising (if the Impulse Direction Filter is
enabled).
Short (Sell):
• A bearish RSI divergence appears (buying pressure fading);
• Within a short time window, the Impulse MACD turns strongly negative;
• Optionally, the impulse line must be falling (if the Impulse Direction Filter is enabled).
If momentum confirmation happens too late, the divergence “expires” and the signal is ignored.
________________________________________
🧩 How entries work
1. Reversal clue:
The strategy detects disagreement between price and RSI (price makes a new high/low, RSI doesn’t).
That suggests a shift in underlying strength.
2. Momentum confirmation:
Before entering, the Impulse MACD must agree — showing real push in the same direction.
3. Impulse direction filter (optional):
When enabled, the impulse itself must accelerate (rise for longs, fall for shorts), avoiding fake signals where price diverges but momentum is still fading.
4. No stacking:
It opens only one position at a time.
________________________________________
🚪 How exits work
Two main exit styles:
Conservative (default):
Longs close when impulse crosses below its signal line.
Shorts close when impulse crosses above its signal line.
✅ Keeps trades as long as momentum agrees.
Color-change (fast):
Longs close immediately when impulse flips bearish.
Shorts close immediately when impulse flips bullish.
⚡ Faster and more defensive.
Plus:
Stop Loss (%) and Take Profit (%) act as fixed-distance protective exits (set to 0 to disable either one).
________________________________________
📊 What you’ll see on the chart
A thick Impulse MACD line and thin signal line (oscillator view).
Diamonds — detected bullish/bearish divergence points.
Circles — where impulse crosses its signal (momentum change).
A performance panel (top-right) showing Net Profit, Trades, Win Rate, Profit Factor, Pessimistic PF, and Max Drawdown.
________________________________________
🔧 What you can tune
Signal Lifetime (bars): how long a divergence remains valid.
Impulse Direction Filter: ensure the impulse itself is moving in the trade’s direction.
Stop Loss / Take Profit (%): risk and target in percent.
Exit Style: conservative cross or faster color-change.
RSI / MA / Signal Lengths: adjust responsiveness (defaults are balanced).
________________________________________
💪 Strengths
Confirms reversals using momentum direction, not just divergence.
Avoids “early” signals where momentum is still fading.
Works symmetrically for longs and shorts.
Built-in stop/target protection.
Clear, visual confirmation of all logic components.
________________________________________
⚠️ Things to keep in mind
In sideways markets, the impulse can flip often — prefer conservative exits.
Too small SL/TP → constant stop-outs.
Too wide SL/TP → deep drawdowns.
Always test with different timeframes and markets.
________________________________________
💡 Practical tips
Start with default settings.
Enable “Use Impulse Direction Filter” in trending markets, disable it in very choppy ones.
Focus on Profit Factor, Win Rate, and Max Drawdown after several dozen trades.
Keep SL/TP roughly aligned with typical swing size.
“AlgoWay GRSIM” is a reversal-with-confirmation strategy: it spots likely turns, demands real momentum alignment (optionally verified by impulse direction), and manages exits with clear momentum cues plus built-in protective limits.

Sigma Trinity ModelAbstract
Sigma Trinity Model is an educational framework that studies how three layers of market behavior interact within the same trend: (1) structural momentum (Rasta), (2) internal strength (RSI), and (3) continuation/compounding structure (Pyramid). The model deliberately combines bar-close momentum logic with intrabar, wick-aware strength checks to help users see how reversals form, confirm, and extend. It is not a signal service or automation tool; it is a transparent learning instrument for chart study and backtesting.
Why this is not “just a mashup”
Many scripts merge indicators without explaining the purpose. Sigma Trinity is a coordinated, three-engine study designed for a specific learning goal:
Rasta (structure): defines when momentum actually flips using a dual-line EMA vs smoothed EMA. It gives the entry/exit framework on bar close for clean historical study.
RSI (energy): measures internal strength with wick-aware triggers. It uses RSI of LOW (for bottom touches/reclaims) and RSI of HIGH (for top touches/exhaustion) so users can see intrabar strength/weakness that the close can hide.
Pyramid (progression): demonstrates how continuation behaves once momentum and strength align. It shows the logic of adds (compounding) as a didactic layer, also on bar close to keep historical alignment consistent.
These three roles are complementary, not redundant: structure → strength → progression.
Architecture Overview
Execution model
Rasta & Pyramid: bar close only by default (historically stable, easy to audit).
RSI: per tick (realtime) with bar-close backup by default, using RSI of LOW for entries and RSI of HIGH for exits. This makes the module sensitive to intra-bar wicks while still giving a close-based safety net for backtests.
Stops (optional in strategy builds): wick-accurate: trail arms/ratchets on HIGH; stop hit checks with LOW (or Close if selected) with a small undershoot buffer to avoid micro-noise hits.
Visual model
Dual lines (EMA vs smoothed EMA) for Rasta + color fog to see direction and compression/expansion.
Rungs (small vertical lines) drawn between the two Rasta lines to visualize wave spacing and rhythm.
Clean labels for Entry/Exit/Pyramid Add/RSI events. Everything is state-locked to avoid spamming.
Module 1 — Rasta (Structural Momentum Layer)
Goal: Identify structural momentum reversals and maintain a consistent, replayable backbone for study.
Method:
Compute an EMA of a chosen price source (default Close), and a smoothed version (SMA/EMA/RMA/WMA/None selectable).
Flip points occur when the EMA line crosses the smoothed line.
Optional EMA 8/21 trend filter can gate entries (long-bias when EMA8 > EMA21). A small “adaptive on flip” option lets an entry fire when the filter itself flips to ON and the EMA is already above the smoothed line—useful for trend resumption.
Why bar close only?
Bar-close Rasta gives a stable, auditable timeline for the structure of the trend. It teaches users to separate “structure” (close-resolved) from “energy” (intrabar, via RSI).
Visuals:
Fog between the lines (green/red) to show regime.
Rungs between lines to show spread (compression vs expansion).
Optional plotting of EMA8/EMA21 so users can see the gating effect.
Module 2 — RSI (Internal Strength / Energy Layer)
Goal: Reveal the intrabar strength/weakness that often precedes or confirms structural flips.
Method:
Standard RSI with adjustable length and signal smoothing for the panel view.
Logic uses wick-aware sources:
Entry trigger: RSI of LOW (same RSI length) touching or below a lower band (default 15). Think of it as intraband reactivation from the bottom, using the candle’s deepest excursion.
Exit trigger: RSI of HIGH touching or above an upper band (default 85). Think of it as exhaustion at the top, using the candle’s highest excursion.
Realtime + Close Backup: fires intrabar on tick, but if the realtime event was missed, the close backup will note it at bar end.
Cooldown control: optional bars-between-signals to avoid rapid re-triggers on choppy sequences.
Why wick-aware RSI?
A close-only RSI can miss the true micro-extremes that cause reversals. Using LOW/HIGH for triggers captures the behavior that traders actually react to during the bar, while the bar-close backup preserves historical reproducibility.
Module 3 — Pyramid (Continuation / Compounding Layer)
Goal: Teach how continuation behaves once a trend is underway, and how adds can be structured.
Method:
Same dual-line logic as Rasta (EMA vs smoothed EMA), but only fires when already in a position (or after prior entry conditions).
Supports the same EMA 8/21 filter and optional adaptive-on-flip behavior.
Bar close only to maintain historical cohesion.
What it teaches:
Adds tend to cluster when momentum persists.
Students can experiment with add spacing and compare “one-shot entries” vs “laddered adds” during strong regimes.
How the Pieces Work Together
Rasta establishes the structural frame (when the wave flip is real enough to record at close).
RSI validates or challenges that structure by tracking intrabar energy at the extremes (low/high touches).
Pyramid shows what sustained continuation looks like once (1) and (2) align.
This produces a layered view: Structure → Energy → Progression. Users can see when all three line up (strongest phases) and when they diverge (riskier phases or transitions).
How to Use It (Step-by-Step)
Quick Start
Apply script to any symbol/timeframe.
In Strategy/Indicator Properties:
Enable On every tick (recommended).
If available, enable Using bar magnifier and choose a lower resolution (e.g., 1m) to simulate intrabar fills more realistically.
Keep On bar close unchecked if you want to observe realtime logic in live charts (strategies still place orders on close by platform design).
Default behavior: Rasta & Pyramid = bar close; RSI = per tick with close backup.
Reading the Chart
Watch for Rasta Entry/Exit labels: they define clean structural turns on close.
Watch RSI Entry (LOW touch at/below lower band) and RSI Exit (HIGH touch at/above upper band) to gauge internal energy extremes.
Pyramid Add labels reveal continuation phases once a move is already in progress.
Tuning
Rasta smoothing: choose SMA/EMA/RMA/WMA or None. Higher smoothing → later but cleaner flips; lower smoothing → earlier but choppier.
RSI bands: a common educational setting is 15/85 for strong extremes; 20/80 is a bit looser.
Cooldown: increase if you see too many RSI re-fires in chop.
EMA 8/21 filter: toggle ON to study “trend-gated” entries, OFF to study raw momentum flips.
Backtesting Notes (for Strategy Builds)
Stops (optional): trail is armed when price advances by a trigger (default D–F₀), ratchets only upward from HIGH, and hits from LOW (or Close if chosen) with a tiny undershoot buffer to avoid micro-wicks.
Order sequencing per bar (mirrors the script’s code comments):
Trail ratchet via HIGH
Intrabar stop hit via LOW/CLOSE → immediate close
If still in position at bar close: process exits (Rasta/RSI)
If still in position at bar close: process Pyramid Add
If flat at bar close: process entries (Rasta/RSI)
Platform reality: strategies place orders at bar close in historical testing; the intrabar logic improves realism for stops and event marking but final order timestamps are still close-resolved.
Inputs Reference (common)
Modules: enable/disable RSI and Pyramid learning layers.
Rasta: EMA length, smoothing type/length, EMA8/21 filter & adaptive flip, fog opacity, rungs on/off & limit.
RSI: RSI length, signal MA length (panel), Entry band (LOW), Exit band (HIGH), cooldown bars, labels.
Pyramid: EMA length, smoothing, EMA8/21 filter & adaptive adds.
Execution: toggle Bar Close Only for Rasta/Pyramid; toggle Realtime + Close Backup for RSI.
Stops (strategy): Fixed Stop % (first), Fixed Stop % (add), Trail Distance %, Trigger rule (auto D–F₀ or custom), undershoot buffer %, and hit source (LOW/CLOSE).
What to Study With It
Convergence: how often RSI-LOW entry touches precede the next Rasta flip.
Divergence: cases where RSI screams exhaustion (HIGH >= upper band) but Rasta hasn’t flipped yet—often transition zones.
Continuation: how Pyramid adds cluster in strong moves; how spacing changes with smoothing/filter choices.
Regime changes: use EMA8/21 filter toggles to see what happens at macro turns vs chop.
Limitations & Scope
This is a learning tool, not a trade copier. It does not provide financial advice or automated execution.
Intrabar results depend on data granularity; bar magnifier (when available) can help simulate lower-resolution ticks, but true tick-by-tick fills are a platform-level feature and not guaranteed across all symbols.
Suggested Publication Settings (Strategy)
Initial capital: 100
Order size: 100 USD (cash)
Pyramiding: 10
Commission: 0.25%
Slippage: 3 ticks
Recalculate: ✓ On every tick
Fill orders: ✓ Using bar magnifier (choose 1m or similar); leave On bar close unchecked for live viewing.
Educational License
Released under the Michael Culpepper Gratitude License (2025).
Use and modify freely for education and research with attribution. No resale. No promises of profitability. Purpose is understanding, not signals.

BTC 1m Chop Top/Bottom Reversal (Stable Entries)Strategy Description: BTC 5m Chop Top/Bottom Reversal (Stable Entries)
This strategy is engineered to capture precise reversal points during Bitcoin’s choppy or sideways price action on the 5-minute timeframe. It identifies short-term tops and bottoms using a confluence of volatility bands, momentum indicators, and price structure, optimized for high-probability scalping and intraday reversals.
Core Logic:
Volatility Filter: Uses an EMA with ATR bands to define overextended price zones.
Momentum Divergence: Confirms reversals using RSI and MACD histogram shifts.
Price Action Filter: Requires candle confirmation in the direction of the trade.
Locked Signal Logic: Prevents repaints and disappearing trades by confirming signals only once per bar.
Trade Parameters:
Short Entry: Above upper band + overbought RSI + weakening MACD + bearish candle
Long Entry: Below lower band + oversold RSI + strengthening MACD + bullish candle
Take Profit: ±0.75%
Stop Loss: ±0.4%
This setup is tuned for traders using tight risk control and leverage, where execution precision and minimal drawdown tolerance are critical.

Longbithello Traders !
Inspired by the indicator Range Filter Buy and Sell 5min by guikroth , namely calculation and works price movement range filter .
And Inspired by the indicator by the indicator VuManChu Cipher B + Divergences by vumanchu namely calculation and working out divergences and convergences , i was inspired to create a strategy .
This is indicator - strategy - ( Longbit ) - aggregate and my modification indicators : Range Filter Buy and Sell 5min by guikroth , VuManChu Cipher B + Divergences by vumanchu , and diferent exponential moving average .
The strategy - ( Longbit ) works on the basis of the price movement range filter , first a smooth average price range is calculated for the basis of the filter and multiplied by a specified amount by indicator Range Filter Buy and Sell 5min by guikroth , and some calculations working out divergences and convergences by indicator VuManChu Cipher B + Divergences by vumanchu . And diferent exponential moving averages for zones Bull / Bear trend for trend trading , and using take and diferent stop loss : algo , user or percentage .
Thus, using my strategy, we get the best entry point to open trades after confirming divergences
example in the picture
or
And when these trend signals are much stronger
example in the picture
Actual Version recommended used for BTCUSDC / BTCUSDT 4 hours time frame and used default settings and stop loss - algo , take profit 6 %
example in the picture
But it can also be used on all time frame with these settings: MaxMin3 Data Sampling period 6 Range Multiplier 2 and Take profit 2.3 % , stop loss algo
DISCLAIMER: This informational planning script / strategy is strictly for individual use and educational purposes only. This is not financial or investment advice. Investments are always made at your own risk and are based on your personal judgement. I am not responsible for any losses you may incur.
Привет, Трейдеры ! Вдохновленный индикатором Range Filter Buy and Sell 5min by guikroth , а именно работой и вычеслением диапазона фильтра движения цены . А также вдохновленный индикатором VuManChu Cipher B + Divergences by vumanchu, а именно дивергенций и конвергенций , я был вдохновлен создать эту стратегию
Эта тратегия - (Longbit) - это совокупность индикаторов : Range Filter Buy and Sell 5min by guikroth , VuManChu Cipher B + Divergences by vumanchu, и разние виды экспоненциальных средних .
Стратегия - (Longbit) работает на основе фильтра диапазона изменения цен, сначала рассчитывается гладкий средней диапазон цен для базы фильтра и умножается на оговоренную сумму по индикатору Range Filter Buy and Sell 5min by guikroth модифицированой версии , а также некоторые расчеты вычислений дивергенций и конвергенции по показателю индикатора VuManChu Cipher B+ Divergences by vumanchu. И различные экспоненциальные среднее и их зон для определения тенденции либо трендов для торговли по тренду , и с использованием стоп лоса : алго, пользовательский или процентный .
Таким образом, используя мою стратегию, мы получим лучшую точку для открытия сделок после подтверждения дивергенций или конвергенций
А когда эти сигналы по тренду они намного сильнее на рисунке , примеры на картинках выше
Рекомендуемую для 4-часового тм BTCUSDC/BTCUSDT , и работать с помощью algo stop loss , и take в 6 % с настройками по умолчанию , но можно также на использовать на всех тм с такой вот настройкой :
Данные МакМин3
Sampling period 6
Range Multiplier 2
Примеры на картинках выше
Предупреждаю : Эта стратегия информационного планирования предназначен исключительно для индивидуального пользования и образовательных целей. Это не финансовая или инвестиционная консультация. Инвестиции всегда осуществляются на собственном риске и основываются на вашем личном суждении. Я не отвечаю за потери, которые вы можете понести.

Up Down RatioWORKS ONLY IN LIVE MARKET. NO BACK TESTING POSSIBLE.
A Tick block is defined as a set of last 'n' ticks. 'n' is user specified and default is 100.
Script calculates the ratio of upticks to downticks in every tick block. This is called UDR (up down ratio)
It also calculates the lowest price in the tick block.
The price lows (in each block) are matched with UDR and looks for convergence or divergence.
Script generates entry and exit signals based on convergence/ divergence.
Profit and loss can be user defined.
Default settings work for CRUDE OIL (Indian Rupee)
Convergence is Bullish
Divergence is Bearish.
Ticks per second for the last tick block is displayed as TPS.
TPS may be used to gauge activity level and co-relates largely with volume acceleration.
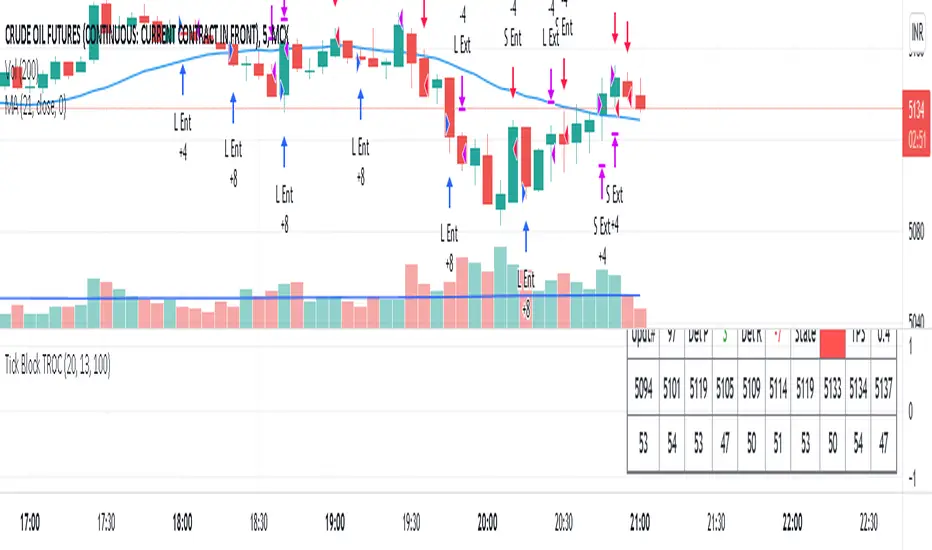
Stochastic Hash Strat [Hash Capital Research]# Stochastic Hash Strategy by Hash Capital Research
## 🎯 What Is This Strategy?
The **Stochastic Slow Strategy** is a momentum-based trading system that identifies oversold and overbought market conditions to capture mean-reversion opportunities. Think of it as a "buy low, sell high" approach with smart mathematical filters that remove emotion from your trading decisions.
Unlike fast-moving indicators that generate excessive noise, this strategy uses **smoothed stochastic oscillators** to identify only the highest-probability setups when momentum truly shifts.
---
## 💡 Why This Strategy Works
Most traders fail because they:
- **Chase prices** after big moves (buying high, selling low)
- **Overtrade** in choppy, directionless markets
- **Exit too early** or hold losses too long
This strategy solves all three problems:
1. **Entry Discipline**: Only trades when the stochastic oscillator crosses in extreme zones (oversold for longs, overbought for shorts)
2. **Cooldown Filter**: Prevents revenge trading by forcing a waiting period after each trade
3. **Fixed Risk/Reward**: Pre-defined stop-loss and take-profit levels ensure consistent risk management
**The Math Behind It**: The stochastic oscillator measures where the current price sits relative to its recent high-low range. When it's below 25, the market is oversold (time to buy). When above 70, it's overbought (time to sell). The crossover with its moving average confirms momentum is shifting.
---
## 📊 Best Markets & Timeframes
### ⭐ OPTIMAL PERFORMANCE:
**Crude Oil (WTI) - 12H Timeframe**
- **Why it works**: Oil markets have predictable volatility patterns and respect technical levels
**AAVE/USD - 4H to 12H Timeframe**
- **Why it works**: DeFi tokens exhibit strong momentum cycles with clear extremes
### ✅ Also Works Well On:
- **BTC/USD** (12H, Daily) - Lower frequency but high win rate
- **ETH/USD** (8H, 12H) - Balanced volatility and liquidity
- **Gold (XAU/USD)** (Daily) - Classic mean-reversion asset
- **EUR/USD** (4H, 8H) - Lower volatility, requires patience
### ❌ Avoid Using On:
- Timeframes below 4H (too much noise)
- Low-liquidity altcoins (wide spreads kill performance)
- Strongly trending markets without pullbacks (Bitcoin in 2021)
- News-driven instruments during major events
---
## 🎛️ Understanding The Settings
### Core Stochastic Parameters
**Stochastic Length (Default: 16)**
- Controls the lookback period for price comparison
- Lower = faster reactions, more signals (10-14 for volatile markets)
- Higher = smoother signals, fewer trades (16-21 for stable markets)
- **Pro tip**: Use 10 for crypto 4H, 16 for commodities 12H
**Overbought Level (Default: 70)**
- Threshold for short entries
- Lower values (65-70) = more trades, earlier entries
- Higher values (75-80) = fewer but higher-conviction trades
- **Sweet spot**: 70 works for most assets
**Oversold Level (Default: 25)**
- Threshold for long entries
- Higher values (25-30) = more trades, earlier entries
- Lower values (15-20) = fewer but stronger bounce setups
- **Sweet spot**: 20-25 depending on market conditions
**Smooth K & Smooth D (Default: 7 & 3)**
- Additional smoothing to filter out whipsaws
- K=7 makes the indicator slower and more reliable
- D=3 is the signal line that confirms the trend
- **Don't change these unless you know what you're doing**
---
### Risk Management
**Stop Loss % (Default: 2.2%)**
- Automatically exits losing trades
- Should be 1.5x to 2x your average market volatility
- Too tight = death by a thousand cuts
- Too wide = uncontrolled losses
- **Calibration**: Check ATR indicator and set SL slightly above it
**Take Profit % (Default: 7%)**
- Automatically exits winning trades
- Should be 2.5x to 3x your stop loss (reward-to-risk ratio)
- This default gives 7% / 2.2% = 3.18:1 R:R
- **The golden rule**: Never have R:R below 2:1
---
### Trade Filters
**Bar Cooldown Filter (Default: ON, 3 bars)**
- **What it does**: Forces you to wait X bars after closing a trade before entering a new one
- **Why it matters**: Prevents emotional revenge trading and overtrading in choppy markets
- **Settings guide**:
- 3 bars = Standard (good for most cases)
- 5-7 bars = Conservative (oil, slow-moving assets)
- 1-2 bars = Aggressive (only for experienced traders)
**Exit on Opposite Extreme (Default: ON)**
- Closes your long when stochastic hits overbought (and vice versa)
- Acts as an early profit-taking mechanism
- **Leave this ON** unless you're testing other exit strategies
**Divergence Filter (Default: OFF)**
- Looks for price/momentum divergences for additional confirmation
- **When to enable**: Trending markets where you want fewer but higher-quality trades
- **Keep OFF for**: Mean-reverting markets (oil, forex, most of the time)
---
## 🚀 Quick Start Guide
### Step 1: Set Up in TradingView
1. Open TradingView and navigate to your chart
2. Click "Pine Editor" at the bottom
3. Copy and paste the strategy code
4. Click "Add to Chart"
5. The strategy will appear in a separate pane below your price chart
### Step 2: Choose Your Market
**If you're trading Crude Oil:**
- Timeframe: 12H
- Keep all default settings
- Watch for signals during London/NY overlap (8am-11am EST)
**If you're trading AAVE or crypto:**
- Timeframe: 4H or 12H
- Consider these adjustments:
- Stochastic Length: 10-14 (faster)
- Oversold: 20 (more aggressive)
- Take Profit: 8-10% (higher targets)
### Step 3: Wait for Your First Signal
**LONG Entry** (Green circle appears):
- Stochastic crosses up below oversold level (25)
- Price likely near recent lows
- System places limit order at take profit and stop loss
**SHORT Entry** (Red circle appears):
- Stochastic crosses down above overbought level (70)
- Price likely near recent highs
- System places limit order at take profit and stop loss
**EXIT** (Orange circle):
- Position closes either at stop, target, or opposite extreme
- Cooldown period begins
### Step 4: Let It Run
The biggest mistake? **Interfering with the system.**
- Don't close trades early because you're scared
- Don't skip signals because you "have a feeling"
- Don't increase position size after a big win
- Don't revenge trade after a loss
**Follow the system or don't use it at all.**
---
### Important Risks:
1. **Drawdown Pain**: You WILL experience losing streaks of 5-7 trades. This is mathematically normal.
2. **Whipsaw Markets**: Choppy, range-bound conditions can trigger multiple small losses.
3. **Gap Risk**: Overnight gaps can cause your actual fill to be worse than the stop loss.
4. **Slippage**: Real execution prices differ from backtested prices (factor in 0.1-0.2% slippage).
---
## 🔧 Optimization Guide
### When to Adjust Settings:
**Market Volatility Increased?**
- Widen stop loss by 0.5-1%
- Increase take profit proportionally
- Consider increasing cooldown to 5-7 bars
**Getting Too Few Signals?**
- Decrease stochastic length to 10-12
- Increase oversold to 30, decrease overbought to 65
- Reduce cooldown to 2 bars
**Getting Too Many Losses?**
- Increase stochastic length to 18-21 (slower, smoother)
- Enable divergence filter
- Increase cooldown to 5+ bars
- Verify you're on the right timeframe
### A/B Testing Method:
1. **Run default settings for 50 trades** on your chosen market
2. Document: Win rate, profit factor, max drawdown, emotional tolerance
3. **Change ONE variable** (e.g., oversold from 25 to 20)
4. Run another 50 trades
5. Compare results
6. Keep the better version
**Never change multiple settings at once** or you won't know what worked.
---
## 📚 Educational Resources
### Key Concepts to Learn:
**Stochastic Oscillator**
- Developed by George Lane in the 1950s
- Measures momentum by comparing closing price to price range
- Formula: %K = (Close - Low) / (High - Low) × 100
- Similar to RSI but more sensitive to price movements
**Mean Reversion vs. Trend Following**
- This is a **mean reversion** strategy (price returns to average)
- Works best in ranging markets with defined support/resistance
- Fails in strong trending markets (2017 Bitcoin, 2020 Tech stocks)
- Complement with trend filters for better results
**Risk:Reward Ratio**
- The cornerstone of profitable trading
- Winning 40% of trades with 3:1 R:R = profitable
- Winning 60% of trades with 1:1 R:R = breakeven (after fees)
- **This strategy aims for 45% win rate with 2.5-3:1 R:R**
### Recommended Reading:
- *"Trading Systems and Methods"* by Perry Kaufman (Chapter on Oscillators)
- *"Mean Reversion Trading Systems"* by Howard Bandy
- *"The New Trading for a Living"* by Dr. Alexander Elder
---
## 🛠️ Troubleshooting
### "I'm not seeing any signals!"
**Check:**
- Is your timeframe 4H or higher?
- Is the stochastic actually reaching extreme levels (check if your asset is stuck in middle range)?
- Is cooldown still active from a previous trade?
- Are you on a low-liquidity pair?
**Solution**: Switch to a more volatile asset or lower the overbought/oversold thresholds.
---
### "The strategy keeps losing money!"
**Check:**
- What's your win rate? (Below 35% is concerning)
- What's your profit factor? (Below 0.8 means serious issues)
- Are you trading during major news events?
- Is the market in a strong trend?
**Solution**:
1. Verify you're using recommended markets/timeframes
2. Increase cooldown period to avoid choppy markets
3. Reduce position size to 5% while you diagnose
4. Consider switching to daily timeframe for less noise
---
### "My stop losses keep getting hit!"
**Check:**
- Is your stop loss tighter than the average ATR?
- Are you trading during high-volatility sessions?
- Is slippage eating into your buffer?
**Solution**:
1. Calculate the 14-period ATR
2. Set stop loss to 1.5x the ATR value
3. Avoid trading right after market open or major news
4. Factor in 0.2% slippage for crypto, 0.1% for oil
---
## 💪 Pro Tips from the Trenches
### Psychological Discipline
**The Three Deadly Sins:**
1. **Skipping signals** - "This one doesn't feel right"
2. **Early exits** - "I'll just take profit here to be safe"
3. **Revenge trading** - "I need to make back that loss NOW"
**The Solution:** Treat your strategy like a business system. Would McDonald's skip making fries because the cashier "doesn't feel like it today"? No. Systems work because of consistency.
---
### Position Management
**Scaling In/Out** (Advanced)
- Enter 50% position at signal
- Add 50% if stochastic reaches 10 (oversold) or 90 (overbought)
- Exit 50% at 1.5x take profit, let the rest run
**This is NOT for beginners.** Master the basic system first.
---
### Market Awareness
**Oil Traders:**
- OPEC meetings = volatility spikes (avoid or widen stops)
- US inventory reports (Wed 10:30am EST) = avoid trading 2 hours before/after
- Summer driving season = different patterns than winter
**Crypto Traders:**
- Monday-Tuesday = typically lower volatility (fewer signals)
- Thursday-Sunday = higher volatility (more signals)
- Avoid trading during exchange maintenance windows
---
## ⚖️ Legal Disclaimer
This trading strategy is provided for **educational purposes only**.
- Past performance does not guarantee future results
- Trading involves substantial risk of loss
- Only trade with capital you can afford to lose
- No one associated with this strategy is a licensed financial advisor
- You are solely responsible for your trading decisions
**By using this strategy, you acknowledge that you understand and accept these risks.**
---
## 🙏 Acknowledgments
Strategy development inspired by:
- George Lane's original Stochastic Oscillator work
- Modern quantitative trading research
- Community feedback from hundreds of backtests
Built with ❤️ for retail traders who want systematic, disciplined approaches to the markets.
---
**Good luck, stay disciplined, and trade the system, not your emotions.**

Dynamic Volatility Differential Model (DVDM)The Dynamic Volatility Differential Model (DVDM) is a quantitative trading strategy designed to exploit the spread between implied volatility (IV) and historical (realized) volatility (HV). This strategy identifies trading opportunities by dynamically adjusting thresholds based on the standard deviation of the volatility spread. The DVDM is versatile and applicable across various markets, including equity indices, commodities, and derivatives such as the FDAX (DAX Futures).
Key Components of the DVDM:
1. Implied Volatility (IV):
The IV is derived from options markets and reflects the market’s expectation of future price volatility. For instance, the strategy uses volatility indices such as the VIX (S&P 500), VXN (Nasdaq 100), or RVX (Russell 2000), depending on the target market. These indices serve as proxies for market sentiment and risk perception (Whaley, 2000).
2. Historical Volatility (HV):
The HV is computed from the log returns of the underlying asset’s price. It represents the actual volatility observed in the market over a defined lookback period, adjusted to annualized levels using a multiplier of \sqrt{252} for daily data (Hull, 2012).
3. Volatility Spread:
The difference between IV and HV forms the volatility spread, which is a measure of divergence between market expectations and actual market behavior.
4. Dynamic Thresholds:
Unlike static thresholds, the DVDM employs dynamic thresholds derived from the standard deviation of the volatility spread. The thresholds are scaled by a user-defined multiplier, ensuring adaptability to market conditions and volatility regimes (Christoffersen & Jacobs, 2004).
Trading Logic:
1. Long Entry:
A long position is initiated when the volatility spread exceeds the upper dynamic threshold, signaling that implied volatility is significantly higher than realized volatility. This condition suggests potential mean reversion, as markets may correct inflated risk premiums.
2. Short Entry:
A short position is initiated when the volatility spread falls below the lower dynamic threshold, indicating that implied volatility is significantly undervalued relative to realized volatility. This signals the possibility of increased market uncertainty.
3. Exit Conditions:
Positions are closed when the volatility spread crosses the zero line, signifying a normalization of the divergence.
Advantages of the DVDM:
1. Adaptability:
Dynamic thresholds allow the strategy to adjust to changing market conditions, making it suitable for both low-volatility and high-volatility environments.
2. Quantitative Precision:
The use of standard deviation-based thresholds enhances statistical reliability and reduces subjectivity in decision-making.
3. Market Versatility:
The strategy’s reliance on volatility metrics makes it universally applicable across asset classes and markets, ensuring robust performance.
Scientific Relevance:
The strategy builds on empirical research into the predictive power of implied volatility over realized volatility (Poon & Granger, 2003). By leveraging the divergence between these measures, the DVDM aligns with findings that IV often overestimates future volatility, creating opportunities for mean-reversion trades. Furthermore, the inclusion of dynamic thresholds aligns with risk management best practices by adapting to volatility clustering, a well-documented phenomenon in financial markets (Engle, 1982).
References:
1. Christoffersen, P., & Jacobs, K. (2004). The importance of the volatility risk premium for volatility forecasting. Journal of Financial and Quantitative Analysis, 39(2), 375-397.
2. Engle, R. F. (1982). Autoregressive conditional heteroskedasticity with estimates of the variance of United Kingdom inflation. Econometrica, 50(4), 987-1007.
3. Hull, J. C. (2012). Options, Futures, and Other Derivatives. Pearson Education.
4. Poon, S. H., & Granger, C. W. J. (2003). Forecasting volatility in financial markets: A review. Journal of Economic Literature, 41(2), 478-539.
5. Whaley, R. E. (2000). The investor fear gauge. Journal of Portfolio Management, 26(3), 12-17.
This strategy leverages quantitative techniques and statistical rigor to provide a systematic approach to volatility trading, making it a valuable tool for professional traders and quantitative analysts.

TradeCreator Pro - Moving Averages, RSI, Volume, Trends, Levels█ Overview
TradeCreator Pro is designed to help you build successful trades by streamlining the processes of trade planning, evaluation, and execution. With a focus on data accuracy, speed, precision, and ease of use, this all-in-one tool assists in identifying optimal entry and exit points, calculating risk/reward ratios, and executing trades efficiently. Whether you’re a beginner or an experienced trader, TradeCreator Pro empowers you to make informed, data-driven decisions with real-time signals and fully customizable settings.
█ Key Benefits & Use Cases
TradeCreator Pro is designed to help you effortlessly discover profitable trades by evaluating and testing multiple setups across different assets and timeframes. Key use cases include:
Quick Strategy Testing: Rapidly test multiple setups and strategies, gaining immediate insights into their potential outcomes.
Risk/Reward Evaluation: Quickly identify which trade ideas are worth pursuing based on their profitability and associated risk.
Multi-Timeframe Testing: Seamlessly test the same trading setup across various timeframes and tickers.
Backtesting: Analyze the historical performance of specific setups to gauge their effectiveness.
Key Level Identification: Instantly spot critical support and resistance levels, improving your decision-making process.
Custom Alerts: Set personalized notifications for key levels, ensuring timely action on potential trade opportunities.
█ Core Features
Dashboard: A real-time view of critical metrics such as trend strength, support/resistance levels, volume profiles, RSI divergence, and trade scoring. Designed to provide a comprehensive snapshot of your trading environment and potential trading outcome.
Trend Analysis: Detect prevailing trends by analyzing multiple moving averages, support/resistance zones, volume profile and linear regressions for RSI and closing prices.
Support & Resistance Identification: Automatically identify support and resistance levels.
Volume Profile: Visualize volume profile and its point of control across support/resistance ranges, helping you spot key consolidation areas.
RSI & Price Divergence Detection: Identify potential divergences between RSI and price through linear regressions, providing valuable trade signals.
Risk Management Tools: Set equity loss levels based on specified leverage, allowing you to manage risk effectively for both long and short trades.
Entry & Exit Recommendations: Identify multiple options for optimal entry and exit levels based on current market conditions.
Trade Scoring: Score each trade setup on a 0-100 scale, factoring in potential ROI, ROE, P&L, and Risk-Reward Ratios to ensure high-quality trade execution.
Dynamic Execution & Monitoring: Benefit from multi-stage exit strategies, dynamic trailing stop losses, and the ability to backtest setups with historical data.
Alerts & Automation: Customize alerts for key market movements and opt for manual or automated trading through TradingView’s supported partners.
█ How to Use
Installation: Add TradeCreator Pro to your TradingView chart.
Trend Adjustment: The system automatically detects the current market trend, but you can fine-tune all trend detection parameters as needed.
Trading Parameter Configuration: Customize entry, exit, profitability, and risk-reward settings to match your trading style.
Entry and Exit Level Refinement: Use the automated suggestions, or choose from conceptual or arbitrary levels for greater control.
Stop Loss and Profit Target Fine-Tuning: Apply the system’s recommendations or adjust them by selecting from multiple available options.
Backtest Setup: Run the backtester to analyze past performance and assess how the strategy would have performed historically.
Set Alerts: Stay informed by setting alerts to notify you when a trade setup is triggered.
█ Notes
The first time you apply the indicator to a chart, it may take a few moments to compile. If it takes too long, switch timeframes temporarily to restart the process.
█ Risk Disclaimer
Trading in financial markets involves significant risk and is not suitable for all investors. The use of TradeCreator Pro, as well as any other tools provided by AlgoTrader Pro, is purely for informational and educational purposes. These tools are not intended to provide financial advice, and past performance is not indicative of future results. It is essential to do your own research, practice proper risk management, and consult with a licensed financial advisor before making any trading decisions. AlgoTrader Pro is not responsible for any financial losses you may incur through the use of these tools.
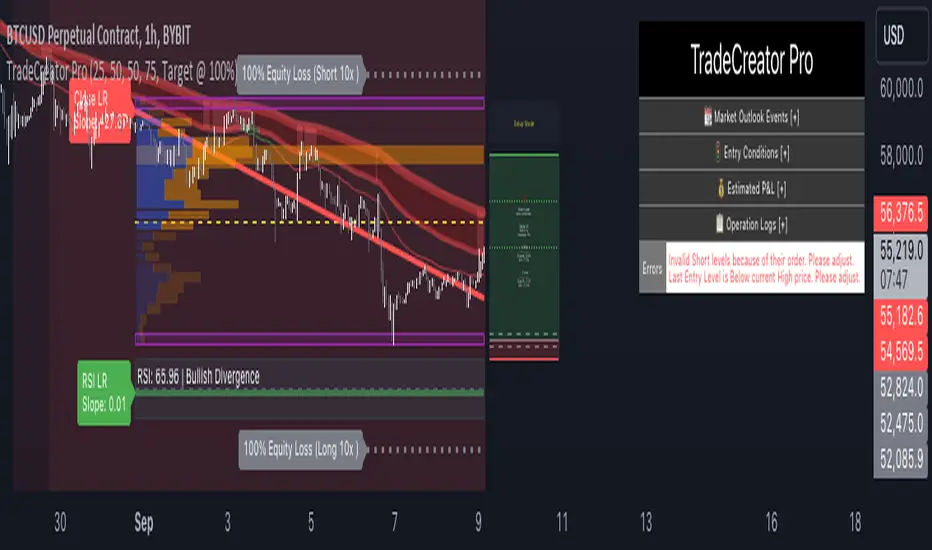
Fast EMA above Slow EMA with MACD (by Coinrule)An exponential moving average ( EMA ) is a type of moving average (MA) that places a greater weight and significance on the most recent data points. The exponential moving average is also referred to as the exponentially weighted moving average . An exponentially weighted moving average reacts more significantly to recent price changes than a simple moving average simple moving average ( SMA ), which applies an equal weight to all observations in the period.
Moving average convergence divergence ( MACD ) is a trend-following momentum indicator that shows the relationship between two moving averages of a security’s price. The MACD is calculated by subtracting the 26-period exponential moving average ( EMA ) from the 12-period EMA .
The result of that calculation is the MACD line. A nine-day EMA of the MACD called the "signal line," is then plotted on top of the MACD line, which can function as a trigger for buy and sell signals. Traders may buy the coin when the MACD crosses above its signal line and sell—or short—the security when the MACD crosses below the signal line. Moving average convergence divergence ( MACD ) indicators can be interpreted in several ways, but the more common methods are crossovers, divergences, and rapid rises/falls.
The Strategy enters and closes the trade when the following conditions are met:
LONG
The MACD histogram turns bullish
EMA8 is greater than EMA26
EXIT
Price increases 3% trailing
Price decreases 1% trailing
This strategy is back-tested from 1 January 2022 to simulate how the strategy would work in a bear market and provides good returns.
Pairs that produce very strong results include AXSUSDT on the 5-minute timeframe. This short timeframe means that this strategy opens and closes trades regularly.
Additionally, the trailing stop loss and take profit conditions can also be changed to match your needs.
The strategy assumes each order is using 30% of the available coins to make the results more realistic and to simulate you only ran this strategy on 30% of your holdings. A trading fee of 0.1% is also taken into account and is aligned to the base fee applied on Binance.

EMA and MACD with Trailing Stop Loss (by Coinrule)An exponential moving average ( EMA ) is a type of moving average (MA) that places a greater weight and significance on the most recent data points. The exponential moving average is also referred to as the exponentially weighted moving average. An exponentially weighted moving average reacts more significantly to recent price changes than a simple moving average simple moving average ( SMA ), which applies an equal weight to all observations in the period.
Moving average convergence divergence ( MACD ) is a trend-following momentum indicator that shows the relationship between two moving averages of a security’s price. The MACD is calculated by subtracting the 26-period exponential moving average ( EMA ) from the 12-period EMA.
The result of that calculation is the MACD line. A nine-day EMA of the MACD called the "signal line," is then plotted on top of the MACD line, which can function as a trigger for buy and sell signals. Traders may buy the security when the MACD crosses above its signal line and sell—or short—the security when the MACD crosses below the signal line. Moving average convergence divergence ( MACD ) indicators can be interpreted in several ways, but the more common methods are crossovers, divergences, and rapid rises/falls.
The Strategy enters and closes the trade when the following conditions are met:
LONG
The MACD histogram turns bearish
EMA7 is greater than EMA14
EXIT
Price increases 3% trailing
Price decreases 1% trailing
This strategy is back-tested from 1 January 2022 to simulate how the strategy would work in a bear market and provides good returns.
Pairs that produce very strong results include XRPUSDT on the 1-minute timeframe. This short timeframe means that this strategy opens and closes trades regularly
In order to further improve the strategy, the EMA can be changed from 7 and 14 to, say, EMA20 and EMA50. Furthermore, the trailing stop loss can also be changed to ideally suit the user to match their needs.
The strategy assumes each order is using 30% of the available coins to make the results more realistic and to simulate you only ran this strategy on 30% of your holdings. A trading fee of 0.1% is also taken into account and is aligned to the base fee applied on Binance.

Combo 2/20 EMA & Absolute Price Oscillator (APO) This is combo strategies for get a cumulative signal.
First strategy
This indicator plots 2/20 exponential moving average. For the Mov
Avg X 2/20 Indicator, the EMA bar will be painted when the Alert criteria is met.
Second strategy
The Absolute Price Oscillator displays the difference between two exponential
moving averages of a security's price and is expressed as an absolute value.
How this indicator works
APO crossing above zero is considered bullish, while crossing below zero is bearish.
A positive indicator value indicates an upward movement, while negative readings
signal a downward trend.
Divergences form when a new high or low in price is not confirmed by the Absolute Price
Oscillator (APO). A bullish divergence forms when price make a lower low, but the APO
forms a higher low. This indicates less downward momentum that could foreshadow a bullish
reversal. A bearish divergence forms when price makes a higher high, but the APO forms a
lower high. This shows less upward momentum that could foreshadow a bearish reversal.
WARNING:
- For purpose educate only
- This script to change bars colors.
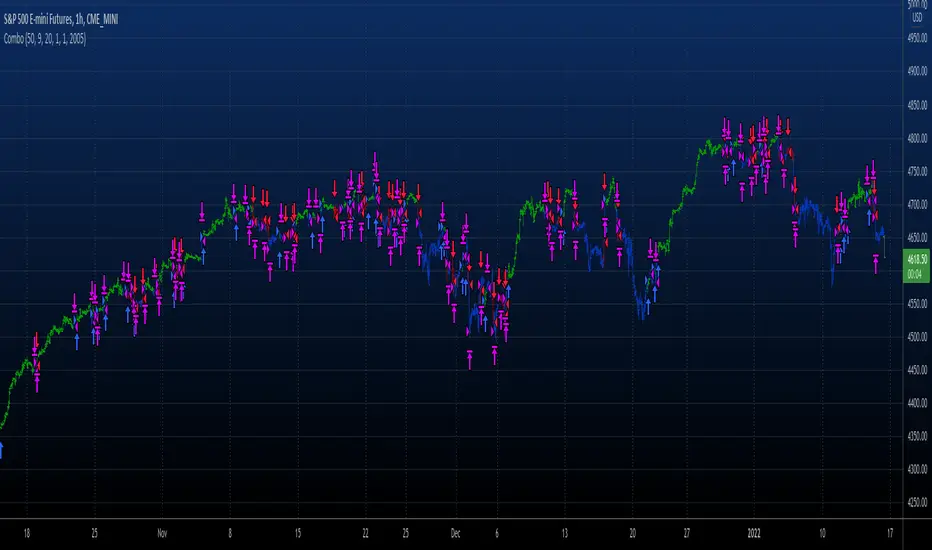
Combo Backtest 123 Reversal and Absolute Price Oscillator (APO) This is combo strategies for get
a cumulative signal. Result signal will return 1 if two strategies
is long, -1 if all strategies is short and 0 if signals of strategies is not equal.
First strategy
This System was created from the Book "How I Tripled My Money In The
Futures Market" by Ulf Jensen, Page 183. This is reverse type of strategies.
The strategy buys at market, if close price is higher than the previous close
during 2 days and the meaning of 9-days Stochastic Slow Oscillator is lower than 50.
The strategy sells at market, if close price is lower than the previous close price
during 2 days and the meaning of 9-days Stochastic Fast Oscillator is higher than 50.
Secon strategy
The Absolute Price Oscillator displays the difference between two exponential
moving averages of a security's price and is expressed as an absolute value.
How this indicator works
APO crossing above zero is considered bullish, while crossing below zero is bearish.
A positive indicator value indicates an upward movement, while negative readings
signal a downward trend.
Divergences form when a new high or low in price is not confirmed by the Absolute Price
Oscillator (APO). A bullish divergence forms when price make a lower low, but the APO
forms a higher low. This indicates less downward momentum that could foreshadow a bullish
reversal. A bearish divergence forms when price makes a higher high, but the APO forms a
lower high. This shows less upward momentum that could foreshadow a bearish reversal.
WARNING:
- For purpose educate only
- This script to change bars colors.

Absolute Price Oscillator (APO) Backtest 2.0 The Absolute Price Oscillator displays the difference between two exponential
moving averages of a security's price and is expressed as an absolute value.
How this indicator works
APO crossing above zero is considered bullish, while crossing below zero is bearish.
A positive indicator value indicates an upward movement, while negative readings
signal a downward trend.
Divergences form when a new high or low in price is not confirmed by the Absolute Price
Oscillator (APO). A bullish divergence forms when price make a lower low, but the APO
forms a higher low. This indicates less downward momentum that could foreshadow a bullish
reversal. A bearish divergence forms when price makes a higher high, but the APO forms a
lower high. This shows less upward momentum that could foreshadow a bearish reversal.
You can change long to short in the Input Settings
WARNING:
- For purpose educate only
- This script to change bars colors.

Slickwater Strategy [frac]This indicator is the culmination of various other indicators and attempts to help traders assess the actual current trend and filter out all the noise.
In reality, this indicator is extremely similar to the Traders Dynamic Index in concept and the overall results of the indicator across any time frame. The differences though are that while TDI uses just RSI, this uses RSI, CCI, MFI, and TSI, and also includes an assessment of the momentum associated with the move, to better enable traders to detect divergence.
The default settings generate the best returns across any time frame, however can be ultra sensitive and generate too many trade signals on high resolution time frames (i.e., the 15M or 30M). If one desires less sensitive results, one can use (14,12,9) for the first 3 inputs. This generates consistent signals, but is not as sensitive as the default.
In general:
GO LONG:
- Scalp: Wt1 crosses over Wt2
- Short Term: Wt1 crosses over Wt2 and the middle band. Wt2 is above the middle band as well
- Medium Term: Same as short term, but there are extended oversold trading signals (yellow dots)
- Long term: Same as medium term, but there is divergence in the momentum as well (i.e. it is increasing while price decreases)
GO SHORT:
- Scalp: Wt1 crosses under Wt2
- Short Term: Wt1 crosses under Wt2 and the middle band. Wt2 is below the middle band as well.
- Medium Term: Same as short term, but there are extended overbought trading signals (yellow dots)
- Long term: Same as medium term, but there is divergence in the momentum as well (i.e., it is decreasing while price increases)

Absolute Price Oscillator (APO) Backtest The Absolute Price Oscillator displays the difference between two exponential
moving averages of a security's price and is expressed as an absolute value.
How this indicator works
APO crossing above zero is considered bullish, while crossing below zero is bearish.
A positive indicator value indicates an upward movement, while negative readings
signal a downward trend.
Divergences form when a new high or low in price is not confirmed by the Absolute Price
Oscillator (APO). A bullish divergence forms when price make a lower low, but the APO
forms a higher low. This indicates less downward momentum that could foreshadow a bullish
reversal. A bearish divergence forms when price makes a higher high, but the APO forms a
lower high. This shows less upward momentum that could foreshadow a bearish reversal.
You can change long to short in the Input Settings
Please, use it only for learning or paper trading. Do not for real trading.
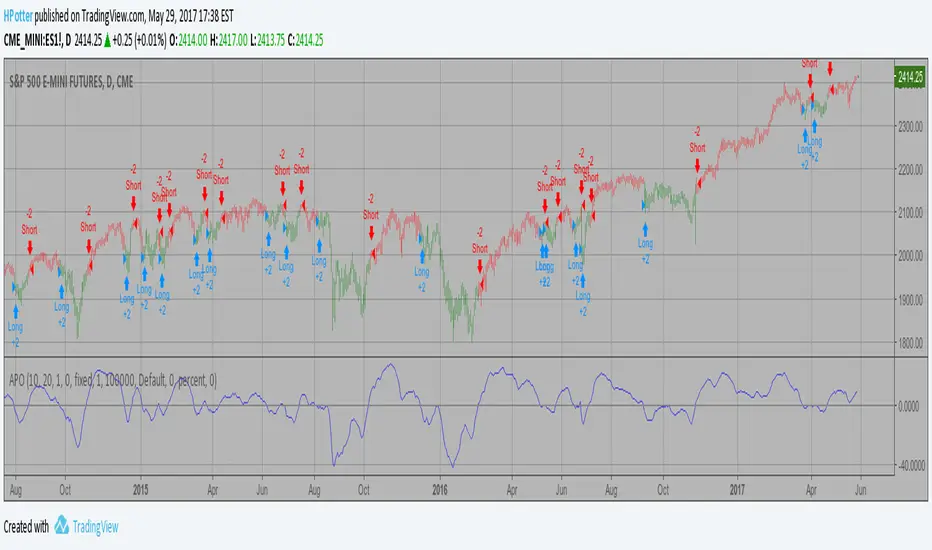
EMA RSI ATR Hidden Div Strat - 1 MinHey there!
Hereby I present you the EMA RSI Lowest Low Hidden Divergence strategy, which I discovered on a youtube channel.
He has tested the strategy hundreds of times manually, herewith I try to automate the whole thing.
Since I use the strategy with a bot, it can only enter long positions for now. But in the future I will add the possibility to trade short positions.
The strategy was tested with BTC/ USDT in 1m chart (8 days). The values must be adjusted depending on the timeframe and coin.
-----------------------------------------------------------------------------------
How does the strategy work?
First of all, we need a bullish hidden divergence.
Once this is detected, the following parameters are checked:
The 50 EMA must cross the 250 EMA .
Then, the candle must close above the 50 EMA .
The K line of the RSI STOCH indicator need to crosses the D line.
If the next candle closes above the 50 EMA , a long position is opened.
The stop loss is determined with the "lowest low/highest high lookback".
The profit factor is multiplied by the value of the lowest low/highest high lookback.
The results of the strategy are without commissions and levers.
If you have any questions or feedback, please let me know in the comments.
In the future I will add other types of stop loss / take profits. (ATR; %; eg.)
I wish you good luck with the strategy!

Combo Backtest 123 Reversal & Ergodic TSI This is combo strategies for get a cumulative signal.
First strategy
This System was created from the Book "How I Tripled My Money In The
Futures Market" by Ulf Jensen, Page 183. This is reverse type of strategies.
The strategy buys at market, if close price is higher than the previous close
during 2 days and the meaning of 9-days Stochastic Slow Oscillator is lower than 50.
The strategy sells at market, if close price is lower than the previous close price
during 2 days and the meaning of 9-days Stochastic Fast Oscillator is higher than 50.
Second strategy
r - Length of first EMA smoothing of 1 day momentum 4
s - Length of second EMA smoothing of 1 day smoothing 8
u- Length of third EMA smoothing of 1 day momentum 6
Length of EMA signal line 3
Source of Ergotic TSI Close
This is one of the techniques described by William Blau in his book "Momentum,
Direction and Divergence" (1995). If you like to learn more, we advise you to
read this book. His book focuses on three key aspects of trading: momentum,
direction and divergence. Blau, who was an electrical engineer before becoming
a trader, thoroughly examines the relationship between price and momentum in
step-by-step examples. From this grounding, he then looks at the deficiencies
in other oscillators and introduces some innovative techniques, including a
fresh twist on Stochastics. On directional issues, he analyzes the intricacies
of ADX and offers a unique approach to help define trending and non-trending periods.
WARNING:
- For purpose educate only
- This script to change bars colors.

Combo Backtest 123 Reversal & Ergodic MDI This is combo strategies for get a cumulative signal.
First strategy
This System was created from the Book "How I Tripled My Money In The
Futures Market" by Ulf Jensen, Page 183. This is reverse type of strategies.
The strategy buys at market, if close price is higher than the previous close
during 2 days and the meaning of 9-days Stochastic Slow Oscillator is lower than 50.
The strategy sells at market, if close price is lower than the previous close price
during 2 days and the meaning of 9-days Stochastic Fast Oscillator is higher than 50.
Second strategy
This is one of the techniques described by William Blau in his book "Momentum,
Direction and Divergence" (1995). If you like to learn more, we advise you to
read this book. His book focuses on three key aspects of trading: momentum,
direction and divergence. Blau, who was an electrical engineer before becoming
a trader, thoroughly examines the relationship between price and momentum in
step-by-step examples. From this grounding, he then looks at the deficiencies
in other oscillators and introduces some innovative techniques, including a
fresh twist on Stochastics. On directional issues, he analyzes the intricacies
of ADX and offers a unique approach to help define trending and non-trending periods.
WARNING:
- For purpose educate only
- This script to change bars colors.