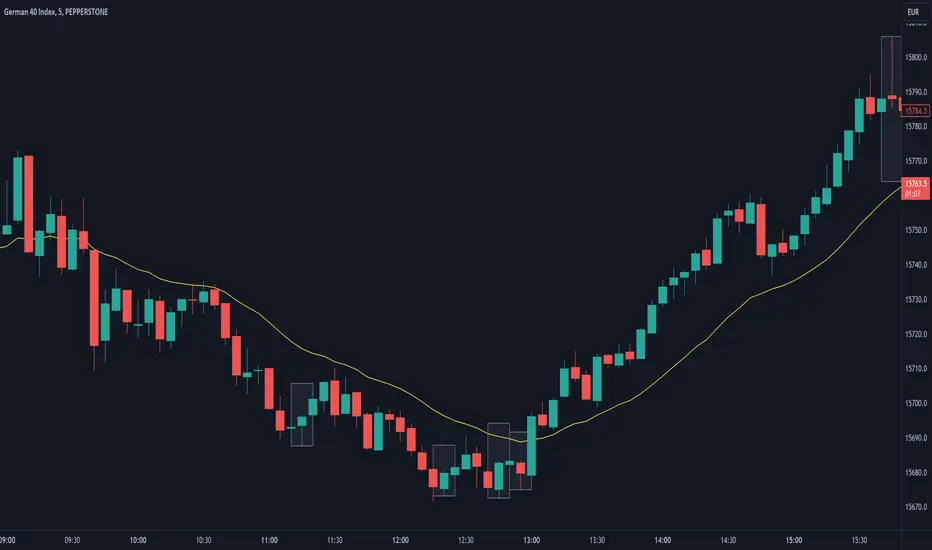
Are stop orders making money? [yohtza]Who is this indicator for and what does it do?
This is an indicator that helps price action traders in determining the strength of the trend and potential counter trend traps that present themselves during the move. It highlights the background of the bar at which counter trend traders that trade with stop orders (breakout entries) were able to achieve the same amount of reward as was their risk for that trade.
What is it based on?
When there is a strong trend in effect, the counter trend traders are unable to buy above(in bear trend) or sell below (in bull trend) a bar with a stop order and get an equal reward for the risk they are taking.
The first time counter trend traders are able to buy and make money in bear or sell and make money in bull it is a warning sign that market is likely transitioning into trading range phase of the market cycle.
Another application of the indicator is for discovering potential traps. If market comes very close to the take profit level of counter trend traders and reverses, they will usually try to get out with as much profit or as small of a loss as possible and that will often create a fast move (also called giving up) and a good with trend entry.
How does it work?
The indicator is using exponential moving average as a filter for when the market is trending and then scans for signals where counter trend traders enter. Next it looks if the stoploss or profit target was hit for that trade. If the profit target was hit it draws a box around the bar on which the traders entered, the box height is based on stoploss and profit target price levels.
Indicator inputs
- Scan for doji signal bars
When this option is selected, bars that have small bodies (less than 50% of their height) are also included as bars on which counter traders enter. If the option is not selected it only looks for bull trend bars (bodies are greater than 50% of their height) below the moving average and bear trend bars above the moving average.
- Border and background colors and border style
It is possible to select different colors and chose between solid, dashed and dotted borders
- Ema period
Default setting is 20 bar exponential moving average but feel free to use which you prefer
- Tick value
This is the value of the minimal movement of the chart you are trading on. For example for S&P 500 E-mini futures the value is 0.25 and that is the default setting.
Cari dalam skrip untuk "Exponential Moving Average"
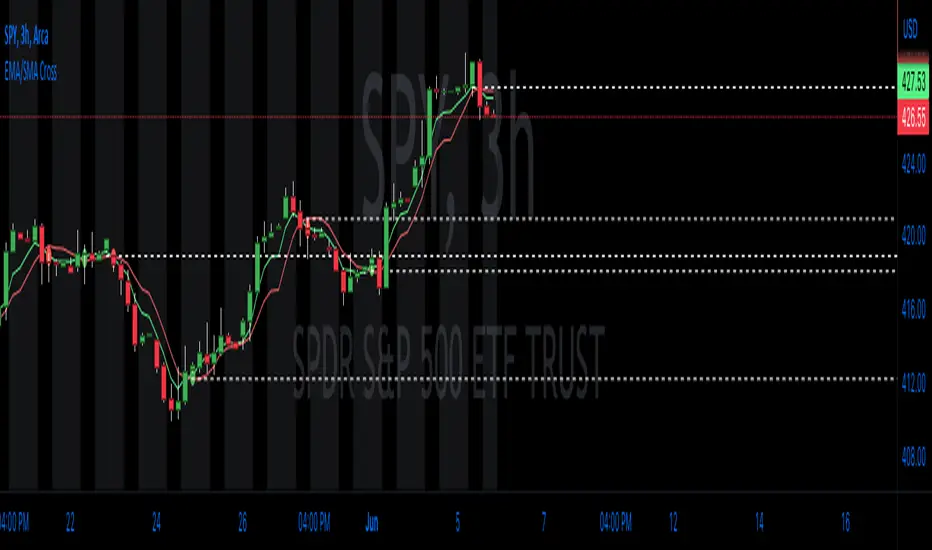
EMA/SMA Cross with LevelsThe EMA/SMA Cross indicator is a valuable trading tool designed to assist traders in identifying potential trend reversals or entry and exit points in the market. By plotting two moving averages, one based on the Exponential Moving Average (EMA) and the other on the Simple Moving Average (SMA), this indicator highlights the points at which these averages cross, signaling a potential change in the market trend. This straightforward yet powerful indicator follows the core principles of technical analysis, allowing traders to visualize key price levels that may influence future price action.
The underlying concept of this indicator revolves around the calculation and comparison of the short-term EMA and the long-term SMA. The EMA is a type of weighted moving average that gives more importance to recent price data, making it more responsive to new information. In contrast, the SMA assigns equal weight to all data points within a specified period, providing a smoother representation of price trends. By comparing these two averages, traders can gain insights into potential shifts in market sentiment and momentum.
When the short-term EMA crosses above the long-term SMA, it signals a possible bullish trend reversal, indicating that the recent price momentum is gaining strength. Conversely, when the short-term EMA crosses below the long-term SMA, it suggests a bearish trend reversal, implying that the recent price momentum is weakening. Traders can use these crossing points as potential entry or exit signals, depending on their trading strategy and risk tolerance.
A unique feature of this indicator is its ability to plot the crossing levels on the chart. When the short-term EMA crosses the long-term SMA, a dashed line is drawn horizontally at the level of the cross, emphasizing the significance of the price level. This line serves as a reference point for traders, helping them to identify potential support or resistance levels that may influence future price movements.
By plotting the crossing levels, the EMA/SMA Cross indicator offers traders an additional layer of information that can be used in their decision-making process. These levels can act as crucial points for stop-loss or take-profit orders, depending on the trader's strategy and risk tolerance. Additionally, they can serve as a basis for further technical analysis, such as the identification of chart patterns or the application of other technical indicators.
This indicator works best with trading methods that focus on capturing price reversals or breakouts. It is particularly useful for traders who employ trend-following or momentum-based strategies, as it helps them identify the optimal moments to enter or exit a trade. However, it's important to note that the EMA/SMA Cross indicator should be used in conjunction with other technical analysis tools and an understanding of the overall market context to make informed trading decisions.
When using the EMA/SMA Cross indicator on TradingView, users can customize the time frame, source, and length for both the short-term EMA and long-term SMA, as well as the number of recent crossing lines displayed on the chart. This flexibility allows traders to tailor the indicator to their specific trading style and preferences.
In summary, the EMA/SMA Cross indicator is an essential tool for traders looking to identify potential trend reversals or entry and exit points in the market. By comparing the short-term EMA and long-term SMA, this indicator provides valuable insights into shifts in market sentiment and momentum. It is best suited for trend-following and momentum-based trading strategies and should be used in combination with other technical analysis tools for optimal results.
RSI Exponential Smoothing (Expo)█ Background information
The Relative Strength Index (RSI) and the Exponential Moving Average (EMA) are two popular indicators. Traders use these indicators to understand market trends and predict future price changes. However, traders often wonder which indicator is better: RSI or EMA.
What if these indicators give similar results? To find out, we wanted to study the relationship between RSI and EMA. We focused on a hypothesis: when the RSI goes above 50, it might be similar to the price crossing above a certain length of EMA. Similarly, when the RSI goes below 50, it might be similar to the price crossing below a certain length of EMA.
Our goal was simple: to figure out if there is any connection between RSI and EMA.
Conclusion: Yes, it seems that there is a correlation between RSI and EMA, and this indicator clearly displays that relationship. Read more about the study here:
█ Overview of the indicator
The RSI Exponential Smoothing indicator displays RSI levels with clear overbought and oversold zones, shown as easy-to-understand moving averages, and the RSI 50 line as an EMA. Another excellent feature is the added FIB levels. To activate, open the settings and click on "FIB Bands." These levels act as short-term support and resistance levels which can be used for scalping.
█ Benefits of using this indicator instead of regular RSI
The findings about the Relative Strength Index (RSI) and the Exponential Moving Average (EMA) highlight that both indicators are equally accurate (when it comes to crossings), meaning traders can choose either one without compromising accuracy. This empowers traders to pick the indicator that suits their personal preferences and trading style.
█ How it works
Crossings over/under the value of 50
The EMA line in the indicator acts as the corresponding 50 line in the RSI. When the RSI crosses the value 50 equals when Close crosses the EMA line.
Bouncess from the value 50
In this example, we can see that the EMA line on the chart acts as support/resistance equals when RSI rejects the 50 level.
Overbought and Oversold
The indicator comes with overbought and oversold bands equal when RSI becomes overbought or oversold.
█ How to use
This visual representation helps traders to apply RSI strategies directly on the price chart, potentially making RSI trading easier for traders.
-----------------
Disclaimer
The information contained in my Scripts/Indicators/Ideas/Algos/Systems does not constitute financial advice or a solicitation to buy or sell any securities of any type. I will not accept liability for any loss or damage, including without limitation any loss of profit, which may arise directly or indirectly from the use of or reliance on such information.
All investments involve risk, and the past performance of a security, industry, sector, market, financial product, trading strategy, backtest, or individual's trading does not guarantee future results or returns. Investors are fully responsible for any investment decisions they make. Such decisions should be based solely on an evaluation of their financial circumstances, investment objectives, risk tolerance, and liquidity needs.
My Scripts/Indicators/Ideas/Algos/Systems are only for educational purposes!

HS,HH,LL,and EMA by: rpalconitHello everyone,
HS,HH,LL, and EMA stands for Hull Suite, Higher High, Lower Low and Exponential Moving Average.
Signal Features:
• Long Position: If the Higher High and Lower Low signals are LL and LH at the SUPPORT LEVEL, plot the Fibonacci Retracement and get retracement from 0.382,0.5 and 0.618 for EP. and your SL should be at 1.1 level of the Fibonacci, target TP should be 1.5 ratio. For confirmations the Hull Suite (HS) should be green color and on or below the Exponential Moving Average (EMA).
• Short Position: If the Higher High and Lower Low signals are HH and HL at the RESISTANCE LEVEL, plot the Fibonacci Retracement and get retracement from 0.382,0.5 and 0.618 for EP. and your SL should be at 1.1 level of the Fibonacci, target TP should be 1.5 ratio. For confirmations the Hull Suite (HS) should be red color and on or above the Exponential Moving Average (EMA).
You can change EMA length in any of your preference. The Default is 50.
Details about the indicator
INPUTS
Time Frame
• Time Frames Chart: You can select your preferred timeframe at the dropdown list. Default is 4H. Aside from Time Fame, I advice not to change anything at input default for better result.
STYLE
• Note: For effective signals results and to minimize noise, you need to uncheck first on the style tab: MHULL, BAR COLOR AND LINES.
Best regards,
ruelpalconit

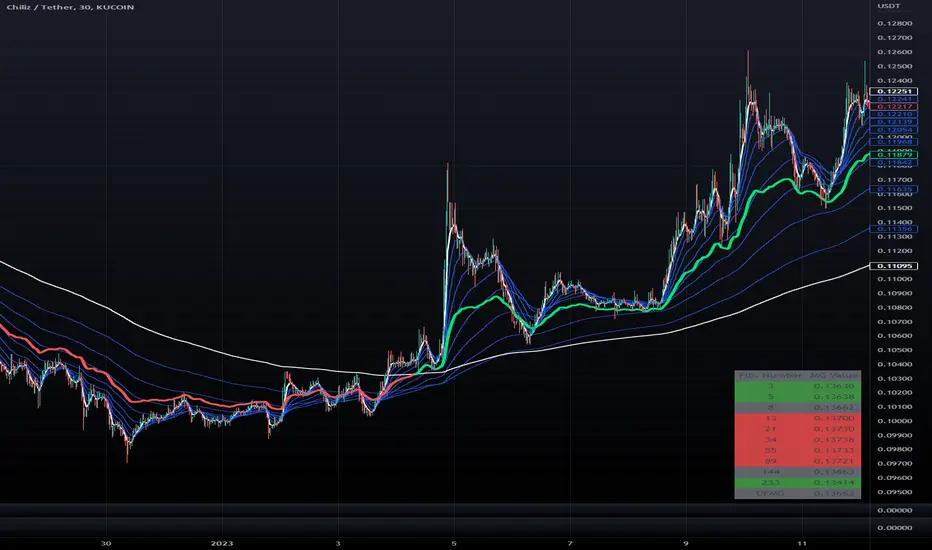
Democratic Fibonacci McGinley DynamicsWith this indicator, we have taken McGinley Dynamic lines at Fibonacci lengths (3 to 233) as well as the average of these values, labeled the DFMG (Democratic Fib. McGinley). Additionally, these values have been inputted into a table overlay. The cross of the FibMG(233) and the DFMG can be used as a signal for long or short.
The FibMG lengths of 3 and 233 are plotted in white by default, the FibMGs with lengths between 3 and 233 are plotted in blue by default, and the democratic line (DFMG) that averages these lines is plotted in green or red depending on if the value is above or below the 233-length FibMG.
This is the same indicator as our DFMA except using McGinley Dynamic lines as opposed to exponential moving averages.
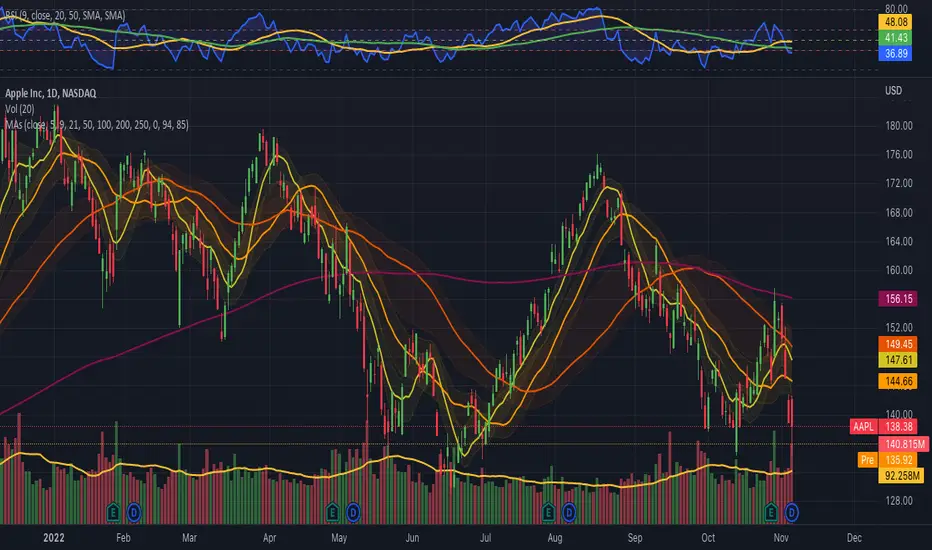
Moving Averages Ribbon (7 EMAs/SMAs)This Indicator provides a combination which is suitable for visualizing many Simple Moving Averages (SMAs) and Exponential Moving Averages (EMAs). There are 7 possible periods 5,9,20,50,100,200,250. There is a possibility to show only EMAs or only SMAs or both. EMAs have thinner curves by default, to be able to distinguish them from SMAs. Additionally, there are highlighted channels between the MAs of the highs and the MAs of the lows, showing a channel of specific moving averages. It comes with a presetting showing EMAs 5,9,20,50,200 and SMAs 9,20,50,200, while the MA channels are only visible for 9 and 50.
EMAs:
SMAs:
Both
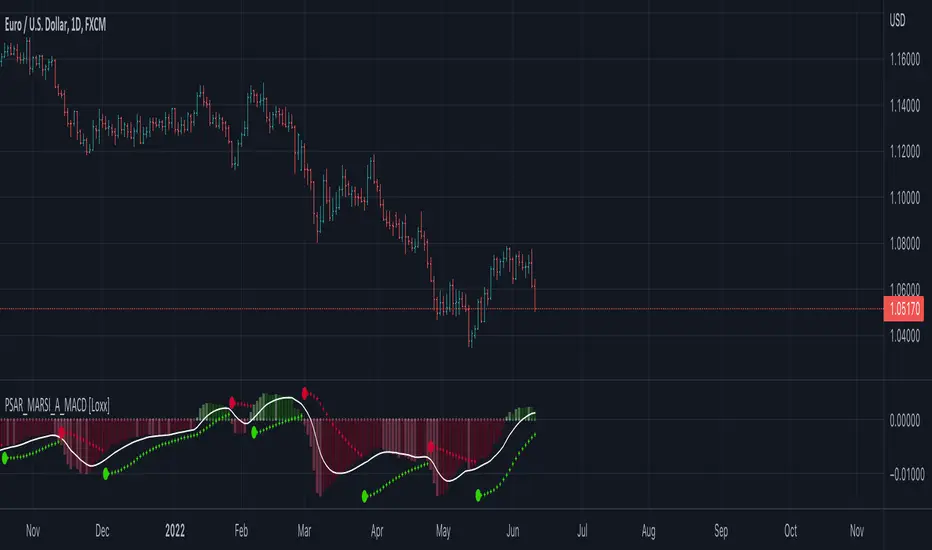
Parabolic SAR MARSI, Adaptive MACD [Loxx]Parabolic SAR MARSI, Adaptive MACD is a trend following indicator that combines MACD, Parabolic SAR, and RSI into a signal indicator.
What is Parabolic SAR?
The parabolic stop and reverse, more commonly known as the "Parabolic SAR," or "PSAR" is a trend-following indicator developed by J. Welles Wilder. It is displayed as a single parabolic line (or dots) underneath the price bars in an uptrend, and above the price bars in a downtrend.
What is MACD?
Moving average convergence divergence (MACD) is a trend-following momentum indicator that shows the relationship between two moving averages of a security’s price. The MACD is calculated by subtracting the 26-period exponential moving average (EMA) from the 12-period EMA.
What is RSI?
The relative strength index (RSI) is a momentum indicator used in technical analysis that measures the magnitude of recent price changes to evaluate overbought or oversold conditions in the price of a stock or other asset. The RSI is displayed as an oscillator (a line graph that moves between two extremes) and can have a reading from 0 to 100. The indicator was originally developed by J. Welles Wilder Jr. and introduced in his seminal 1978 book, “New Concepts in Technical Trading Systems.”
How to combine PSAR, MACD, and RSI into one:
1. Create a new type of moving average called MARSI. MARSI is like a typical moving average but it flexes to RSI sensitivities
2. Calculate MACD for the MARSI of High/Low values
3. Calculate the midpoint MACD between the High/Low MACDs created in step 2
4. Create a final MACD by calculating the MARSI for the midpoint MACD created in step 3
5. Finally, Inject these values into a customized Parabolic SAR function
Results:
-A unique spin on three different indicators that identifies trends of both RSI, MACD, and price of the underlying asset
-Entry, exit, and reversal points in price, RSI, and MACD
-A MACD that adapts to RSI
What's Included?
-Customization of all variables
-A variety of moving averages to smooth the signal line
-Customizable colors
-Alerts for MACD zero-line and signal crosses, and PSAR trend direction changes
Things to know:
-The histogram in this indicator is NOT the normal histogram found in the classic MACD indicator. The histogram here is a histogram of MACD itself. The classic histogram has questionable utility but the histogram in this indicator is very important and useful
-Parabolic SAR is calculated on the MARSI of High/Low values
Future releases:
-Divergences
-Regular, continuation, and exit signals
Happy trading!
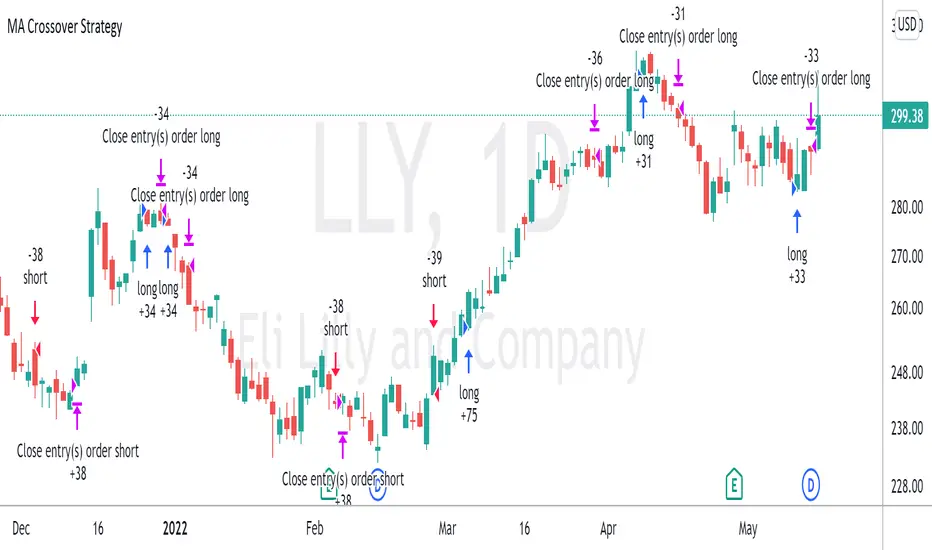
Moving Average Crossover StrategyThe Moving Average Crossover indicator uses 3 moving averages (2 simple moving averages and 1 exponential moving average ) to signal long and short opportunities based on moving average crossovers. This strategy serves as a backtest to that indicator. By taking entry and exit positions based on moving average crossovers, we are able to project profit with this script. You are given the option to select which moving average crossings trigger entry and exit signals. Fast refers to an EMA which should be your shortest MA. Slow refers to the first SMA which will serve as a signal line. Trend refers to a long SMA which will help determine if you should take long positions or short. You can also filter by extra conditions such as minimum volume or RSI. For example, you may have the script trigger a buy signal if the 5ema crosses the 20 sma while RSI reads 60 and sell if it crosses again.
This strategy starts with $100,000 and uses 10% of the account per trade.
CommonFiltersLibrary "CommonFilters"
Collection of some common Filters and Moving Averages. This collection is not encyclopaedic, but to declutter my other scripts. Suggestions are welcome, though. Many filters here are based on the work of John F. Ehlers
sma(src, len) Simple Moving Average
Parameters:
src : Series to use
len : Filtering length
Returns: Filtered series
ema(src, len) Exponential Moving Average
Parameters:
src : Series to use
len : Filtering length
Returns: Filtered series
rma(src, len) Wilder's Smoothing (Running Moving Average)
Parameters:
src : Series to use
len : Filtering length
Returns: Filtered series
hma(src, len) Hull Moving Average
Parameters:
src : Series to use
len : Filtering length
Returns: Filtered series
vwma(src, len) Volume Weighted Moving Average
Parameters:
src : Series to use
len : Filtering length
Returns: Filtered series
hp2(src) Simple denoiser
Parameters:
src : Series to use
Returns: Filtered series
fir2(src) Zero at 2 bar cycle period by John F. Ehlers
Parameters:
src : Series to use
Returns: Filtered series
fir3(src) Zero at 3 bar cycle period by John F. Ehlers
Parameters:
src : Series to use
Returns: Filtered series
fir23(src) Zero at 2 bar and 3 bar cycle periods by John F. Ehlers
Parameters:
src : Series to use
Returns: Filtered series
fir234(src) Zero at 2, 3 and 4 bar cycle periods by John F. Ehlers
Parameters:
src : Series to use
Returns: Filtered series
hp(src, len) High Pass Filter for cyclic components shorter than langth. Part of Roofing Filter by John F. Ehlers
Parameters:
src : Series to use
len : Filtering length
Returns: Filtered series
supers2(src, len) 2-pole Super Smoother by John F. Ehlers
Parameters:
src : Series to use
len : Filtering length
Returns: Filtered series
filt11(src, len) Filt11 is a variant of 2-pole Super Smoother with error averaging for zero-lag response by John F. Ehlers
Parameters:
src : Series to use
len : Filtering length
Returns: Filtered series
supers3(src, len) 3-pole Super Smoother by John F. Ehlers
Parameters:
src : Series to use
len : Filtering length
Returns: Filtered series
hannFIR(src, len) Hann Window Filter by John F. Ehlers
Parameters:
src : Series to use
len : Filtering length
Returns: Filtered series
hammingFIR(src, len) Hamming Window Filter (inspired by John F. Ehlers). Simplified implementation as Pedestal input parameter cannot be supplied, so I calculate it from the supplied length
Parameters:
src : Series to use
len : Filtering length
Returns: Filtered series
triangleFIR(src, len) Triangle Window Filter by John F. Ehlers
Parameters:
src : Series to use
len : Filtering length
Returns: Filtered series
doPrefilter(type, src) Execute a particular Prefilter from the list
Parameters:
type : Prefilter type to use
src : Series to use
Returns: Filtered series
doMA(type, src, len) Execute a particular MA from the list
Parameters:
type : MA type to use
src : Series to use
len : Filtering length
Returns: Filtered series

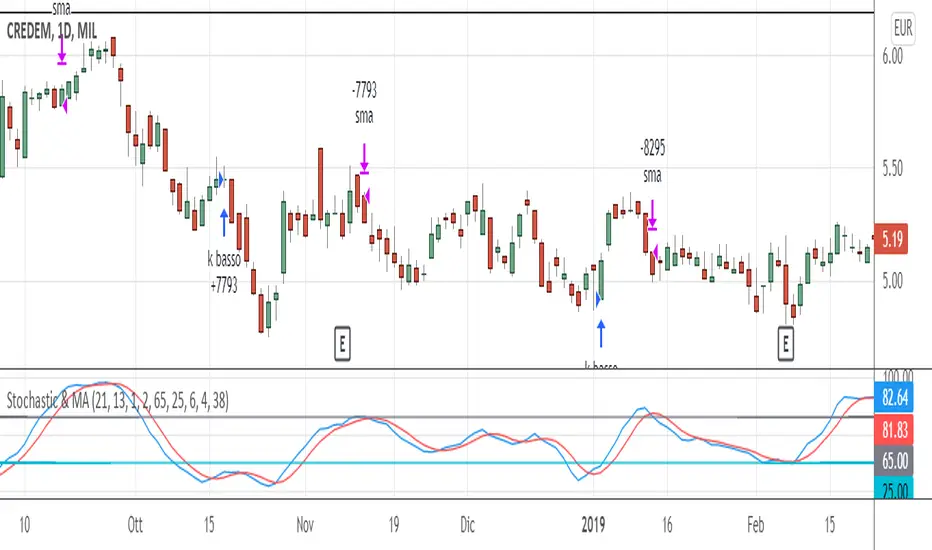
Stochastic & MAThis trading system comes from the experience of having a "fast" signal for entry at low prices (such as the stoscastic) and then "following" the stock with a "slower" indicator such as the exponential moving average. Both the input and output signals are filtered.
The use of the trading system only carries out long operations and has been tested on shares and ETFs, including indices, on daily bases (End Of Day).
ENTRY CONDITION: when stochastic's k is higher than d (on the default value of 21 periods) we enter the lower part of the oversold, to which we apply a filter or the confirmation that the closing of the day of the crossing is higher than that of the n -th previous bar (the 2nd previous bar recommended).
Other default settings are k = 6 and d = 4; the oversold level is also customizable (recommended = 25).
EXIT CONDITIONS: once the entry has "gone well", we follow the upward trend of the stock not with a stochastic oscillator - which tends to exit too soon, especially in case of strong trends - but with a simple moving average exponential (by default at 38 periods). Also in this case a filter is added, that is, k must be> to a filter threshold (recommended = 65) which is used to distinguish the decline between a "physiological" tracking. "(k drops" slowly "together with the approach of prices to the moving average) from a more" violent "tracking (prices are below the moving average and k consequently fall" suddenly ", in a few bars).
MONEY MANAGEMENT: 13% stop loss inserted (the physiological level of tracking of the shares is generally max 8-12% so we also consider a 1% margin due to trading). For more volatile stocks, the level can be extended to 20%.
LEVERAGE: the default value is equal to 1, but it is advisable, for simulations on shares, to use higher levers (x2, x3, ...) if you trade the relative CFD or on the index in case of buying and selling of Leveraged ETFs (e.g. LEVMIB which is 2x leveraged ETFs on Italian index).
Trading Made Easy Pressure OscillatorAs always, this is not financial advice and use at your own risk. Trading is risky and can cost you significant sums of money if you are not careful. Make sure you always have a proper entry and exit plan that includes defining your risk before you enter a trade.
Those who have looked at my other indicators know that I am a big fan of Dr. Alexander Elder and John Carter. This is relevant to my trading style and to this indicator in general. While I understand it goes against TradingView rules generally to display other indicators while describing a new one, I need the Bollinger Bands, Bollinger Bands Width, and a secondary directional indicator to explain the full power of this indicator. In short, if this is strongly against the rules, I will edit the post as needed.
Those of you who are aware of John Carter are going to know this already, but for those who don’t, an explanation is necessary. John Carter is a relatively famous retail-turned-institutional (sort of) trader. He is the founder of TradetheMarkets, that later turned into SimplerTrading. Him and his company have a series of YouTube videos, he has made appearances on the MoneyShow, TastyTrade, and has authored a couple of books about trading. However, he is probably most famous for his “Squeeze” indicator that was originally launched on Thinkorswim and through his website but has now been incorporated into several trading platforms and even has a few open-source versions available here. In short, the Squeeze indicator looks to identify periods of consolidation and marry that with a momentum oscillator so you can position yourself in a quiet period before a large move. This in my opinion, is one of the best indicators an option trader can have, since options are priced both on time and volatility. To do this, the Squeeze identifies when the Bollinger Bands, a measure of price standard deviation, have contracted inside the Keltner Channels (a measure of the average range of a stock). This highlights something known as “the Squeeze”, when the 2x standard deviations (95% of all likely price movement using data from the past 20 periods) is less than the 1.5x average true range (ATR) of the stock over the same number of periods. These periods are when a stock is resting and in a period of consolidation and is generally followed by another large move once it has rested long enough. The momentum oscillator is used to determine the direction of this next move.
While I think this is one of the best indicators ever made, it is not without its pitfalls. I find that the “Squeeze” periods sometimes take too long to setup (something that was addressed by John and released in a new indicator, the Squeeze Pro, but even that is still slowish) and that the momentum oscillator was also a bit slow. They used a linear regression formula to track momentum, which can lag considerably at times. Collectively, this meant that getting into moves a few candles late was not uncommon or someone solely trading squeeze setups could have missed very good trade opportunities.
To improve on this, I present, the Trading Made Easy Pressure Oscillator. This more accurately identifies when volatility is reducing and the trading range is likely to contract, increasing the “pressure” on the price. This is often marked several candles before a “Squeeze” has started. To identify these ranges, I applied a 21-period exponential moving average to the Bollinger Bands Width indicator (BBW). As mentioned above, the Bollinger Bands measure the 2x standard deviation of price, typically based on a 20-period SMA. When the BBs expand, it marks periods of high volatility, when they contract, conversely, periods of low volatility. Therefore, applying an EMA to the BBW indicator allows us to confidently mark when volatility has slowed down earlier than traditional methods. The second improvement I made was using the Absolute Price oscillator instead of a linear regression-style oscillator. The APO is very similar to a MACD, it measures the difference between two exponential moving averages, here the 8 and 21 (Fibonacci EMAs). However, I find the APO to be smoother than the MACD, yet more reactive than the linear regression-style oscillators to get you into moves earlier.
Uses:
1) Buying before a bigger than expected move. This is especially relevant for options traders since theta decay will often eat away much of our profits while we wait for a large enough price move to offset the time decay. Here, we buy a call option/shares when the momentum oscillator matches the longer-term trend (i.e. the APO crosses over the zero line when price is above the 200-day EMA, and vice versa for puts/shorting the stock). This coincides with Dr. Elder’s Triple Screen Trading System, that we are aligning ourselves with the path of least resistance. We want to do this when price is currently in an increasing pressure situation (i.e. volatility is contracting) to make sure we are buying an option when premium and Implied Volatility is low so we can get a better price and have a better risk to reward ratio. Low volatility is denoted by a purple dot, high volatility a blue dot along the midline of the indicator. A scalper or short-term swing trader may look to exit when the blue dots turn purple signalling a likely end to a move. A longer-term trend trader can look to other exit scenarios, such as a cross of the oscillator below the zero line, signalling to go short, or using a moving average as a trailing stop.
2) Sell premium after a larger than expected move has finished. After a larger than expected move has completed (a series of blue dots is followed by a purple dot), use this time to sell theta-driven options strategies such as straddles, strangles, iron condors, calendar spreads, or iron butterflies, anything that benefits from contracting volatility and stagnating prices. This is useful here since reducing volatility typically means a contraction of prices and the reduced likelihood of a move outside of the normal range.
3) Divergences. This indicator is sensitive enough to highlight divergences. I personally don’t use it as such as I prefer to trend trade vs. reversion trade. Use at your own risk, but they are there.
In summary, this indicator improves upon the famous Squeeze indicator by increasing the speed at which periods of consolidation are marked and trend identification. I hope you enjoy it.

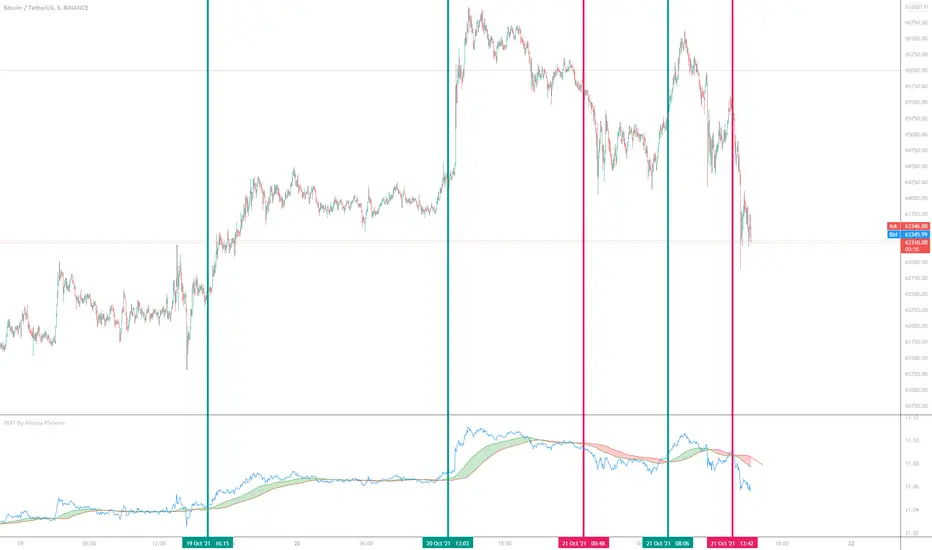
Price Movement Trend By Alireza Phoenix (Logarithmic)hi Traders
This logarithmic indicator shows the price movement trend, which is designed based on logarithmic functions and moving averages.
The Price Movement Trend Display Composed By :
A leading line consisting of the natural logarithm of Running Moving Average with length 60 and Offset 20 , and is displayed in red line.
A signal line consisting of a natural logarithm of an exponential moving average of length 90 , and is displayed in green line.
A price line consisting of the natural logarithm of a simple moving average along 1 whose source is price close , and is displayed in blue line.
A hidden price line consisting of the natural logarithm of a simple moving average along 1 and its source being the highest and lowest average prices , and is displayed in maroon line.
Learning how to get a signal from the price Movement trend indicator:
Moving the signal line and breaking the leading line upwards to form a green cloud is a buy signal.
Moving the signal line and breaking the leading line downwards that forms a red cloud is a sell signal.
Moving the price line and breaking the trend cloud upward , is a buy signal
Moving the price line and breaking the trend cloud downwards , is a sell signal
My instagram id : @pnxf6
ترجمه فارسی :
سلام تریدرها
این اندیکاتور لگاریتمی ، نمایش دهنده روند حرکتی قیمت است ، که بر اساس توابع لگاریتمی و میانگین های متحرک قیمت طراحی شده است
این اندیکاتور تشکیل شده از :
یک خط پیشرو متشکل از لگاریتم طبیعی متحرک وزنی نمایی مورد استفاده درآر اس آی به طول 60 و انحراف 20 است
یک خط سیگنال متشکل از لگاریتم طبیعی میانگین متحرک نمایی با طول 90
یک خط قیمت که متشکل از لگاریتم طبیعی میانگین متحرک ساده در طول 1 که منبع آن بسته شدن قیمت است.
یک خط قیمت مخفی که متشکل از لگاریتم طبیعی میانگین متحرک ساده در طول 1 و منبع آن میانگین بالاترین و پایین ترین قیمت است
یک فضای ابری مابین خط پیشرو و خط سیگنال که که با "نمایش روند حرکت قیمت" مشخص شده و در رنگ های سبز و قرمز قابل مشاهده میباشد.
آموزش گرفتن سیگنال ازاندیکاتور نمایش روند قیمت :
حرکت خط سیگنال و شکستن خط پیشرو رو به بالا که تشکیل ابر سبز رنگ میدهد یک سیگنال خرید میباشد .
حرکت خط سیگنال و شکستن خط پیشرو رو به پایین که تشکیل ابر قرمز رنگ میدهد یک سیگنال فروش میباشد .
حرکت خط قیمت و شکستن ابر روند حرکت قیمت رو به بالا سیگنال خرید میباشد
حرکت خط قیمت و شکستن ابر روند حرکت قیمت رو به پایین سیگنال فروش میباشد.
Sentiment OscillatorPrice moves when there are more market takers than there are market makers at a certain price (i.e. price moves up when there are more market buys than limit sells and vice versa). The idea of this indicator is to show the ratio between market takers and market makers in a way that is intuitive to technical analysis methods, and hopefully revealing the overall sentiment of the market in doing so. You can use it in the same way you would other oscillators (histogram crossing zero, divergences, etc). The main difference between this and most volume-weighted indicators is that the price is divided by volume instead of multiplied by it, thus giving you a rough idea of how much "effort" it took to move the price. My hypothesis is that when more volume is needed to move the price, that means bulls and bears are not in agreement of what the "fair price" should be for an asset (e.g. if the candle closes only a bit higher than its open but there's a huge spike in volume, that tells you that a majority of the market are starting to think the price is too high and they've started selling).
Methods of Calculation
1. Price Change Per Volume
The main method this indicator uses to reveal market sentiment is by comparing price change to the volume of trades in a bar.
You will see this calculation plotted in its most basic form by ticking the "Show Bar per Bar Change/Volume" box in the inputs dialog. I personally found that the plots were too noisy and cannot be used in real time reliably due to the fact that there is not much volume at the open of a new bar. I decided to leave in the option to use this method, in case you'd like to experiment with it or get a better grasp of how the indicator works.
2. Exponential Moving Averages
In my quest to smooth out the plotted data, I experimented with exponential moving averages. Applying an EMA on the change per volume data did smooth it out a bit, but still left in a lot of noise. So I worked around it by applying the EMA to the price change first, and then dividing it by the EMA of the volume. The term I use for the result of this calculation is "Market Sentiment" (do let me know if you have a better-fitting term for it ;-)), and I have kept it as an option that you can use in the way you would use other oscillators like CMF, OBV, etc. This option is unticked by default.
3. MACD
I left "Market Sentiment" unchecked as the default option because I thought an easier way to use this indicator would be as a momentum indicator like the MACD . So that's what I turned it into! I applied another EMA on the Market Sentiment, added a slower EMA to subtract from the first, and now we have a MACD line. I added a signal line to subtract from the MACD , and the result is plotted as a histogram... ish . I used area instead of columns for plot style so you don't get confused when comparing with a regular MACD indicator, but you can always change it if an actual histogram is more your taste.
The "histogram" is the main gauge of sentiment change momentum and it is easiest to use, that is why it is the only calculation plotted by default.
Methods of Use
As I have mentioned before, you can use this as you would other oscillators.
-The easiest way to use this indicator is with the Momentum histogram, where crosses over 0 indicate increasing bullish sentiment, and crosses below 0 indicate increasing bearish sentiment. You may also spot occasional divergences with the histogram.
-For the Market Sentiment option, the easiest way to use it is to look for divergences.
-And if you use the "Price Change per Volume of Each Bar", well... I honestly don't know. I guess divergences would be apparent towards the close of a bar, but in realtime, I don't recommend you use this. Maybe if you'd like to study the market movement, looking at historical data and comparing price, volume , and Change per Volume of each bar would come in handy in a pseudo-tape-reading kind of way.
Anyway, that's my explanation of this indicator. The default values were tested on BTC/USDT (Binance) 4h with decent results. You'll have to adjust the parameters for different markets and timeframes.
I have published this as a strategy so you can test out how the indicator performs as you're tweaking the parameters.
I'm aware that the code might not be the cleanest as I have only started learning pine (and code in general) for about a month, so any suggestions to improve the script would be appreciated!
Good luck and happy trading :-)

Normalized Volatility IndicatorFrom an article by Rajesh Kayakkal:
"Early bear phase signals can help you get out of the market before it turns down. This indicator tells you how.
There are many ways to identify the trend of a financial market, the most common being the 200-day exponential moving average (Ema). When price is trending down below the 200-day Ema, the market is believed to be in a bear phase. If the market is trending up above the 200-day Ema, it is considered to be in a bull phase.
Since every indicator fails at times, I wanted to find other indicators to confirm a trend. In my quest for another indicator to determine the trend for the financial markets, I found the Cboe Volatility Index (Vix) to be a good indicator of the market direction. The Vix is calculated from the weighted average of the implied volatilities of various options on the Standard & Poor’s 500 index futures.
J. Welles Wilder’s average true range can also give an indication of the financial market trends; that is, when the market is in a bull phase, the average true range narrows, and when it is in a bear phase, the average true range expands. The normalized volatility indicator (Nvi) is based on this behavior.
Normalized volatility indicator (Nvi)
Average true range (Atr) varies depending on time. But how do we determine the phase of the financial market with Atr? Perhaps some type of ratio could give us a clue. A ratio presents a relationship of a quantity with respect to another. I did some research based on a ratio of the 64-day average true range and the end-of-day value of equity indexes such as the Standard & Poor’s 500 (Spx). I selected the 64-day period since it is close to the average number of trading days in a quarter. The ratio of the 64-day average true range and closing price does discount seasonal variations in the average true range and gives a single number that can be used to compare volatility of an instrument across many decades. I call this ratio the normalized volatility indicator.
I found an interesting correlation between Nvi and cycles of major equity market indexes. The formula for the Nvi is:
Nvi = 64 - Day average true range/End-of-day price * 100
The NVI gave advanced signals before the cyclical bear phase of SPX commenced in October 2000 and was almost on the spot with the bull phase that began in 2003 and the current secular bear market cycle, which started in November 2007."
Includes options to show inverse NVI and change the ATR length and smoothing.

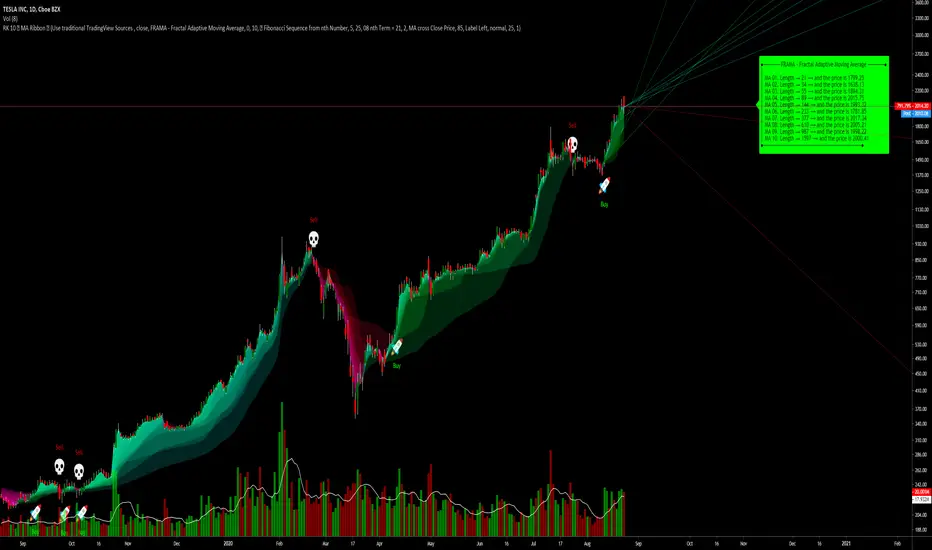
RK's 10 ∴ MA Types Ribbons (Fibonacci, Guppy and others)After some tips in my indicator
RK's 04 - Lots of MA Types Ribbon I Put some time and effort to make it better.
So, I'm sharing with you the results.
This is an up to 10 lines Moving Average Ribbon with an Auto Evaluate Length and a lots of options!!!
Type of Moving Average you can use:
SMA - Simple Moving Average
SMMA - Smoothed Moving Average
EMA - Exponential Moving Average
DEMA - Double Exponential Moving Average
TEMA - Triple Exponential Moving Average
WMA - Weighted Moving Average
HMA - Hull Moving Average
EHMA - Exponential Hull Moving Average
RMA - RSI Moving average
2PSS - Ehlers 2 Pole Super Smoother
3PSS - Ehlers 3 Pole Super Smoother
VWMA - Volume-Weighted Moving Average
ALMA - Arnaud Legoux Moving Average
STMA - Simple Triangular Moving Average
ETMA - Exponential Triangular Moving Average
LSMA - Least Squares Moving Average
ZSMA - Zero-Lag Simple Moving Average
ZEMA - Zero-Lag Exponential Moving Average
COVWMA - Coefficient of Variation Weighted Moving Average
COVWEMA - Coefficient of Variation Weighted Exponential Moving Average
FRAMA - Fractal Adaptive Moving Average
KAMA - Kaufman's Adaptive Moving Average
VIDYA - Variable Index Dynamic Average
If you want to change faster the MA type, in "Moving Average Setup:", Select "🤖 Use numbers to change MA Type", click inside the box in "🤖 Moving Average Type per Number:" and just scroll your mouse wheel. You can check what MA type you are using looking in the info panel label.
There is 4 automatic evaluate length:
Fibonacci Sequence
Arithmetic Progression
Geometric Progression
Guppy Multiple Moving Average (GMMA) without Lengths 03 and 05
And I already put a Manual Length, but I keep it inside the code, so if you want to use different lengths, just change the code, or ask me and I will put as an input.
And attending a request, this indicator can creates alerts when all the colors of the ribbons changes.
Hope you like it!
Any other good idea, just send me.
Price Action Movements by RPThis is the Indicator which will enhance finding Buying and Selling opportunity on any market.
Mostly suited for day Trading and some indicator can be used for signalling stock on longer time frame.
Indicators used to create this strategy is as follows:
- Exponential Moving Average (EMA)
- Supertrend
- Volume Weighted Average Price (VWAP)
- Exponential Moving Average of Volume Weighted Average Price (MVWAP)
- Previous Day Volume Weighted Average Price (PVWAP)
- Previous Day High, Low and Close (PDH, PDL, PDC)
- And Current Day Support and Resistance points based on Previous day Price Movement.
This will indicate where to buy and Sell with Indicator based on Following criteria,
Buy Signal given,
- When Close is above Exponential Moving Average 9
- When Close is above Exponential Moving Average 21
- RSI above 55
- Supertrend is positive
- Volume is above 300 moving Average
- Close is above Volume Weighted Average Price
Sell Signal given,
- When Close is below Exponential Moving Average 9
- When Close is below Exponential Moving Average 21
- RSI below 45
- Supertrend is negative
- Volume is above 300 moving Average
- Close is below Volume Weighted Average Price
Trades can use this Study according to their need of the Indicator.
Users can Tick the indicator which they want to add on Charts to study.
Only Exponential Moving Average indicator can be used.
Only Supertrend can be used.
Volume Weighted Average Price, Previous Day Volume Weighted Average Price, Exponential Moving Average of Volume Weighted Average Price and Previous Day High, Low and Close can be used as a particular study.
Support and Resistance can be used along with Previous Day High and Previous Day Low as a particular study.
This is multipurpose Study which will help Trading Society immensely.
Thank You.

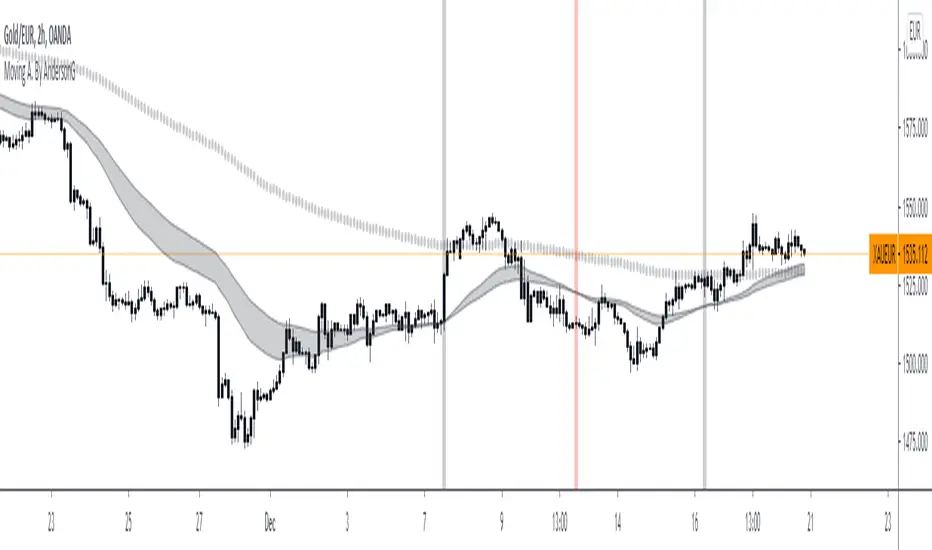
Moving A. By AndersonGA moving average (MA) is a widely used indicator in technical analysis that helps smooth out price action by filtering out the “noise” from random short-term price fluctuations.
Moving average is a trend-following, or lagging, indicator because it is based on past prices. The most common applications of moving averages are:
to identify the trend direction
to determine support and resistance levels.
The two basic and commonly used moving averages are the simple moving average ( SMA ), which is the arithmetic average of a security over a defined number of time periods, and the exponential moving average ( EMA ), which gives greater weight to more recent prices.
Source; Investopedia
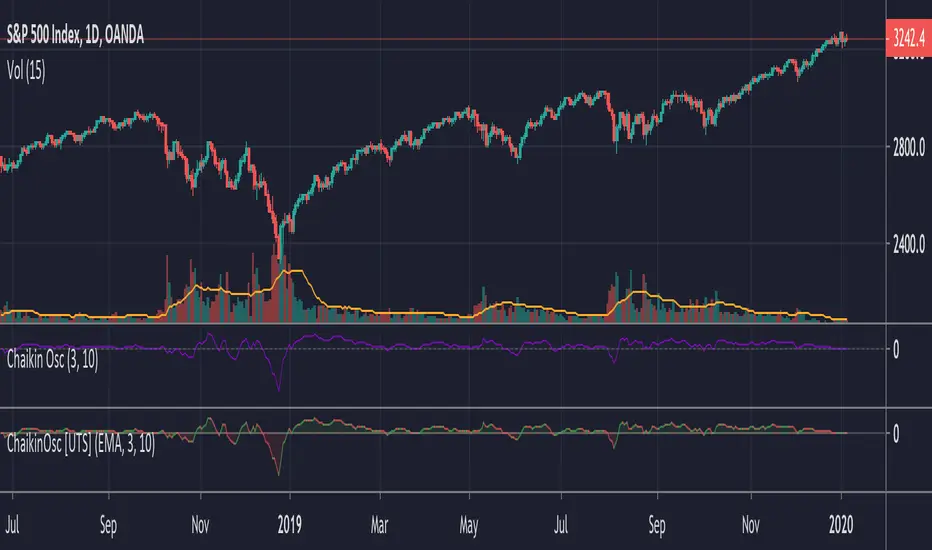
CMF Osc - Chaikin Money Flow Oscillator [UTS]The well known Chaikin Money Flow Indicator as oscillator version.
General Usage
The indicator runs both above and below zero, made to denote whether an asset is in a bullish (above zero) or bearish (below zero) trend.
It can be used to confirm trends, as well as spot possible trading signals due to divergences.
A benefit of the oscillator version is that it can produce LONG or SHORT signals on zero line cross.
Moving Averages
4 different Moving Averages are available:
EMA (Exponential Moving Average)
SMA (Simple Moving Average)
VWMA (Volume Weighted Moving Average)
WMA (Weighted Moving Average)

Chaikin Oscillator (ADL Oscillator) [UTS]The Chaikin Oscillator is basically an oscillator version of the Accumulation / Distribution Index, also known as ADL Indicator.
General Usage
The indicator runs both above and below zero, made to denote whether an asset is in a bullish (above zero) or bearish (below zero) trend.
It can be used to confirm trends, as well as spot possible trading signals due to divergences.
A benefit of the oscillator version is that it can produce LONG or SHORT signals on zero line cross.
Moving Averages
4 different Moving Averages are available:
EMA (Exponential Moving Average)
SMA (Simple Moving Average)
VWMA (Volume Weighted Moving Average)
WMA (Weighted Moving Average)
PVT Osc - Price Volume Trend Oscillator [UTS]The oscillator version of the Price Volume Trend indicator (PVT) can be considered as a leading indicator of future price movements. The PVT Indicator is similar to the On Balance Volume indicator as it is also used to measure the strength of a trend.
The difference between the OBV and the PVT is that where the OBV adds all volumes when price achieves higher daily closes and subtracts them when price registers a lower daily close, the PVT adds or subtracts only a portion of the volume from the cumulative total in relation to a percentage change in price.
The general market consensus is that this difference enables the PVT to more accurately represent money flow volumes in and out of a stock or commodity.
The PVT has been designed so that it is capable of forecasting directional changes in price. For instance, if the price of a stock is rising and the PVT begins to fall, then this is indicative that a price reversal could occur very soon.
The general consensus is that the PVT is more accurate at detecting new trading opportunities than the OBV because of the differences in their construction. The OBV is designed so that it adds the same amount of volume whether the price closes upwards by just a small fraction or by multiples of its day opening value. On the other hand, the PVT adds volume proportional to the amount the price closed higher.
General Usage
Plain old PVT can be used to confirm trends, as well as spot possible trading signals due to divergences.
A benefit of the oscillator version is that it can produce LONG or SHORT signals on zero line cross.
Or controversy, disallow LONG trades in bearish territory and disallow SHORT trades in bullish territory.
Moving Averages
4 different Moving Averages are available:
EMA (Exponential Moving Average)
SMA (Simple Moving Average)
VWMA (Volume Weighted Moving Average)
WMA (Weighted Moving Average)

OBV Osc - On Balance Volume Oscillator [UTS]The oscillator version of the well known On Balance Volume Indicator (OBV).
General Usage
Plain old OBV can be used to confirm trends, as well as spot possible trading signals due to divergences.
A benefit of the oscillator version is that it can produce LONG or SHORT signals on zero line cross.
Moving Averages
4 different Moving Averages are available:
EMA (Exponential Moving Average)
SMA (Simple Moving Average)
VWMA (Volume Weighted Moving Average)
WMA (Weighted Moving Average)
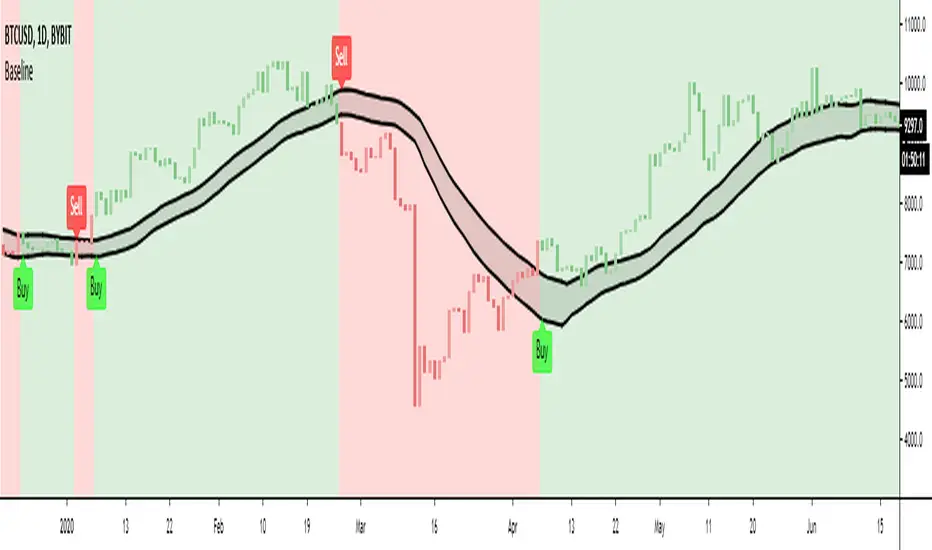
Baseline - evoPlots the high and low of your chosen moving average.
Options are:
SMA = Simple Moving Average
EMA = Exponential Moving Average
WMA = Weighted Moving Average
HMA = Hull Moving Average
VWMA = Volume Weighted Moving Average
RMA = Exponetial Weighted Moving Average
ALMA = Arnaud Legoux Moving Average
Unbox "Use Current Timeframe" to use chosen timeframe below
I mainly use this to get in and out of the market for futures trading, to reduce fake outs of having just one moving average line.
Let me know if you like it..
Inspired from LazyBear's EMAenvelope :)
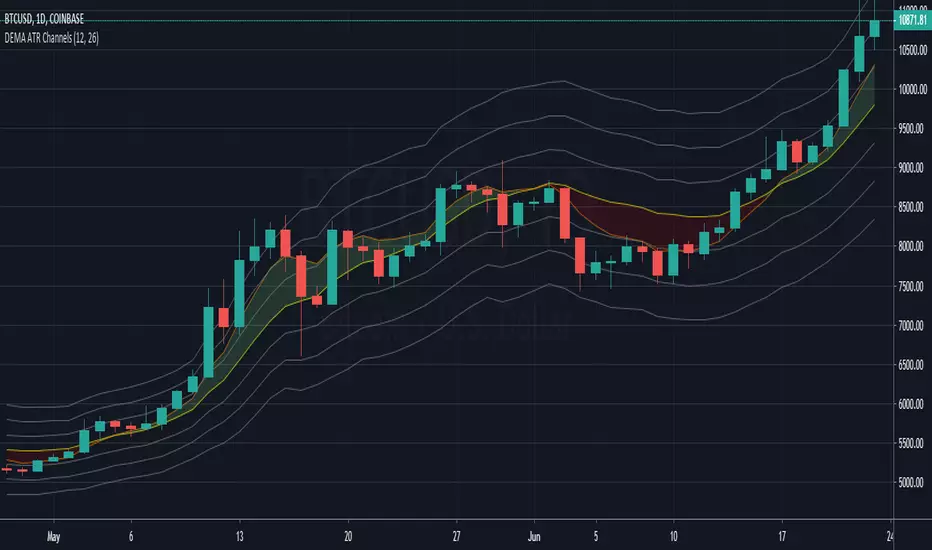
DEMA ATR Channels - New IndicatorA Double Exponential Moving Average (DEMA) with three sets of channel lines each one Average True Range (ATR) apart, above and below the DEMA.
Similar to my "ATR Channels" indicator, but using a DEMA instead of an EMA for the base. In addition, this indicator also plots a fast DEMA as well as a fill between the two. Fully customizable, you can toggle both DEMAs, the fill, and each set of ATR Channels.
ATR channel idea from Kerry Lovvorn as mentioned in Elder's "New Trading for a Living", page 93: "Kerry Lovvorn likes to plot 3 sets of lines around a moving average: at one, two, and three ATRs above and below an EMA . These can be used for setting up entry points and stops, as well as profit targets."