Penunjuk Pine Script®
Cari dalam skrip untuk "Exponential Moving Average"

2x Multi Time Frame Exponential Moving Average2x Multi Time Frame Exponential Moving Average
Allows you to see longer EMA while viewing shorter time frames.
Penunjuk Pine Script®

2x Multi Time Frame Exponential Moving AverageMulti Time Frame Exponential Moving Average, two of em.
Select EMA period that remains static no matter what time-frame you're viewing.
Great for showing the daily EMA while viewing smaller time frames.
Penunjuk Pine Script®

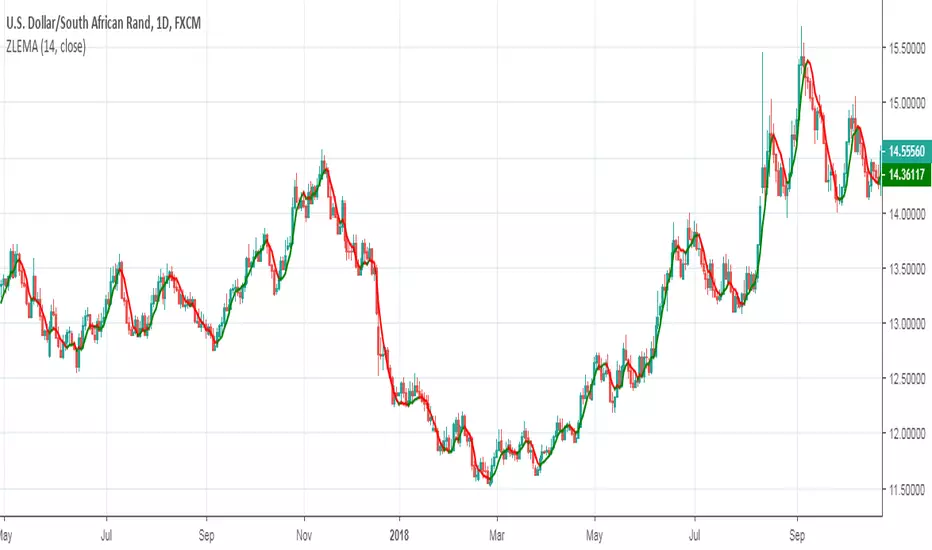
Zero Lag Exponential Moving AverageZero Lag Exponential Moving Average indicator script based on the original version by John Ehlers and Ric Way
Penunjuk Pine Script®
Regularized Exponential Moving AverageRegularized Exponential Moving Average indicator script based on the original version by Chris Satchwell
Penunjuk Pine Script®

EMA 9/15/65/200exponential moving average (EMA) at 9, 15, 65 and 200 days
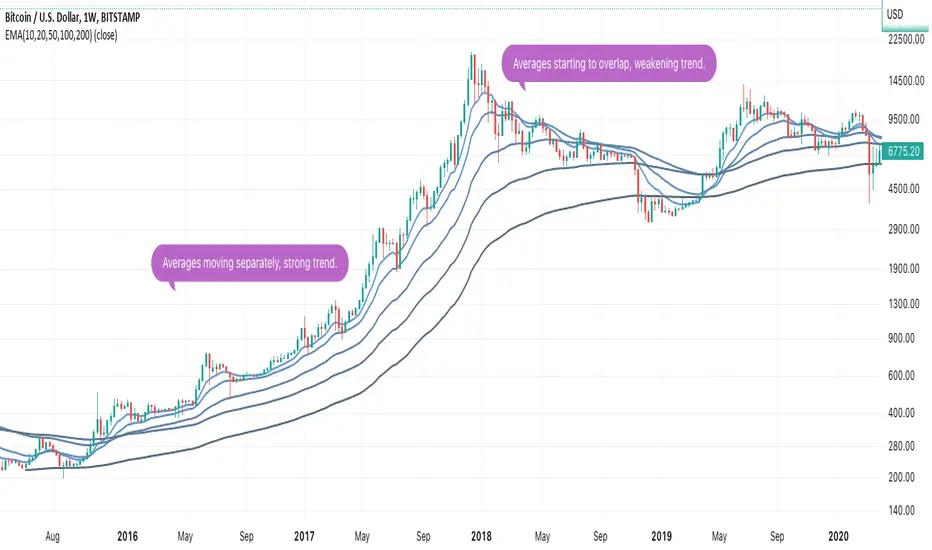
An exponential moving average (EMA) is a type of moving average (MA) that places a greater weight and significance on the most recent data points. The exponential moving average is also referred to as the exponentially weighted moving average. An exponentially weighted moving average reacts more significantly to recent price changes than a simple moving average (SMA), which applies an equal weight to all observations in the period.
Penunjuk Pine Script®

Triple Cross of DeathExponential moving averages in red of 4 and 16, exponential moving average of 40 in orange and simple moving average of 200 in yellow to confirm the triple crossing of 4, 16 and 40.
Taken from Lions against gazelles by Jose Luis Carpatos.
Penunjuk Pine Script®

Exponential Moving Average + ATR MTF [YSFX]Description:
This indicator is a reupload of a previously published EMA + ATR tool, updated and enhanced after a house rule violation to provide additional features and a cleaner, more versatile experience for traders.
It combines trend analysis and volatility measurement into one intuitive tool, allowing traders to visualize market direction, dynamic support and resistance, and adaptive risk levels—all in a clean, minimal interface.
The indicator calculates a customizable moving average (MA) type—EMA, SMA, WMA, HMA, RMA, DEMA, TEMA, VWMA, LSMA, or KAMA—and surrounds it with ATR-based bands that expand and contract with market volatility. This creates a dynamic envelope around price, helping traders identify potential breakouts, pullbacks, or high-probability entry/exit zones.
Advanced Features:
Multiple MA types: Supports all major moving averages, including advanced options like KAMA, DEMA, and TEMA.
KAMA customization: Adjustable fast and slow lengths for precise tuning.
Dual timeframe support: Optionally use separate timeframes for the MA and ATR, or a global timeframe for both.
Dynamic ATR bands: Automatically adjust to market volatility, useful for setting adaptive stop-loss levels.
Optional fill: Shade the area between upper and lower ATR bands for a clear visual representation of volatility.
Flexible for all markets: Works across any timeframe or asset class.
Who It’s For:
This indicator is ideal for trend-following traders, swing traders, and volatility-focused analysts who want to:
Confirm trend direction while accounting for volatility
Identify high-probability trade entries and exits
Implement dynamic, ATR-based stop-loss strategies
Keep charts clean and uncluttered while still capturing key market information
This reuploaded version ensures compliance with platform rules while offering enhanced flexibility and clarity for modern trading workflows.
Penunjuk Pine Script®

Penunjuk Pine Script®

Penunjuk Pine Script®
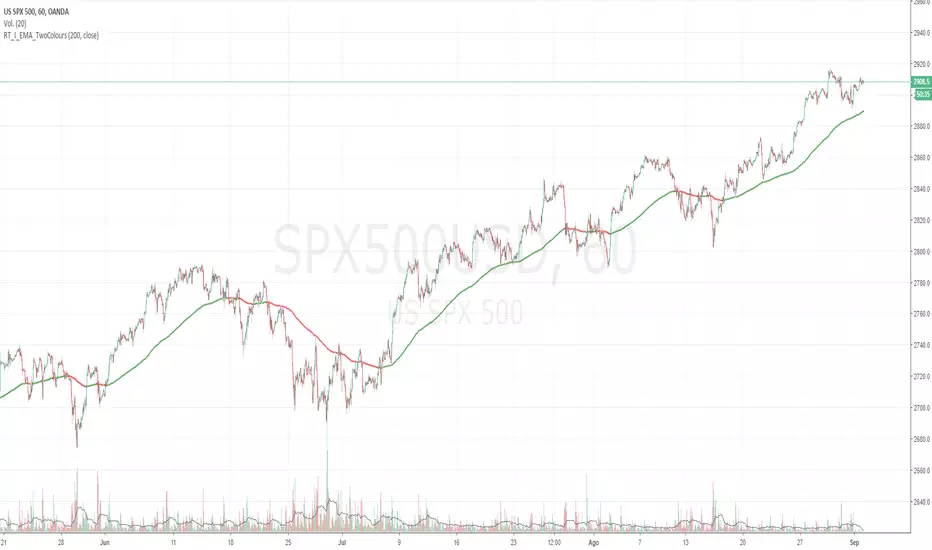
Moving average Two ColoursExponential moving average of 200 periods, which changes color according to the position of the candles.
(200 periods: default configuration Option to change periods allowed)
If the candles are on the EMA, this will have green color, otherwise red color (colors, thickness configurable).
**********************************************************************************************************************************************
Descripción en Español:
Media móvil Exponencial de 200 periodos, la cuál cambia de color según posición de las velas.
(200 periodos: configuración default. Opción de cambio de periodos permitida)
Si las velas están sobre la EMA , esta tendrá color verde, caso contrario color rojo (colores, grosor configurables).
Penunjuk Pine Script®
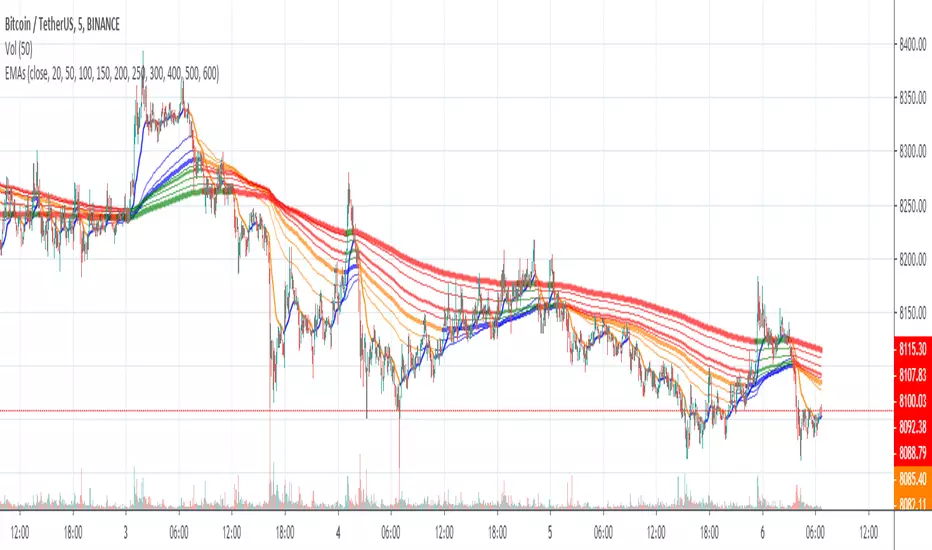
Exponential Moving AveragesEMA of many time units.
Time units include 5, 10, 20, 60, 120, 200.
Enjoy!
Penunjuk Pine Script®

EMA 9, 20, 50Exponential Moving Averages of 9, 20, and 50. Used to gauge buy and sell opportunities in trending markets.
Penunjuk Pine Script®
Penunjuk Pine Script®

exponential Moving Averagesall in one ema for a select set i use 12/26 then the longer ones 50,100,200
Penunjuk Pine Script®

6 EMA Crypto InvestidorExponential Moving Averages - 6 EMA Crypto Investidor
Indicator developed to facilitate the use of 6 EMAs in a single indicator.
EMAs: 9, 13, 21, 55, 100 and 200 Periods
Developed by Diego do Youtube Channel Crypto Investor
Penunjuk Pine Script®

EMAs Crypto InvestidorExponential Moving Averages - EMAs Crypto Investor
Indicator developed to facilitate the use of 5 EMAs in a single indicator.
EMAs: 17, 34, 72, 100 and 200 Periods
Developed by Diego do Youtube Channel Crypto Investor
Penunjuk Pine Script®

EMA FIBO 4HOURSExponential Moving Averages of 4 Fibonacci Levels((55,144,233,377)*6) in 4 Hour Timezone
Penunjuk Pine Script®

Exponential Moving Average (Set of 3) [Krypt] + 13/34 EMAsI took Krypt's script and essentially added on to it.
the 20/50/100/200 EMAs should be used together as support and resistance as normal.
Wait for price to break 200 EMA
Wait for 50 EMA to cross 200 EMA
Wait for pullback to 50 EMA to open position
20 and 100 EMAs are for extra information about moving support and resistance
and 13/34 EMAs should be used in conjunction
When 13 EMA crosses 34 EMA, open position
When price gets far from 13/34, close position (because price will attempt to revert back to mean)
This is better for scalping and swing trades than the 20/50/100/200 setup.
Twitter: @AzorAhai06
Penunjuk Pine Script®

Penunjuk Pine Script®

Penunjuk Pine Script®
Penunjuk Pine Script®

Penunjuk Pine Script®
