Super CCI By Baljit AujlaThe indicator you've shared is a custom CCI (Commodity Channel Index) with multiple types of Moving Averages (MA) and Divergence Detection. It is designed to help traders identify trends and reversals by combining the CCI with various MAs and detecting different types of divergences between the price and the CCI.
Key Components of the Indicator:
CCI (Commodity Channel Index):
The CCI is an oscillator that measures the deviation of the price from its average price over a specific period. It helps identify overbought and oversold conditions and the strength of a trend.
The CCI is calculated by subtracting a moving average (SMA) from the price and dividing by the average deviation from the SMA. The CCI values fluctuate above and below a zero centerline.
Multiple Moving Averages (MA):
The indicator allows you to choose from a variety of moving averages to smooth the CCI line and identify trend direction or support/resistance levels. The available types of MAs include:
SMA (Simple Moving Average)
EMA (Exponential Moving Average)
WMA (Weighted Moving Average)
HMA (Hull Moving Average)
RMA (Running Moving Average)
SMMA (Smoothed Moving Average)
TEMA (Triple Exponential Moving Average)
DEMA (Double Exponential Moving Average)
VWMA (Volume-Weighted Moving Average)
ZLEMA (Zero-Lag Exponential Moving Average)
You can select the type of MA to use with a specified length to help identify the trend direction or smooth out the CCI.
Divergence Detection:
The indicator includes a divergence detection mechanism to identify potential trend reversals. Divergences occur when the price and an oscillator like the CCI move in opposite directions, signaling a potential change in price momentum.
Four types of divergences are detected:
Bullish Divergence: Occurs when the price makes a lower low, but the CCI makes a higher low. This indicates a potential reversal to the upside.
Bearish Divergence: Occurs when the price makes a higher high, but the CCI makes a lower high. This indicates a potential reversal to the downside.
Hidden Bullish Divergence: Occurs when the price makes a higher low, but the CCI makes a lower low. This suggests a continuation of the uptrend.
Hidden Bearish Divergence: Occurs when the price makes a lower high, but the CCI makes a higher high. This suggests a continuation of the downtrend.
Each type of divergence is marked on the chart with arrows and labels to alert traders to potential trading opportunities. The labels include the divergence type (e.g., "Bull Div" for Bullish Divergence) and have customizable text colors.
Visual Representation:
The CCI and its associated moving average are plotted on the indicator panel below the price chart. The CCI is plotted as a line, and its color changes depending on whether it is above or below the moving average:
Green when the CCI is above the MA (indicating bullish momentum).
Red when the CCI is below the MA (indicating bearish momentum).
Horizontal lines are drawn at specific levels to help identify key CCI thresholds:
200 and -200 levels indicate extreme overbought or oversold conditions.
75 and -75 levels represent less extreme levels of overbought or oversold conditions.
The 0 level acts as a neutral or baseline level.
A background color fill between the 75 and -75 levels helps highlight the neutral zone.
Customization Options:
CCI Length: You can customize the length of the CCI, which determines the period over which the CCI is calculated.
MA Length: The length of the moving average applied to the CCI can also be adjusted.
MA Type: Choose from a variety of moving averages (SMA, EMA, WMA, etc.) to smooth the CCI.
Divergence Detection: The indicator automatically detects the four types of divergences (bullish, bearish, hidden bullish, hidden bearish) and visually marks them on the chart.
How to Use the Indicator:
Trend Identification: When the CCI is above the selected moving average, it suggests bullish momentum. When the CCI is below the moving average, it suggests bearish momentum.
Overbought/Oversold Conditions: The CCI values above 100 or below -100 indicate overbought and oversold conditions, respectively.
Divergence Analysis: The detection of bullish or bearish divergences can signal potential trend reversals. Hidden divergences may suggest trend continuation.
Trading Signals: You can use the divergence markers (arrows and labels) as potential buy or sell signals, depending on whether the divergence is bullish or bearish.
Practical Application:
This indicator is useful for traders who want to:
Combine the CCI with different moving averages for trend-following strategies.
Identify overbought and oversold conditions using the CCI.
Use divergence detection to anticipate potential trend reversals or continuations.
Have a highly customizable tool for various trading strategies, including trend trading, reversal trading, and divergence-based trading.
Overall, this is a comprehensive tool that combines multiple technical analysis techniques (CCI, moving averages, and divergence) in a single indicator, providing traders with a robust way to analyze price action and spot potential trading opportunities.
Cari dalam skrip untuk "Exponential"
Pulse DPO: Major Cycle Tops and Bottoms█ OVERVIEW
Pulse DPO is an oscillator designed to highlight Major Cycle Tops and Bottoms .
It works on any market driven by cycles. It operates by removing the short-term noise from the price action and focuses on the market's cyclical nature.
This indicator uses a Normalized version of the Detrended Price Oscillator (DPO) on a 0-100 scale, making it easier to identify major tops and bottoms.
Credit: The DPO was first developed by William Blau in 1991.
█ HOW TO READ IT
Pulse DPO oscillates in the range between 0 and 100. A value in the upper section signals an OverBought (OB) condition, while a value in the lower section signals an OverSold (OS) condition.
Generally, the triggering of OB and OS conditions don't necessarily translate into swing tops and bottoms, but rather suggest caution on approaching a market that might be overextended.
Nevertheless, this indicator has been customized to trigger the signal only during remarkable top and bottom events.
I suggest using it on the Daily Time Frame , but you're free to experiment with this indicator on other time frames.
The indicator has Built-in Alerts to signal the crossing of the Thresholds. Please don't act on an isolated signal, but rather integrate it to work in conjunction with the indicators present in your Trading Plan.
█ OB SIGNAL ON: ENTERING OVERBOUGHT CONDITION
When Pulse DPO crosses Above the Top Threshold it Triggers ON the OB signal. At this point the oscillator line shifts to OB color.
When Pulse DPO enters the OB Zone, please beware! In this Area the Major Players usually become Active Sellers to the Public. While the OB signal is On, it might be wise to Consider Selling a portion or the whole Long Position.
Please note that even though this indicator aims to focus on major tops and bottoms, a strong trending market might trigger the OB signal and stay with it for a long time. That's especially true on young markets and on bubble-mode markets.
█ OB SIGNAL OFF: EXITING OVERBOUGHT CONDITION
When Pulse DPO crosses Below the Top Threshold it Triggers OFF the OB signal. At this point the oscillator line shifts to its normal color.
When Pulse DPO exits the OB Zone, please beware because a Major Top might just have occurred. In this Area the Major Players usually become Aggressive Sellers. They might wind up any remaining Long Positions and Open new Short Positions.
This might be a good area to Open Shorts or to Close/Reverse any remaining Long Position. Whatever you choose to do, it's usually best to act quickly because the market is prone to enter into panic mode.
█ OS SIGNAL ON: ENTERING OVERSOLD CONDITION
When Pulse DPO crosses Below the Bottom Threshold it Triggers ON the OS signal. At this point the oscillator line shifts to OS color.
When Pulse DPO enters the OS Zone, please beware because in this Area the Major Players usually become Active Buyers accumulating Long Positions from the desperate Public.
While the OS signal is On, it might be wise to Consider becoming a Buyer or to implement a Dollar-Cost Averaging (DCA) Strategy to build a Long Position towards the next Cycle. In contrast to the tops, the OS state usually takes longer to resolve a major bottom.
█ OS SIGNAL OFF: EXITING OVERSOLD CONDITION
When Pulse DPO crosses Above the Bottom Threshold it Triggers OFF the OS signal. At this point the oscillator line shifts to its normal color.
When Pulse DPO exits the OS Zone, please beware because a Major Bottom might already be in place. In this Area the Major Players become Aggresive Buyers. They might wind up any remaining Short Positions and Open new Long Positions.
This might be a good area to Open Longs or to Close/Reverse any remaining Short Positions.
█ WHY WOULD YOU BE INTERESTED IN THIS INDICATOR?
This indicator is built over a solid foundation capable of signaling Major Cycle Tops and Bottoms across many markets. Let's see some examples:
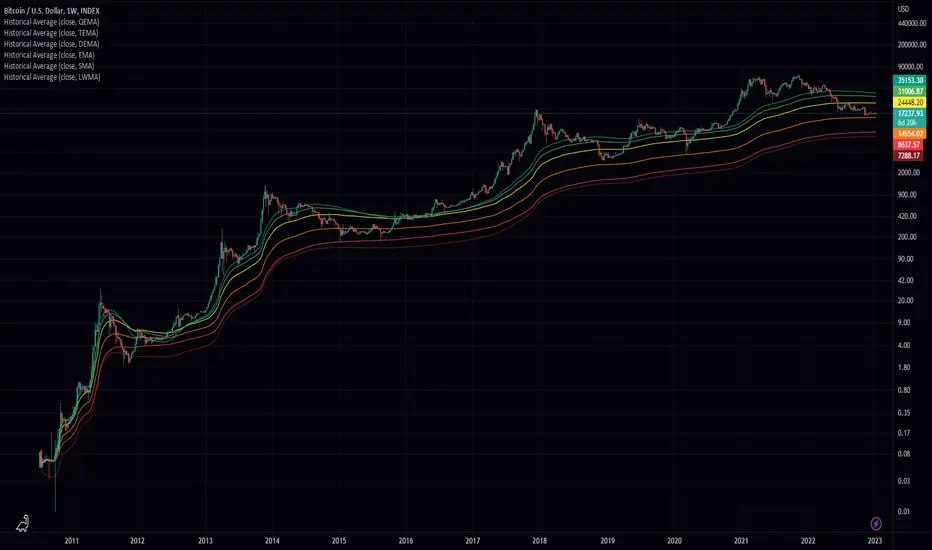
Early Bitcoin Years: From 0 to 1242
This chart is in logarithmic mode in order to properly display various exponential cycles. Pulse DPO is properly signaling the major early highs from 9-Jun-2011 at 31.50, to the next one on 9-Apr-2013 at 240 and the epic top from 29-Nov-2013 at 1242.
Due to the massive price movements, the OB condition stays pinned during most of the exponential price action. But as you can see, the OB condition quickly vanishes once the Cycle Top has been reached. As the market matures, the OB condition becomes more exceptional and triggers much closer from the Cycle Top.
With regards to Cycle Bottoms, the early bottom of 2 after having peaked at 31.50 doesn’t get captured by the indicator. That is the only cycle bottom that escapes the Pulse DPO when the bottom threshold is set at a value of 5. In that event, the oscillator low reached 6.95.
Bitcoin Adoption Spreading: From 257 to 73k
This chart is in logarithmic mode in order to properly display various exponential cycles. Pulse DPO is properly signaling all the major highs from 17-Dec-2017 at 19k, to the next one on 14-Apr-2021 at 64k and the most recent top from 9-Nov-2021 at 68k.
During the massive run of 2017, the OB condition still stayed triggered for a few weeks on each swing top. But on the next cycles it started to signal only for a few days before each swing top actually happened. The OB condition during the last cycle top triggered only for 3 days. Therefore the signal grows in focus as the market matures.
At the time of publishing this indicator, Bitcoin printed a new All Time High (ATH) on 13-Mar-2024 at 73k. That run didn’t trigger the OB condition. Therefore, if the indicator is correct the Bitcoin market still has some way to grow during the next months.
With regards to Cycle Bottoms, the bottom of 3k after having peaked at19k got captured within the wide OS zone. The bottom of 15k after having peaked at 68k got captured too within the OS accumulation area.
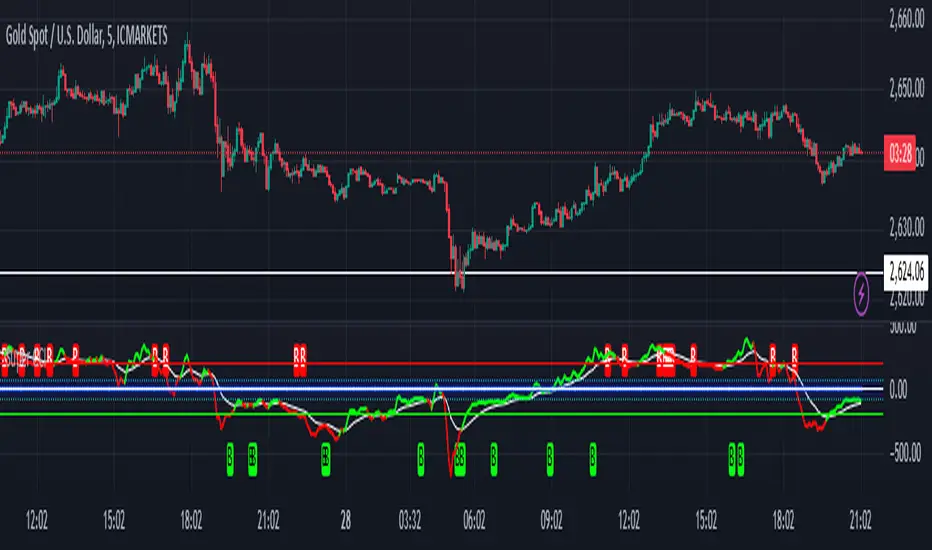
Gold
Pulse DPO behaves surprisingly well on a long standing market such as Gold. Moving back to the 197x years it’s been signaling most Cycle Tops and Bottoms with precision. During the last cycle, it shows topping at 2k and bottoming at 1.6k.
The current price action is signaling OB condition in the range of 2.5k to 2.7k. Looking at past cycles, it tends to trigger on and off at multiple swing tops until reaching the final cycle top. Therefore this might indicate the first wave within a potential gold run.
Oil
On the Oil market, we can see that most of the cycle tops and bottoms since the 80s got signaled. The only exception being the low from 2020 which didn’t trigger.
EURUSD
On Forex markets the Pulse DPO also behaves as expected. Looking back at EURUSD we can see the marketing triggering OB and OS conditions during major cycle tops and bottoms from recent times until the 80s.
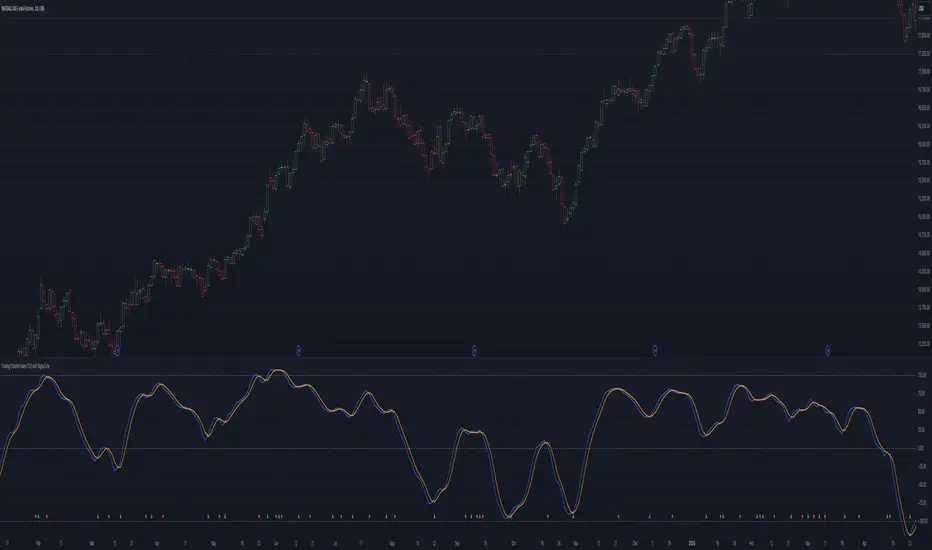
S&P 500
On the S&P 500 the Pulse DPO catched the lows from 2016 and 2020. Looking at present price action, the recent ATH didn’t trigger the OB condition. Therefore, the indicator is allowing room for another leg up during the next months.
Amazon
On the Amazon chart the Pulse DPO is mirroring pretty accurately the major swings. Scrolling back to the early 2000s, this chart resembles early exponential swings in the crypto space.
Tesla
Moving onto a younger tech stock, Pulse DPO captures pretty accurately the major tops and bottoms. The chart is shown in logarithmic scale to better display the magnitude of the moves.
█ SETTINGS
This indicator is ideal for identifying major market turning points while filtering out short-term noise. You are free to adjust the parameters to align with your preferred trading style.
Parameters : This section allows you to customize any of the Parameters that shape the Oscillator.
Oscillator Length: Defines the period for calculating the Oscillator.
Offset: Shifts the oscillator calculation by a certain number of periods, which is typically half the Oscillator Length.
Lookback Period: Specifies how many bars to look back to find tops and bottoms for normalization.
Smoothing Length: Determines the length of the moving average used to smooth the oscillator.
Thresholds : This section allows you to customize the Thresholds that trigger the OB and OS conditions.
Top: Defines the value of the Top Threshold.
Bottom: Defines the value of the Bottom Threshold.

Ichimoku Wave Oscillator with Custom MAIchimoku Wave Oscillator with Custom MA - Pine Script Description
This script uses various types of moving averages (MA) to implement the concept of Ichimoku wave theory for wave analysis. The user can select from SMA, EMA, WMA, TEMA, SMMA to visualize the difference between short-term, medium-term, and long-term waves, while identifying potential buy and sell signals at crossover points.
Key Features:
MA Type Selection:
The user can select from SMA (Simple Moving Average), EMA (Exponential Moving Average), WMA (Weighted Moving Average), TEMA (Triple Exponential Moving Average), and SMMA (Smoothed Moving Average) to calculate the waves. This script is unique in that it combines TEMA and SMMA, distinguishing it from other simple moving average-based indicators.
TEMA (Triple Exponential Moving Average): Best suited for capturing short-term trends with quick responsiveness.
SMMA (Smoothed Moving Average): Useful for identifying long-term trends with minimal noise, providing more stable signals.
Wave Calculations:
The script calculates three waves: Wave 9-17, Wave 17-26, and Wave 9-26, each of which analyzes different time horizons.
Wave 9-17 (blue): Primarily used for analyzing short-term trends, ideal for detecting quick changes.
Wave 17-26 (red): Used to analyze medium-term trends, providing a more stable market direction.
Wave 9-26 (green): Represents long-term trends, suitable for understanding broader trend shifts.
Baseline (0 Line):
Each wave is visualized around the 0 line, where waves above the line indicate an uptrend and waves below the line indicate a downtrend. This allows for easy identification of trend reversals.
Crossover Signals:
CrossUp: When Wave 9-17 (short-term wave) crosses Wave 17-26 (medium-term wave) upward, it is considered a buy signal, indicating a potential upward trend shift.
CrossDown: When Wave 9-17 (short-term wave) crosses Wave 17-26 downward, it is considered a sell signal, indicating a potential downward trend shift.
Background Color for Signal:
The script visually highlights the signals with background colors. When a buy signal occurs, the background turns green, and when a sell signal occurs, the background turns red. This makes it easier to spot reversal points.
Calculation Method:
The script calculates the difference between moving averages to display the wave oscillation. Wave 9-17, Wave 17-26, and Wave 9-26 represent the difference between the moving averages for different time periods, allowing for analysis of short-term, medium-term, and long-term trends.
Wave 9-17 = MA(9) - MA(17): Represents the difference between the short-term moving averages.
Wave 17-26 = MA(17) - MA(26): Represents the difference between medium-term moving averages.
Wave 9-26 = MA(9) - MA(26): Provides insight into the long-term trend.
This calculation method effectively visualizes the oscillation of waves and helps identify trend reversals at crossover points.
Uniqueness of the Script:
Unlike other moving average-based indicators, this script combines TEMA (Triple Exponential Moving Average) and SMMA (Smoothed Moving Average) to capture both short-term sensitivity and long-term stability in trends. This duality makes the script more versatile for different market conditions.
TEMA is ideal for short-term traders who need quick signals, while SMMA is useful for long-term investors seeking stability and noise reduction. By combining these two, this script provides a more refined analysis of trend changes across various timeframes.
How to Use:
This script is effective for trend analysis and reversal detection. By visualizing the crossover points between the waves, users can spot potential buy and sell signals to make more informed trading decisions.
Scalping strategies can rely on Wave 9-17 to detect quick trend changes, while those looking for medium-term trends can analyze signals from Wave 17-26.
For a broader market overview, Wave 9-26 helps users understand the long-term market trend.
This script is built on the concept of wave theory to anticipate trend changes, making it suitable for various timeframes and strategies. The user can tailor the characteristics of the waves by selecting different MA types, allowing for flexible application across different trading strategies.
Ichimoku Wave Oscillator with Custom MA - Pine Script 설명
이 스크립트는 다양한 이동 평균(MA) 유형을 활용하여 일목 파동론의 개념을 기반으로 파동 분석을 시도하는 지표입니다. 사용자는 SMA, EMA, WMA, TEMA, SMMA 중 원하는 이동 평균을 선택할 수 있으며, 이를 통해 단기, 중기, 장기 파동 간의 차이를 시각화하고, 교차점에서 상승 및 하락 신호를 포착할 수 있습니다.
주요 기능:
이동 평균(MA) 유형 선택:
사용자는 SMA(단순 이동 평균), EMA(지수 이동 평균), WMA(가중 이동 평균), TEMA(삼중 지수 이동 평균), SMMA(평활 이동 평균) 중 하나를 선택하여 파동을 계산할 수 있습니다. 이 스크립트는 TEMA와 SMMA의 독창적인 조합을 통해 기존의 단순한 이동 평균 지표와 차별화됩니다.
TEMA(삼중 지수 이동 평균): 빠른 반응으로 단기 트렌드를 포착하는 데 적합합니다.
SMMA(평활 이동 평균): 장기적인 추세를 파악하는 데 유용하며, 노이즈를 최소화하여 안정적인 신호를 제공합니다.
파동(Wave) 계산:
이 스크립트는 Wave 9-17, Wave 17-26, Wave 9-26의 세 가지 파동을 계산하여 각각 단기, 중기, 장기 추세를 분석합니다.
Wave 9-17 (파란색): 주로 단기 추세를 분석하는 데 사용되며, 빠른 추세 변화를 포착하는 데 유용합니다.
Wave 17-26 (빨간색): 중기 추세를 분석하는 데 사용되며, 좀 더 안정적인 시장 흐름을 보여줍니다.
Wave 9-26 (녹색): 장기 추세를 나타내며, 큰 흐름의 방향성을 파악하는 데 적합합니다.
기준선(0 라인):
각 파동은 0 라인을 기준으로 변동성을 시각화합니다. 0 위에 있는 파동은 상승세, 0 아래에 있는 파동은 하락세를 나타내며, 이를 통해 추세의 전환을 쉽게 확인할 수 있습니다.
파동 교차 신호:
CrossUp: Wave 9-17(단기 파동)이 Wave 17-26(중기 파동)을 상향 교차할 때, 상승 신호로 간주됩니다. 이는 단기적인 추세 변화가 발생할 수 있음을 의미합니다.
CrossDown: Wave 9-17(단기 파동)이 Wave 17-26(중기 파동)을 하향 교차할 때, 하락 신호로 해석됩니다. 이는 시장이 약세로 돌아설 가능성을 나타냅니다.
배경 색상 표시:
교차 신호가 발생할 때, 상승 신호는 녹색 배경, 하락 신호는 빨간색 배경으로 시각적으로 강조되어 사용자가 신호를 쉽게 인식할 수 있습니다.
계산 방식:
이 스크립트는 이동 평균 간의 차이를 계산하여 각 파동의 변동성을 나타냅니다. Wave 9-17, Wave 17-26, Wave 9-26은 각각 설정된 주기의 이동 평균(MA)의 차이를 통해, 시장의 단기, 중기, 장기 추세 변화를 시각적으로 표현합니다.
Wave 9-17 = MA(9) - MA(17): 단기 추세의 차이를 나타냅니다.
Wave 17-26 = MA(17) - MA(26): 중기 추세의 차이를 나타냅니다.
Wave 9-26 = MA(9) - MA(26): 장기적인 추세 방향을 파악할 수 있습니다.
이러한 계산 방식은 파동의 변동성을 파악하는 데 유용하며, 추세의 교차점을 통해 상승/하락 신호를 잡아냅니다.
스크립트의 독창성:
이 스크립트는 기존의 이동 평균 기반 지표들과 달리, TEMA(삼중 지수 이동 평균)와 SMMA(평활 이동 평균)을 함께 사용하여 짧은 주기와 긴 주기의 트렌드를 동시에 파악할 수 있도록 설계되었습니다. 이를 통해 단기 트렌드의 민감한 변화와 장기 트렌드의 안정성을 모두 반영합니다.
TEMA는 단기 트레이더에게 빠르고 민첩한 신호를 제공하며, SMMA는 장기 투자자에게 보다 안정적이고 긴 호흡의 트렌드를 파악하는 데 유리합니다. 두 지표의 결합으로, 다양한 시장 환경에서 추세의 변화를 더 정교하게 분석할 수 있습니다.
사용 방법:
이 스크립트는 추세 분석과 변곡점 포착에 효과적입니다. 각 파동 간의 교차점을 시각적으로 확인하고, 상승 또는 하락 신호를 포착하여 매매 시점 결정을 도울 수 있습니다.
스캘핑 전략에서는 Wave 9-17을 주로 참고하여 빠르게 추세 변화를 잡아내고, 중기 추세를 참고하고 싶은 경우 Wave 17-26을 사용해 신호를 분석할 수 있습니다.
장기적인 시장 흐름을 파악하고자 할 때는 Wave 9-26을 통해 큰 트렌드를 확인할 수 있습니다.
이 스크립트는 파동 이론의 개념을 기반으로 시장의 추세 변화를 예측하는 데 유용하며, 다양한 시간대와 전략에 맞추어 사용할 수 있습니다. 특히, 사용자가 선택한 MA 유형에 따라 파동의 특성을 변화시킬 수 있어, 여러 매매 전략에 유연하게 대응할 수 있습니다.

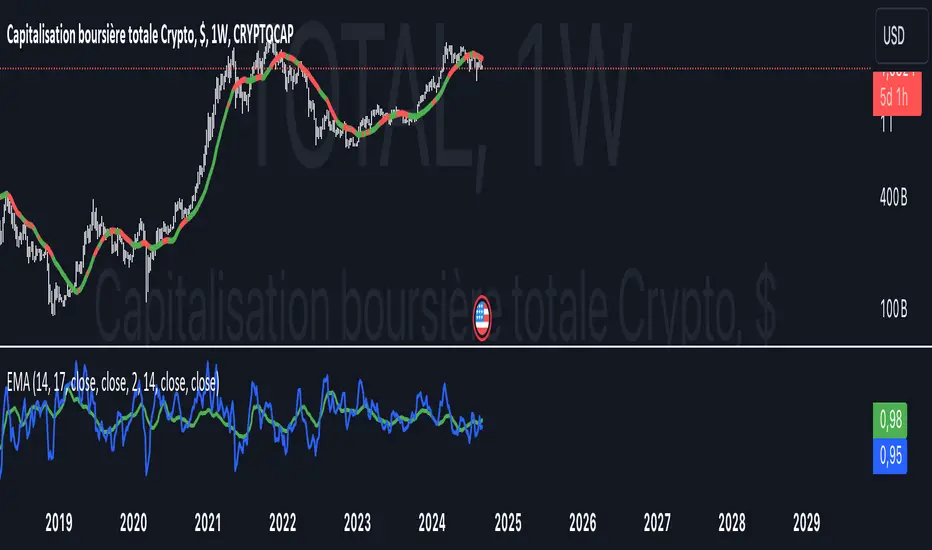
COMBINED EMA & SMA + DOUBLE DEMA, $TOTAL 1W / 5D -- Ruslan CRYPTOCAP:TOTAL
This Pine Script indicator, **"EMAS"**, provides an enhanced visualization of multiple types of moving averages, including both **Exponential Moving Averages (EMA)**, **Simple Moving Averages (SMA)**, and **Double Exponential Moving Averages (DEMA)**. It allows the user to observe the relationship between these different types of moving averages and apply regime-based coloring to price bars based on the comparison between the EMAs and DEMAs.
#### Key Features:
1. **EMA & SMA:**
- **EMA (Exponential Moving Average):** Calculated using a customizable lookback period (default 17), the EMA places greater weight on more recent prices, making it react faster to price changes.
- **SMA (Simple Moving Average):** Uses an equal-weighted average over a customizable lookback period (default 14), providing a slower-moving average compared to the EMA.
2. **DEMA (Double Exponential Moving Average):**
- Two separate DEMA lines are plotted using different lookback periods (default 2 and 14). The DEMA is a smoother and faster-responding version of the EMA, intended to reduce lag while retaining trend-following characteristics.
3. **Combined Signals:**
- The script calculates ratios between EMA/SMA (`comb`) and DEMA1/DEMA2 (`combd`) to generate a **regime-based bar coloring system**:
- If `combd > comb`: The bars are colored **green**, indicating that DEMAs are outperforming the EMAs, potentially signaling a stronger trend or momentum.
- If `comb > combd`: The bars are colored **red**, suggesting that the EMAs are dominant, which may indicate a different phase of the market.
4. **Signal SMA:**
- A 21-period **SMA** is plotted as a general trend-following signal. It provides a broader perspective on the current price trend, helping to smooth out short-term fluctuations.
5. **Customizable Options:**
- **"Show MAs?"**: The user has the option to toggle the display of the EMA, SMA, and DEMA lines on or off.
- **Custom Period Inputs**: Each type of moving average can have its period length customized via the input settings for better adaptability to different market conditions.
#### How to Use the Indicator:
- **Trend Following**:
The **EMA, SMA, and DEMA** values can help you determine the direction of the trend. When the EMA is above the SMA, it could indicate a stronger, more recent upward momentum. Similarly, DEMA comparisons provide smoother and faster trend signals.
- **Bar Coloring Regime**:
The **bar color** gives a quick visual cue of the regime:
- **Green bars** suggest that DEMAs are indicating stronger bullish or bearish signals compared to the EMAs.
- **Red bars** imply the opposite, where EMAs may be showing stronger signals, but possibly with more noise or lag.
- **Signal SMA**:
The **21-period SMA** line can be used as a simple trend indicator. When the price is above this line, it could signify an uptrend, while price movement below the line might indicate a downtrend.
#### Custom Inputs:
- **EMA Length**: Default is 17, but can be adjusted to fit your trading style.
- **SMA Length**: Default is 14.
- **DEMA Lengths**: Two customizable inputs for DEMA (default 2 and 14).
- **Source Selection**: You can choose which price source (close, open, high, low, etc.) to use for each calculation (default is the closing price).
#### Conclusion:
This indicator is useful for traders who wish to blend **trend-following strategies** (using EMA, SMA, and DEMA) with **visual regime indicators** (bar coloring). It is highly customizable, allowing traders to adjust settings based on their market approach. The combination of EMAs and DEMAs provides a nuanced view of price dynamics, potentially leading to better-informed trading decisions.
Trading Channel Index (TCI)Overview:
The Trading Channel Index (TCI) is a technical analysis tool designed to identify cyclical trends in financial markets by smoothing out price movements and reducing volatility compared to traditional oscillators, like the Commodity Channel Index (CCI). The TCI helps traders pinpoint overbought and oversold conditions, as well as gauge the strength and direction of market trends.
Calculation:
The TCI is calculated through a multi-step process:
Typical Price (Xt): The typical price is computed as the average of the high, low, and close prices for each bar:
Xt = (High + Low + Close) / 3
Exponential Average (Et): This step smooths the typical price over a specified number of bars (TCI Channel Length) using an exponential moving average (EMA). The smoothing factor alpha is derived from the channel length:
Et = alpha * Xt + (1 - alpha) * Et
Where alpha = 2 / (TCI Channel Length + 1).
Average Deviation (Dt): The average deviation measures how much the typical price deviates from the exponential average over time. This is also smoothed using the EMA:
Dt = alpha * abs(Et - Xt) + (1 - alpha) * Dt
Channel Index (CI): The Channel Index is calculated by normalizing the difference between the typical price and the exponential average by the average deviation:
CI = (Xt - Et) / (0.15 * Dt)
Trading Channel Index (TCI): Finally, the TCI is generated by applying additional smoothing to the Channel Index using another EMA over the specified number of bars (TCI Average Length). The smoothing factor beta is derived from the average length:
TCI = beta * CI + (1 - beta) * TCI
Indicator Variables:
TCI Channel Length:
- Description: This variable sets the number of historical bars used to calculate the Channel Index (CI). A shorter length results in a more sensitive CI that responds quickly to price changes, while a longer length produces a smoother and less volatile CI.
- Default Value: 21
TCI Average Length:
-Description: This variable determines the number of bars over which the Channel Index (CI) is smoothed to produce the TCI. A shorter length makes the TCI more responsive to recent price changes, whereas a longer length further smooths the TCI, reducing its sensitivity to short-term fluctuations.
-Default Value: 10
Usage:
Overbought and Oversold Conditions: The TCI often uses levels such as +100 and -100 to identify potential reversal points. When the TCI crosses above +100, it might indicate an overbought condition, signaling a potential sell. Conversely, when it crosses below -100, it could indicate an oversold condition, suggesting a potential buy.
Trend Identification: Sustained values above 0 typically indicate a bullish trend, while values below 0 suggest a bearish trend. The TCI's smoothness helps traders stay in trends longer by reducing the impact of short-term market noise.
Conclusion:
The Trading Channel Index (TCI) is a versatile and powerful tool for traders who wish to capture cyclical price movements with a reduced level of noise. By adjusting the TCI Channel Length and TCI Average Length, traders can tailor the indicator to suit different market conditions, making it applicable across various timeframes and asset classes.
Bitcoin Macro Trend Map [Ox_kali]
## Introduction
__________________________________________________________________________________
The “Bitcoin Macro Trend Map” script is designed to provide a comprehensive analysis of Bitcoin’s macroeconomic trends. By leveraging a unique combination of Bitcoin-specific macroeconomic indicators, this script helps traders identify potential market peaks and troughs with greater accuracy. It synthesizes data from multiple sources to offer a probabilistic view of market excesses, whether overbought or oversold conditions.
This script offers significant value for the following reasons:
1. Holistic Market Analysis : It integrates a diverse set of indicators that cover various aspects of the Bitcoin market, from investor sentiment and market liquidity to mining profitability and network health. This multi-faceted approach provides a more complete picture of the market than relying on a single indicator.
2. Customization and Flexibility : Users can customize the script to suit their specific trading strategies and preferences. The script offers configurable parameters for each indicator, allowing traders to adjust settings based on their analysis needs.
3. Visual Clarity : The script plots all indicators on a single chart with clear visual cues. This includes color-coded indicators and background changes based on market conditions, making it easy for traders to quickly interpret complex data.
4. Proven Indicators : The script utilizes well-established indicators like the EMA, NUPL, PUELL Multiple, and Hash Ribbons, which are widely recognized in the trading community for their effectiveness in predicting market movements.
5. A New Comprehensive Indicator : By integrating background color changes based on the aggregate signals of various indicators, this script essentially creates a new, comprehensive indicator tailored specifically for Bitcoin. This visual representation provides an immediate overview of market conditions, enhancing the ability to spot potential market reversals.
Optimal for use on timeframes ranging from 1 day to 1 week , the “Bitcoin Macro Trend Map” provides traders with actionable insights, enhancing their ability to make informed decisions in the highly volatile Bitcoin market. By combining these indicators, the script delivers a robust tool for identifying market extremes and potential reversal points.
## Key Indicators
__________________________________________________________________________________
Macroeconomic Data: The script combines several relevant macroeconomic indicators for Bitcoin, such as the 10-month EMA, M2 money supply, CVDD, Pi Cycle, NUPL, PUELL, MRVR Z-Scores, and Hash Ribbons (Full description bellow).
Open Source Sources: Most of the scripts used are sourced from open-source projects that I have modified to meet the specific needs of this script.
Recommended Timeframes: For optimal performance, it is recommended to use this script on timeframes ranging from 1 day to 1 week.
Objective: The primary goal is to provide a probabilistic solution to identify market excesses, whether overbought or oversold points.
## Originality and Purpose
__________________________________________________________________________________
This script stands out by integrating multiple macroeconomic indicators into a single comprehensive tool. Each indicator is carefully selected and customized to provide insights into different aspects of the Bitcoin market. By combining these indicators, the script offers a holistic view of market conditions, helping traders identify potential tops and bottoms with greater accuracy. This is the first version of the script, and additional macroeconomic indicators will be added in the future based on user feedback and other inputs.
## How It Works
__________________________________________________________________________________
The script works by plotting each macroeconomic indicator on a single chart, allowing users to visualize and interpret the data easily. Here’s a detailed look at how each indicator contributes to the analysis:
EMA 10 Monthly: Uses an exponential moving average over 10 monthly periods to signal bullish and bearish trends. This indicator helps identify long-term trends in the Bitcoin market by smoothing out price fluctuations to reveal the underlying trend direction.Moving Averages w/ 18 day/week/month.
Credit to @ryanman0
M2 Money Supply: Analyzes the evolution of global money supply, indicating market liquidity conditions. This indicator tracks the changes in the total amount of money available in the economy, which can impact Bitcoin’s value as a hedge against inflation or economic instability.
Credit to @dylanleclair
CVDD (Cumulative Value Days Destroyed): An indicator based on the cumulative value of days destroyed, useful for identifying market turning points. This metric helps assess the Bitcoin market’s health by evaluating the age and value of coins that are moved, indicating potential shifts in market sentiment.
Credit to @Da_Prof
Pi Cycle: Uses simple and exponential moving averages to detect potential sell points. This indicator aims to identify cyclical peaks in Bitcoin’s price, providing signals for potential market tops.
Credit to @NoCreditsLeft
NUPL (Net Unrealized Profit/Loss): Measures investors’ unrealized profit or loss to signal extreme market levels. This indicator shows the net profit or loss of Bitcoin holders as a percentage of the market cap, helping to identify periods of significant market optimism or pessimism.
Credit to @Da_Prof
PUELL Multiple: Assesses mining profitability relative to historical averages to indicate buying or selling opportunities. This indicator compares the daily issuance value of Bitcoin to its yearly average, providing insights into when the market is overbought or oversold based on miner behavior.
Credit to @Da_Prof
MRVR Z-Scores: Compares market value to realized value to identify overbought or oversold conditions. This metric helps gauge the overall market sentiment by comparing Bitcoin’s market value to its realized value, identifying potential reversal points.
Credit to @Pinnacle_Investor
Hash Ribbons: Uses hash rate variations to signal buying opportunities based on miner capitulation and recovery. This indicator tracks the health of the Bitcoin network by analyzing hash rate trends, helping to identify periods of miner capitulation and subsequent recoveries as potential buying opportunities.
Credit to @ROBO_Trading
## Indicator Visualization and Interpretation
__________________________________________________________________________________
For each horizontal line representing an indicator, a legend is displayed on the right side of the chart. If the conditions are positive for an indicator, it will turn green, indicating the end of a bearish trend. Conversely, if the conditions are negative, the indicator will turn red, signaling the end of a bullish trend.
The background color of the chart changes based on the average of green or red indicators. This parameter is configurable, allowing adjustment of the threshold at which the background color changes, providing a clear visual indication of overall market conditions.
## Script Parameters
__________________________________________________________________________________
The script includes several configurable parameters to customize the display and behavior of the indicators:
Color Style:
Normal: Default colors.
Modern: Modern color style.
Monochrome: Monochrome style.
User: User-customized colors.
Custom color settings for up trends (Up Trend Color), down trends (Down Trend Color), and NaN (NaN Color)
Background Color Thresholds:
Thresholds: Settings to define the thresholds for background color change.
Low/High Red Threshold: Low and high thresholds for bearish trends.
Low/High Green Threshold: Low and high thresholds for bullish trends.
Indicator Display:
Options to show or hide specific indicators such as EMA 10 Monthly, CVDD, Pi Cycle, M2 Money, NUPL, PUELL, MRVR Z-Scores, and Hash Ribbons.
Specific Indicator Settings:
EMA 10 Monthly: Options to customize the period for the exponential moving average calculation.
M2 Money: Aggregation of global money supply data.
CVDD: Adjustments for value normalization.
Pi Cycle: Settings for simple and exponential moving averages.
NUPL: Thresholds for unrealized profit/loss values.
PUELL: Adjustments for mining profitability multiples.
MRVR Z-Scores: Settings for overbought/oversold values.
Hash Ribbons: Options for hash rate moving averages and capitulation/recovery signals.
## Conclusion
__________________________________________________________________________________
The “Bitcoin Macro Trend Map” by Ox_kali is a tool designed to analyze the Bitcoin market. By combining several macroeconomic indicators, this script helps identify market peaks and troughs. It is recommended to use it on timeframes from 1 day to 1 week for optimal trend analysis. The scripts used are sourced from open-source projects, modified to suit the specific needs of this analysis.
## Notes
__________________________________________________________________________________
This is the first version of the script and it is still in development. More indicators will likely be added in the future. Feedback and comments are welcome to improve this tool.
## Disclaimer:
__________________________________________________________________________________
Please note that the Open Interest liquidation map is not a guarantee of future market performance and should be used in conjunction with proper risk management. Always ensure that you have a thorough understanding of the indicator’s methodology and its limitations before making any investment decisions. Additionally, past performance is not indicative of future results.

SOL & BTC EMA with BTC/SOL Price Difference % and BTC Dom EMAThis script is designed to provide traders with a comprehensive analysis of Solana (SOL) and Bitcoin (BTC) by incorporating Exponential Moving Averages (EMAs) and price difference percentages. It also includes the BTC Dominance EMA to offer insights into the overall market dominance of Bitcoin.
Features:
SOL EMA: Plots the Exponential Moving Average (EMA) for Solana (SOL) based on a customizable period length.
BTC EMA: Plots the Exponential Moving Average (EMA) for Bitcoin (BTC) based on a customizable period length.
BTC Dominance EMA: Plots the Exponential Moving Average (EMA) for BTC Dominance, which helps in understanding Bitcoin's market share relative to other cryptocurrencies.
BTC/SOL Price Difference %: Calculates and plots the percentage difference between BTC and SOL prices, adjusted for their respective EMAs. This helps in identifying relative strength or weakness between the two assets.
Background Highlight: Colors the background to visually indicate whether the BTC/SOL price difference percentage is positive (green) or negative (red), aiding in quick decision-making.
Inputs:
SOL Ticker: Symbol for Solana (default: BINANCE
).
BTC Ticker: Symbol for Bitcoin (default: BINANCE
).
BTC Dominance Ticker: Symbol for Bitcoin Dominance (default: CRYPTOCAP
.D).
EMA Length: The length of the EMA (default: 20 periods).
Usage:
This script is intended for traders looking to analyze the relationship between SOL and BTC, using EMAs to smooth out price data and highlight trends. The BTC/SOL price difference percentage can help traders identify potential trading opportunities based on the relative movements of SOL and BTC.
Note: Leverage trading involves significant risk and may not be suitable for all investors. Ensure you have a good understanding of the market conditions and employ proper risk management techniques.

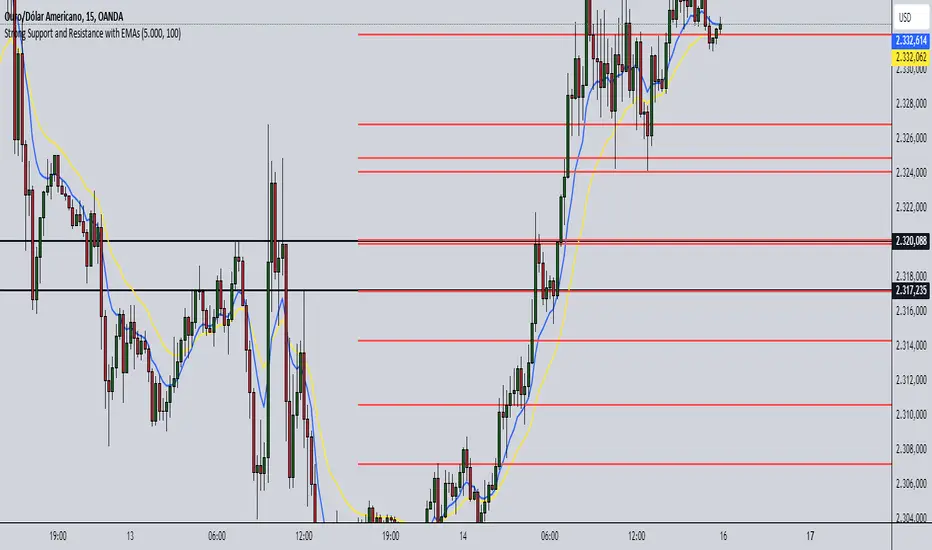
Strong Support and Resistance with EMAs @viniciushadek
### Strategy for Using Continuity Points with 20 and 9 Period Exponential Moving Averages, and Support and Resistance
This strategy involves using two exponential moving averages (EMA) - one with a 20-period and another with a 9-period - along with identifying support and resistance levels on the chart. Combining these tools can help determine trend continuation points and potential entry and exit points in market operations.
### 1. Setting Up the Exponential Moving Averages
- **20-Period EMA**: This moving average provides a medium-term trend view. It helps smooth out price fluctuations and identify the overall market direction.
- **9-Period EMA**: This moving average is more sensitive and reacts more quickly to price changes, providing short-term signals.
### 2. Identifying Support and Resistance
- **Support**: Price levels where demand is strong enough to prevent the price from falling further. These levels are identified based on previous lows.
- **Resistance**: Price levels where supply is strong enough to prevent the price from rising further. These levels are identified based on previous highs.
### 3. Continuity Points
The strategy focuses on identifying trend continuation points using the interaction between the EMAs and the support and resistance levels.
### 4. Buy Signals
- When the 9-period EMA crosses above the 20-period EMA.
- Confirm the entry if the price is near a support level or breaking through a resistance level.
### 5. Sell Signals
- When the 9-period EMA crosses below the 20-period EMA.
- Confirm the exit if the price is near a resistance level or breaking through a support level.
### 6. Risk Management
- Use appropriate stops below identified supports for buy operations.
- Use appropriate stops above identified resistances for sell operations.
### 7. Validating the Trend
- Check if the trend is validated by other technical indicators, such as the Relative Strength Index (RSI) or Volume.
### Conclusion
This strategy uses the combination of exponential moving averages and support and resistance levels to identify continuity points in the market trend. It is crucial to confirm the signals with other technical analysis tools and maintain proper risk management to maximize results and minimize losses.
Implementing this approach can provide a clearer view of market movements and help make more informed trading decisions.
LBR-S310ROC @shrilssOriginally made by Linda Raschke, The S310ROC Indicator combines the Rate of Change (ROC) indicator with the 3-10 Oscillator (Modified MACD) and plots to capture rapid price movements and gauge market momentum.
- Rate of Change (ROC): This component of the indicator measures the percentage change in price over a specified short interval, which can be set by the user (default is 2 days). It is calculated by subtracting the closing price from 'X' days ago from the current close.
- 3-10 Oscillator (MACD; 3,10,16): This is a specialized version of the Moving Average Convergence Divergence (MACD) but uses simple moving averages instead of exponential. Using a fast moving average of 3 days and a slow moving average of 10 days with a smoothing period of 16.
- ROC Dots: A great feature based on the oscillator's readings. Dots are displayed directly on the oscillator or the price chart to provide visual momentum cues:
- Aqua Dots: Appear when all lines (ROC, MACD, Slowline) are sloping downwards, indicating bearish momentum and potentially signaling a sell opportunity.
- White Dots: Appear when all lines are sloping upwards, suggesting bullish momentum and possibly a buy signal.

Tetuan SniperThe TEMA and EMA Crossover Alert with SL, TP, and Order Signal strategy combines the power of Triple Exponential Moving Average (TEMA) and Exponential Moving Average (EMA) to generate high-quality trading signals. This strategy is designed to provide clear entry and exit points, manage risk through dynamic Stop Loss (SL) and Take Profit (TP) levels, and optimize trade sizes based on account balance and risk tolerance.
Key Features:
EMA and TEMA Crossover:
The strategy identifies potential buy and sell signals based on the crossover of EMA and TEMA. A buy signal is generated when TEMA crosses above EMA, and a sell signal is generated when TEMA crosses below EMA.
Dynamic Stop Loss (SL) and Take Profit (TP):
Stop Loss levels are dynamically set based on a user-defined number of pips below (for buy orders) or above (for sell orders) the lowest or highest point since the crossover.
Take Profit levels are dynamically adjusted using another TEMA, providing a flexible exit strategy that adapts to market conditions.
Lot Size Calculation:
The strategy calculates the optimal lot size based on the account balance, risk percentage per trade, and the number of maximum open orders. For JPY pairs, the lot size is adjusted by dividing by 100 to account for the different pip value.
The lot size is rounded to two decimal places for better readability and precision.
Visual Alerts and Labels:
Clear visual alerts and labels are provided for each buy and sell signal, including the recommended SL, TP, and lot size. The labels are placed in a way to avoid overlapping important chart elements.
Trend Visualization:
The area between the TEMA and EMA is colored to indicate the trend, with green for bullish trends and red for bearish trends, making it easy to visualize the market direction.
Inputs:
SL Points: Number of pips for the Stop Loss.
EMA Period: Period for the Exponential Moving Average.
TEMA Period: Period for the Triple Exponential Moving Average.
Account Balance: The total account balance for calculating the lot size.
Risk Percentage: The percentage of the account balance to risk per trade.
Take Profit TEMA Period: Period for the TEMA used to set Take Profit levels.
Lot per Pip Value: The value of 1 pip per lot.
Maximum Open Orders: The maximum number of open orders to split the balance among.
Example Usage
This strategy is suitable for traders who want to automate their trading signals and manage risk effectively. By combining TEMA and EMA crossovers with dynamic SL and TP levels and precise lot size calculation, traders can achieve a disciplined and methodical approach to trading.

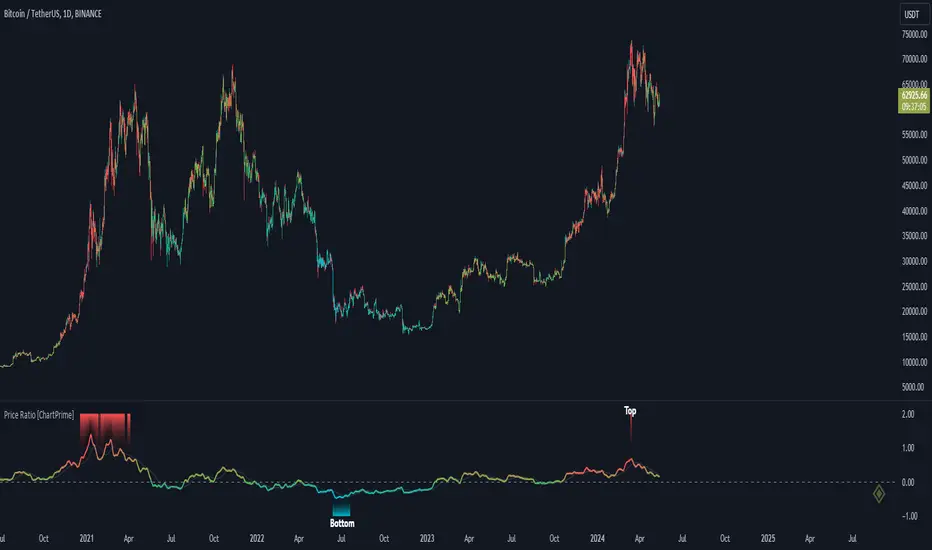
Price Ratio Indicator [ChartPrime]The Price Ratio Indicator is a versatile tool designed to analyze the relationship between the price of an asset and its moving average. It helps traders identify overbought and oversold conditions in the market, as well as potential trend reversals.
◈ User Inputs:
MA Length: Specifies the length of the moving average used in the calculation.
MA Type Fast: Allows users to choose from various types of moving averages such as Exponential Moving Average (EMA), Simple Moving Average (SMA), Weighted Moving Average (WMA), Volume Weighted Moving Average (VWMA), Relative Moving Average (RMA), Double Exponential Moving Average (DEMA), Triple Exponential Moving Average (TEMA), Zero-Lag Exponential Moving Average (ZLEMA), and Hull Moving Average (HMA).
Upper Level and Lower Level: Define the threshold levels for identifying overbought and oversold conditions.
Signal Line Length: Determines the length of the signal line used for smoothing the indicator's values.
◈ Indicator Calculation:
The indicator calculates the ratio between the price of the asset and the selected moving average, subtracts 1 from the ratio, and then smooths the result using the chosen signal line length.
// 𝙄𝙉𝘿𝙄𝘾𝘼𝙏𝙊𝙍 𝘾𝘼𝙇𝘾𝙐𝙇𝘼𝙏𝙄𝙊𝙉𝙎
//@ Moving Average's Function
ma(src, ma_period, ma_type) =>
ma =
ma_type == 'EMA' ? ta.ema(src, ma_period) :
ma_type == 'SMA' ? ta.sma(src, ma_period) :
ma_type == 'WMA' ? ta.wma(src, ma_period) :
ma_type == 'VWMA' ? ta.vwma(src, ma_period) :
ma_type == 'RMA' ? ta.rma(src, ma_period) :
ma_type == 'DEMA' ? ta.ema(ta.ema(src, ma_period), ma_period) :
ma_type == 'TEMA' ? ta.ema(ta.ema(ta.ema(src, ma_period), ma_period), ma_period) :
ma_type == 'ZLEMA' ? ta.ema(src + src - src , ma_period) :
ma_type == 'HMA' ? ta.hma(src, ma_period)
: na
ma
//@ Smooth of Source
src = math.sum(source, 5)/5
//@ Ratio Price / MA's
p_ratio = src / ma(src, ma_period, ma_type) - 1
◈ Visualization:
The main plot displays the price ratio, with color gradients indicating the strength and direction of the ratio.
The bar color changes dynamically based on the ratio, providing a visual representation of market conditions.
Invisible Horizontal lines indicate the upper and lower threshold levels for overbought and oversold conditions.
A signal line, smoothed using the specified length, helps identify trends and potential reversal points.
High and low value regions are filled with color gradients, enhancing visualization of extreme price movements.
MA type HMA gives faster changes of the indicator (Each MA has its own specifics):
MA type TEMA:
◈ Additional Features:
A symbol displayed at the bottom right corner of the chart provides a quick visual reference to the current state of the indicator, with color intensity indicating the strength of the ratio.
Overall, the Price Ratio Indicator offers traders valuable insights into price dynamics and helps them make informed trading decisions based on the relationship between price and moving averages. Adjusting the input parameters allows for customization according to individual trading preferences and market conditions.
Support Resistance & Ema
The "Support Resistance & Ema" indicator combines various strategies to assist traders in identifying significant support and resistance levels on the chart and in following trends through exponential moving averages (EMA). This script is designed to be versatile and useful in different trading strategies.
Key Features:
Support and Resistance: It utilizes pivot highs and lows to pinpoint support and resistance levels. These levels are plotted on the chart with lines that change color based on trend reversals.
Trend Identification: The indicator follows trends using four conditions:
_hh: Higher highs and higher lows, indicating an uptrend.
_ll: Lower highs and lower lows, indicating a downtrend.
_hl: Higher highs and lower lows, indicating weakening uptrend or an impending reversal.
_lh: Lower highs and higher lows, indicating weakening downtrend or an impending reversal.
Exponential Moving Averages (EMA): It also displays various EMAs (9, 21, 50, 100, 200) on the chart to provide further insights into the trend direction.
Usage:
Support and Resistance: Support and resistance lines are automatically plotted on the chart. Trend reversals are highlighted by changing the color of the lines.
Trend Identification: The _hh, _ll, _hl, _lh conditions help identify trend changes. When one of these conditions is met, it indicates a particular configuration of highs and lows that might suggest a trading opportunity.
Exponential Moving Averages (EMA): The EMAs are plotted on the chart and can be used to confirm trends identified by the main indicator.
To use this script, you need to add it as an indicator to your trading chart. Once applied, the support, resistance lines, and EMAs will be visible on the chart, providing traders with valuable information to make informed trading decisions.
In summary, this script offers a comprehensive way to identify significant support and resistance levels, spot market trends, and confirm those trends through the use of exponential moving averages.

DEMA Adjusted Average True Range [BackQuant]The use of the Double Exponential Moving Average (DEMA) within your Adjusted Average True Range (ATR) calculation serves as a cornerstone for enhancing the indicator's responsiveness to market changes. To delve deeper into why DEMA is employed specifically in the context of your ATR calculation, let's explore the inherent qualities of DEMA and its impact on the ATR's performance.
DEMA and Its Advantages
As previously mentioned, DEMA was designed to offer a more responsive alternative to the traditional Exponential Moving Average (EMA). By giving more weight to recent price data, DEMA reduces the lag typically associated with moving averages. This reduction in lag is especially beneficial for short-term traders looking to capitalize on trend reversals and other market movements as swiftly as possible.
The calculation of DEMA involves the following steps:
Calculate EMA1: This is the Exponential Moving Average of the price.
Calculate EMA2: This is the Exponential Moving Average of EMA1, thus it is a smoothing of a smoothing, leading to a greater lag.
Formulate DEMA: The formula
EMA1 = EMA of price
EMA2 = EMA of EMA1
DEMA = (2 x EMA1) - EMA2
effectively doubles the weighting of the most recent data points by subtracting the lagged, double-smoothed EMA2 from twice the single-smoothed EMA1.
This process enhances the moving average's sensitivity to recent price movements, allowing the DEMA to adhere more closely to the price bars than either EMA1 or EMA2 alone.
Integration with ATR
In the context of your ATR calculation, the integration of DEMA plays a crucial role in defining the indicator's core functionality. Here's a detailed explanation of how DEMA affects the ATR calculation:
Initial Determination of DEMA : By applying the DEMA formula to the chosen source data (which can be adjusted to use Heikin Ashi candle close prices for an even smoother analysis), you set a foundation for a more reactive trend-following mechanism within the ATR framework.
Application to ATR Bands : The calculated DEMA serves as the central line from which the ATR bands are derived. The ATR value, multiplied by a user-defined factor, is added to and subtracted from the DEMA to form the upper and lower bands, respectively. This dynamic adjustment not only reflects the volatility based on the ATR but does so in a way that is closely aligned with the most recent price action, thanks to the utilization of DEMA.
Enhanced Signal Quality : The responsiveness of DEMA ensures that the ATR bands adjust more promptly to changes in market conditions. This quality is vital for traders who rely on the ATR bands to identify potential entry and exit points, trend reversals, or to assess market volatility.
By employing DEMA as the core component in calculating the Adjusted Average True Range, your indicator leverages DEMA's reduced lag and increased weight on recent data to provide a more timely and accurate measure of market volatility. This innovative approach enhances the utility of the ATR by making it not only a tool for assessing volatility but also a more reactive indicator for trend analysis and trading signal generation.
The main concept of combining these is to reduce lag, get a more robust signal and still capture clear trends over medium time horizons.
For me, this is best used in confluence with other indicators, it can be made faster in order to get fasters response time, or slower. This is all depending on the needs of you as a trader.
User Inputs:
The script offers several user-configurable inputs, such as the period lengths for DEMA and ATR calculations, the multiplication factor for the ATR, and options to use Heikin Ashi candles or standard price data. Additionally, it allows for the toggling of visual features, like the plotting of the DEMA ATR and its moving average, and the application of color-coded trends on price bars.
Additional Features:
Moving Average Confluence: Traders can opt to display a moving average of the DEMA ATR, choosing from various types (e.g., SMA, EMA, HMA). This feature provides a layer of confluence, aiding in the identification of trend direction and strength.
Trend Identification :
The script employs logical conditions to ascertain the trend direction based on the movement of the DEMA ATR. It assigns colors to represent bullish or bearish trends, which are reflected in the plotted lines and the coloring of price bars.
Alerts :
Customizable alert conditions for trend reversals enhance the utility of the indicator for active trading, notifying users of significant changes in trend direction.
1D Backtests
We include these backtests as a general proxy for how they work.
Please do your own calibrating to suit it to your own needs and backtest.
Past results don't = future results but they can help you understand how it functions.
INDEX:BTCUSD
INDEX:ETHUSD
BINANCE:SOLUSD

Machine Learning: VWAP [YinYangAlgorithms]Machine Learning: VWAP aims to use Machine Learning to Identify the best location to Anchor the VWAP at. Rather than using a traditional fixed length or simply adjusting based on a Date / Time; by applying Machine Learning we may hope to identify crucial areas which make sense to reset the VWAP and start anew. VWAP’s may act similar to a Bollinger Band in the sense that they help to identify both Overbought and Oversold Price locations based on previous movements and help to identify how far the price may move within the current Trend. However, unlike Bollinger Bands, VWAPs have the ability to parabolically get quite spaced out and also reset. For this reason, the price may never actually go from the Lower to the Upper and vice versa (when very spaced out; when the Upper and Lower zones are narrow, it may bounce between the two). The reason for this is due to how the anchor location is calculated and in this specific Indicator, how it changes anchors based on price movement calculated within Machine Learning.
This Indicator changes the anchor if the Low < Lowest Low of a length of X and likewise if the High > Highest High of a length of X. This logic is applied within a Machine Learning standpoint that likewise amplifies this Lookback Length by adding a Machine Learning Length to it and increasing the lookback length even further.
Due to how the anchor for this VWAP changes, you may notice that the Basis Line (Orange) may act as a Trend Identifier. When the Price is above the basis line, it may represent a bullish trend; and likewise it may represent a bearish trend when below it. You may also notice what may happen is when the trend occurs, it may push all the way to the Upper or Lower levels of this VWAP. It may then proceed to move horizontally until the VWAP expands more and it may gain more movement; or it may correct back to the Basis Line. If it corrects back to the basis line, what may happen is it either uses the Basis Line as a Support and continues in its current direction, or it will change the VWAP anchor and start anew.
Tutorial:
If we zoom in on the most recent VWAP we can see how it expands. Expansion may be caused by time but generally it may be caused by price movement and volume. Exponential Price movement causes the VWAP to expand, even if there are corrections to it. However, please note Volume adds a large weighted factor to the calculation; hence Volume Weighted Average Price (VWAP).
If you refer to the white circle in the example above; you’ll be able to see that the VWAP expanded even while the price was correcting to the Basis line. This happens due to exponential movement which holds high volume. If you look at the volume below the white circle, you’ll notice it was very large; however even though there was exponential price movement after the white circle, since the volume was low, the VWAP didn’t expand much more than it already had.
There may be times where both Volume and Price movement isn’t significant enough to cause much of an expansion. During this time it may be considered to be in a state of consolidation. While looking at this example, you may also notice the color switch from red to green to red. The color of the VWAP is related to the movement of the Basis line (Orange middle line). When the current basis is > the basis of the previous bar the color of the VWAP is green, and when the current basis is < the basis of the previous bar, the color of the VWAP is red. The color may help you gauge the current directional movement the price is facing within the VWAP.
You may have noticed there are signals within this Indicator. These signals are composed of Green and Red Triangles which represent potential Bullish and Bearish momentum changes. The Momentum changes happen when the Signal Type:
The High/Low or Close (You pick in settings)
Crosses one of the locations within the VWAP.
Bullish Momentum change signals occur when :
Signal Type crosses OVER the Basis
Signal Type crosses OVER the lower level
Bearish Momentum change signals occur when:
Signal Type crosses UNDER the Basis
Signal Type Crosses UNDER the upper level
These signals may represent locations where momentum may occur in the direction of these signals. For these reasons there are also alerts available to be set up for them.
If you refer to the two circles within the example above, you may see that when the close goes above the basis line, how it mat represents bullish momentum. Likewise if it corrects back to the basis and the basis acts as a support, it may continue its bullish momentum back to the upper levels again. However, if you refer to the red circle, you’ll see if the basis fails to act as a support, it may then start to correct all the way to the lower levels, or depending on how expanded the VWAP is, it may just reset its anchor due to such drastic movement.
You also have the ability to disable Machine Learning by setting ‘Machine Learning Type’ to ‘None’. If this is done, it will go off whether you have it set to:
Bullish
Bearish
Neutral
For the type of VWAP you want to see. In this example above we have it set to ‘Bullish’. Non Machine Learning VWAP are still calculated using the same logic of if low < lowest low over length of X and if high > highest high over length of X.
Non Machine Learning VWAP’s change much quicker but may also allow the price to correct from one side to the other without changing VWAP Anchor. They may be useful for breaking up a trend into smaller pieces after momentum may have changed.
Above is an example of how the Non Machine Learning VWAP looks like when in Bearish. As you can see based on if it is Bullish or Bearish is how it favors the trend to be and may likewise dictate when it changes the Anchor.
When set to neutral however, the Anchor may change quite quickly. This results in a still useful VWAP to help dictate possible zones that the price may move within, but they’re also much tighter zones that may not expand the same way.
We will conclude this Tutorial here, hopefully this gives you some insight as to why and how Machine Learning VWAPs may be useful; as well as how to use them.
Settings:
VWAP:
VWAP Type: Type of VWAP. You can favor specific direction changes or let it be Neutral where there is even weight to both. Please note, these do not apply to the Machine Learning VWAP.
Source: VWAP Source. By default VWAP usually uses HLC3; however OHLC4 may help by providing more data.
Lookback Length: The Length of this VWAP when it comes to seeing if the current High > Highest of this length; or if the current Low is < Lowest of this length.
Standard VWAP Multiplier: This multiplier is applied only to the Standard VWMA. This is when 'Machine Learning Type' is set to 'None'.
Machine Learning:
Use Rational Quadratics: Rationalizing our source may be beneficial for usage within ML calculations.
Signal Type: Bullish and Bearish Signals are when the price crosses over/under the basis, as well as the Upper and Lower levels. These may act as indicators to where price movement may occur.
Machine Learning Type: Are we using a Simple ML Average, KNN Mean Average, KNN Exponential Average or None?
KNN Distance Type: We need to check if distance is within the KNN Min/Max distance, which distance checks are we using.
Machine Learning Length: How far back is our Machine Learning going to keep data for.
k-Nearest Neighbour (KNN) Length: How many k-Nearest Neighbours will we account for?
Fast ML Data Length: What is our Fast ML Length? This is used with our Slow Length to create our KNN Distance.
Slow ML Data Length: What is our Slow ML Length? This is used with our Fast Length to create our KNN Distance.
If you have any questions, comments, ideas or concerns please don't hesitate to contact us.
HAPPY TRADING!

Multi-Timeframe Trend Detector [Alifer]Here is an easy-to-use and customizable multi-timeframe visual trend indicator.
The indicator combines Exponential Moving Averages (EMA), Moving Average Convergence Divergence (MACD), and Relative Strength Index (RSI) to determine the trend direction on various timeframes: 15 minutes (15M), 30 minutes (30M), 1 hour (1H), 4 hours (4H), 1 day (1D), and 1 week (1W).
EMA Trend : The script calculates two EMAs for each timeframe: a fast EMA and a slow EMA. If the fast EMA is greater than the slow EMA, the trend is considered Bullish; if the fast EMA is less than the slow EMA, the trend is considered Bearish.
MACD Trend : The script calculates the MACD line and the signal line for each timeframe. If the MACD line is above the signal line, the trend is considered Bullish; if the MACD line is below the signal line, the trend is considered Bearish.
RSI Trend : The script calculates the RSI for each timeframe. If the RSI value is above a specified Bullish level, the trend is considered Bullish; if the RSI value is below a specified Bearish level, the trend is considered Bearish. If the RSI value is between the Bullish and Bearish levels, the trend is Neutral, and no arrow is displayed.
Dashboard Display :
The indicator prints arrows on the dashboard to represent Bullish (▲ Green) or Bearish (▼ Red) trends for each timeframe.
You can easily adapt the Dashboard colors (Inputs > Theme) for visibility depending on whether you're using a Light or Dark theme for TradingView.
Usage :
You can adjust the indicator's settings such as theme (Dark or Light), EMA periods, MACD parameters, RSI period, and Bullish/Bearish levels to adapt it to your specific trading strategies and preferences.
Disclaimer :
This indicator is designed to quickly help you identify the trend direction on multiple timeframes and potentially make more informed trading decisions.
You should consider it as an extra tool to complement your strategy, but you should not solely rely on it for making trading decisions.
Always perform your own analysis and risk management before executing trades.
The indicator will only show a Dashboard. The EMAs, RSI and MACD you see on the chart image have been added just to demonstrate how the script works.
DETAILED SCRIPT EXPLANATION
INPUTS:
theme : Allows selecting the color theme (options: "Dark" or "Light").
emaFastPeriod : The period for the fast EMA.
emaSlowPeriod : The period for the slow EMA.
macdFastLength : The fast length for MACD calculation.
macdSlowLength : The slow length for MACD calculation.
macdSignalLength : The signal length for MACD calculation.
rsiPeriod : The period for RSI calculation.
rsiBullishLevel : The level used to determine Bullish RSI condition, when RSI is above this value. It should always be higher than rsiBearishLevel.
rsiBearishLevel : The level used to determine Bearish RSI condition, when RSI is below this value. It should always be lower than rsiBullishLevel.
CALCULATIONS:
The script calculates EMAs on multiple timeframes (15-minute, 30-minute, 1-hour, 4-hour, daily, and weekly) using the request.security() function.
Similarly, the script calculates MACD values ( macdLine , signalLine ) on the same multiple timeframes using the request.security() function along with the ta.macd() function.
RSI values are also calculated for each timeframe using the request.security() function along with the ta.rsi() function.
The script then determines the EMA trends for each timeframe by comparing the fast and slow EMAs using simple boolean expressions.
Similarly, it determines the MACD trends for each timeframe by comparing the MACD line with the signal line.
Lastly, it determines the RSI trends for each timeframe by comparing the RSI values with the Bullish and Bearish RSI levels.
PLOTTING AND DASHBOARD:
Color codes are defined based on the EMA, MACD, and RSI trends for each timeframe. Green for Bullish, Red for Bearish.
A dashboard is created using the table.new() function, displaying the trend information for each timeframe with arrows representing Bullish or Bearish conditions.
The dashboard will appear in the top-right corner of the chart, showing the Bullish and Bearish trends for each timeframe (15M, 30M, 1H, 4H, 1D, and 1W) based on EMA, MACD, and RSI analysis. Green arrows represent Bullish trends, red arrows represent Bearish trends, and no arrows indicate Neutral conditions.
INFO ON USED INDICATORS:
1 — EXPONENTIAL MOVING AVERAGE (EMA)
The Exponential Moving Average (EMA) is a type of moving average (MA) that places a greater weight and significance on the most recent data points.
The EMA is calculated by taking the average of the true range over a specified period. The true range is the greatest of the following:
The difference between the current high and the current low.
The difference between the previous close and the current high.
The difference between the previous close and the current low.
The EMA can be used by traders to produce buy and sell signals based on crossovers and divergences from the historical average. Traders often use several different EMA lengths, such as 10-day, 50-day, and 200-day moving averages.
The formula for calculating EMA is as follows:
Compute the Simple Moving Average (SMA).
Calculate the multiplier for weighting the EMA.
Calculate the current EMA using the following formula:
EMA = Closing price x multiplier + EMA (previous day) x (1-multiplier)
2 — MOVING AVERAGE CONVERGENCE DIVERGENCE (MACD)
The Moving Average Convergence Divergence (MACD) is a popular trend-following momentum indicator used in technical analysis. It helps traders identify changes in the strength, direction, momentum, and duration of a trend in a financial instrument's price.
The MACD is calculated by subtracting a longer-term Exponential Moving Average (EMA) from a shorter-term EMA. The most commonly used time periods for the MACD are 26 periods for the longer EMA and 12 periods for the shorter EMA. The difference between the two EMAs creates the main MACD line.
Additionally, a Signal Line (usually a 9-period EMA) is computed, representing a smoothed version of the MACD line. Traders watch for crossovers between the MACD line and the Signal Line, which can generate buy and sell signals. When the MACD line crosses above the Signal Line, it generates a bullish signal, indicating a potential uptrend. Conversely, when the MACD line crosses below the Signal Line, it generates a bearish signal, indicating a potential downtrend.
In addition to the MACD line and Signal Line crossovers, traders often look for divergences between the MACD and the price chart. Divergence occurs when the MACD is moving in the opposite direction of the price, which can suggest a potential trend reversal.
3 — RELATIVE STRENGHT INDEX (RSI):
The Relative Strength Index (RSI) is another popular momentum oscillator used by traders to assess the overbought or oversold conditions of a financial instrument. The RSI ranges from 0 to 100 and measures the speed and change of price movements.
The RSI is calculated based on the average gain and average loss over a specified period, commonly 14 periods. The formula involves several steps:
Calculate the average gain over the specified period.
Calculate the average loss over the specified period.
Calculate the relative strength (RS) by dividing the average gain by the average loss.
Calculate the RSI using the following formula: RSI = 100 - (100 / (1 + RS))
The RSI oscillates between 0 and 100, where readings above 70 are considered overbought, suggesting that the price may have risen too far and could be due for a correction. Readings below 30 are considered oversold, suggesting that the price may have dropped too much and could be due for a rebound.
Traders often use the RSI to identify potential trend reversals. For example, when the RSI crosses above 30 from below, it may indicate the start of an uptrend, and when it crosses below 70 from above, it may indicate the start of a downtrend. Additionally, traders may look for bullish or bearish divergences between the RSI and the price chart, similar to the MACD analysis, to spot potential trend changes.

SRTL, 2EMA & TRAMASRTL - Support Resistance and Trend Line with Double EMA and TRAMA
The SRTL indicator is a powerful tool for technical analysis that seamlessly integrates support and resistance levels, trend lines, and moving average signals. It offers traders a comprehensive view of the market's dynamics, making it a valuable addition to any trading toolkit. Here's a concise summary of its key features and functionalities:
Key Features:
- Dynamic Support and Resistance Levels based on Pivot Points
- Trend Lines based on Recent Pivot Points
- Double Exponential Moving Averages (EMA) with adjustable lengths
- Trend Regularity Adaptive Moving Average (TRAMA) for trend identification
- Buy and Sell signals based on the crossover of EMAs
The indicator is composed of 4 main components:
1. Support and resistance levels: The indicator calculates support and resistance levels based on pivot points and a channel width parameter. These levels can be used to identify potential entry and exit points for trades. The script calculates and plots dynamic support and resistance levels based on pivot points. Users can adjust the period for calculating pivot points, loopback period, and S/R strength to customize the levels' sensitivity.
2. Trend Lines: The script identifies and plots trend lines based on recent pivot points. Users can customize the number of pivot points to consider and the start date to begin plotting the trend lines. The script identifies and plots trend lines based on recent pivot points. By adjusting the number of pivot points to consider and the start date, traders can visualize potential trends and assess the market's overall direction. This feature helps traders understand the prevailing market sentiment and make informed trading decisions.
3. Double Exponential Moving Averages (EMA): The script calculates and plots two Exponential Moving Averages (EMA) with customizable lengths. A crossover of these EMAs can be used as a signal for potential trend changes. The study calculates and displays two Exponential Moving Averages (EMA) with adjustable lengths. The crossover of these EMAs serves as a crucial signal for potential trend changes. When the faster EMA crosses above the slower EMA, a "Buy" signal is generated, and when the faster EMA crosses below the slower EMA, a "Sell" signal is generated.
4. Trend Regularity Adaptive Moving Average (TRAMA): The script calculates and plots the TRAMA, a unique adaptive moving average that helps identify trends and adapt to market conditions. The indicator includes the Trend Regularity Adaptive Moving Average (TRAMA), an adaptive moving average designed to identify trends and adapt to varying market conditions. TRAMA helps traders gauge the strength of a trend and provides valuable insights into potential trend reversals.
5. Signals: The script generates "Buy - Green" and "Sell- Red" signals based on the crossover of the two EMAs and Pivot Point Trend Levels. That Also Customizable.
How to Use:
The SRTL indicator is a powerful tool for technical analysis, offering multiple layers of information for traders. When the price approaches dynamic support or resistance levels, The dynamic support and resistance levels are based on pivot points and adjust to the market's current conditions. The trend lines help visualize potential trends and can be adjusted to show different numbers of pivot points. Additionally, the Double EMA and TRAMA lines provide further insight into the market's momentum and potential reversals. Traders can assess the potential for trend reversals or breakouts. The trend lines help visualize the market's prevailing direction, and the crossover of the Double EMA signals potential entry and exit points.
Traders should use this study as part of a broader trading strategy and combine it with other technical indicators, fundamental analysis, and risk management techniques. Additionally, it's essential to test the indicator thoroughly in a demo or back testing environment before applying it to live trading to ensure its compatibility with individual trading styles and preferences.

Smoother Momentum Stops [Loxx]Smoother Momentum Stops (SMS) is a dynamic tool that combines the logic of momentum and moving averages to create an overlay of the market price and generate potential trade signals. The original idea for this indicator comes from the beloved and esteemed trading indicator guru Mladen Rakic.
Understanding the Framework
The SMS incorporates various aspects of technical analysis, including momentum calculation, several types of moving averages, and an intelligent stop-and-reverse system that determines when to enter and exit trades.
The indicator initiates by defining the color scheme for visualization, specifically green for bullish trends and red for bearish trends. It further utilizes the 'smmom' and 'fema' functions to calculate smoothed momentum and fast exponential moving averages, respectively. The values computed by these functions are central to the signal generation process.
Momentum Calculation
The 'smmom' function serves to calculate a smoother momentum by taking a source (such as the closing price) and a period as inputs. This function employs a complex algorithm involving exponential moving averages (EMA), wherein two EMAs are calculated with different smoothing factors, and the difference between the two results is returned as the output. This smooth momentum calculation assists in eliminating unnecessary noise from the market and delivers more reliable momentum readings.
Moving Averages Computation
One key feature of the SMS is the ability to select from five different moving average types: Exponential Moving Average (EMA), Fast Exponential Moving Average (FEMA), Linear Weighted Moving Average (LWMA), Simple Moving Average (SMA), and Smoothed Moving Average (SMMA). The 'variant' function assigns the chosen method to the '_avg' variable, which is then used in the trade signal logic.
Trade Signal Generation
SMS employs a complex yet robust mechanism for generating trade signals. A stop-and-reverse system is established, which works on the principle of momentum. If the smoothed momentum is positive, an upper stop is determined and if the momentum is negative, a lower stop is defined.
The process continues by defining long and short entry conditions. The indicator goes long when an upper stop exists, and the previous bar had a lower stop, signifying a shift in momentum. The short entry condition is the opposite: the indicator goes short when a lower stop exists, and the previous bar had an upper stop. Alerts are generated for each of these conditions, helping traders to take timely action.
Visual Representation and UI Options
In terms of visual representation, the indicator plots upper and lower stops, employing green color for upper and red for lower stops. If the option to color bars is chosen, the entire bar is colored green or red, based on whether an upper or lower stop exists. This feature allows traders to visually comprehend market conditions better. Support and reisstance levels are also provided for visual context.
Conclusion
The Smoother Momentum Stops indicator is a potent tool for traders seeking to optimize their trading strategies. It blends the fundamentals of momentum and moving averages, resulting in a robust system that provides clear, reliable, and timely trading signals. By adjusting the smoothing type and period parameters, traders can customize the indicator to fit various market conditions and asset types, thereby adding a layer of flexibility to their trading strategies.
The use of a stop-and-reverse system adds a layer of risk management by offering precise entry and exit points based on momentum shifts. These stops are not just mere levels of entries or exits, but they reflect the undercurrent of the market's momentum, thus providing a dynamic framework to make informed trading decisions.
Additionally, the SMS indicator offers visual simplicity. The color-coded bars and distinct symbols for long and short positions make it easier for traders to interpret the signals and market direction quickly. Combined with the alert system, it ensures that traders never miss an important trading opportunity.
Finally, the power of the SMS indicator lies in its adaptability and comprehensive approach. By providing a selection of moving averages and an intelligent momentum-based system, it encapsulates various aspects of market behavior. As such, it is a useful tool not just for momentum traders, but for any trader who understands the significance of moving averages and momentum in predicting market movements.
In conclusion, the Smoother Momentum Stops indicator stands as an innovative, adaptable, and powerful tool for the modern trader. Its blend of flexibility, dynamic risk management, and straightforward visualization offer a comprehensive solution for traders looking to navigate the complex world of financial markets. With a detailed understanding of its workings as presented in this essay, traders can harness its full potential to optimize their strategies, manage risk, and achieve their trading objectives.
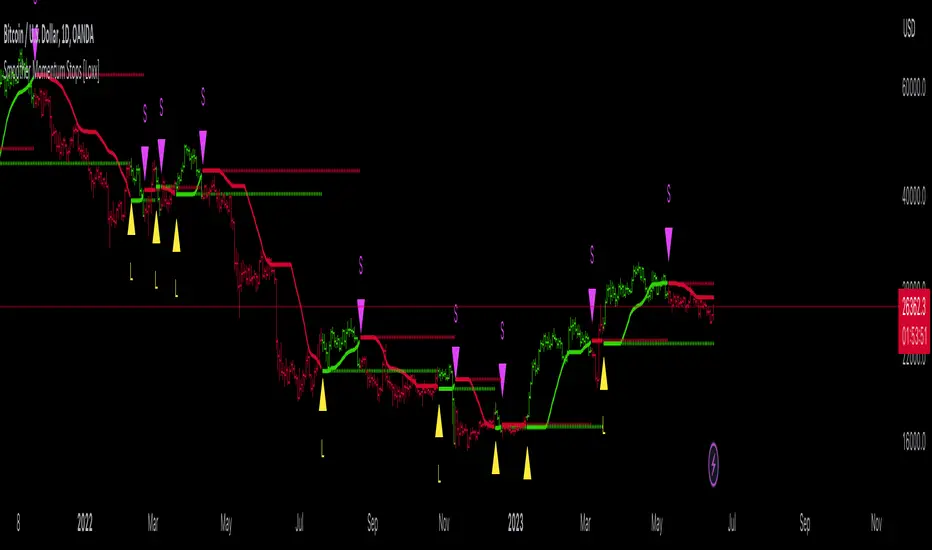
Logarithmic VolatilityIntroducing the Logarithmic Volatility Indicator , an innovative trading indicator designed especially for trading in low volatility markets. This powerful indicator is aimed at traders of all levels, from beginners to experts, and is based on fundamental concepts of mathematics and statistics applied to the financial market. Its main objective is to provide you with a better understanding of price movements and help you make more accurate investment decisions, especially in low volatility environments.
The purpose of this indicator is to find a volatility estimator that depends on the difference between High and Low, taking into account that this measure is directly proportional to volatility. A first result was obtained by Parkinson (1980) which was later improved by Garman and Klass (1980), who improved the estimator by obtaining one of minimum variance. It is the simplified version (and recommended by them) of the Garman and Klass estimator that is used to calculate the daily volatility of the asset.
The Logarithmic Volatility Indicator is a unique smoothing indicator that uses logarithms and volatility calculation of the opening, high, low and closing prices. It combines these elements to obtain an accurate representation of market volatility in situations where volatility is low.
Features
This indicator has several outstanding features designed to enhance your trading analysis in low volatility environments:
• Intraday Volatility Calculation: This innovative feature allows you to view market volatility levels in real time, providing a clear view of market fluctuations even when volatility is low.
• EMA (Exponential Moving Average) Multi Length: The indicator incorporates three different EMA lengths (Fast, Medium and Slow). This gives you a deeper and more detailed analysis of market volatility, allowing you to detect subtle changes in volatility and make more accurate predictions.
• Visual color change: The indicator uses a color change between green and red to facilitate quick interpretation of the market. Green indicates a decrease in volatility, while red indicates an increase in volatility. This feature helps you quickly identify changes in market dynamics even in periods of low volatility.
• Histogram display: In addition to the colors, the indicator can also be displayed as a histogram. This intuitive representation allows you to visually observe changes in volatility over time and detect emerging patterns or trends in markets with low volatility.
Settings
The Logarithmic Volatility Indicator allows you to customize various settings to suit your specific trading needs:
• Slow EMA length: you can select the length of the slow exponential moving average according to your preferences and trading strategies.
• Fast EMA length: Similarly, you can choose the length of the fast exponential moving average to suit your trading style.
• Average EMA length: In addition to the two EMA lengths above, this indicator offers a third EMA length for even more detailed analysis. This additional feature is especially useful when trading in markets with low volatility, as it allows you to capture subtle changes in market dynamics.
Trading
The Logarithmic Volatility Indicator is designed not only to provide you with essential information about market volatility, but also to give you clear indications on when to trade. Here's how you can use the indicator's colors to guide your trading decisions:
- Long Trading: When the fast EMA has a smaller value than the slow EMA, the indicator will change to green. This is a signal to enter a long trade. That is, you can consider buying at this point, as an increase in price is anticipated due to decreasing volatility. With volatility declining, there is a greater likelihood that the price will continue in the current direction rather than fluctuate erratically.
- b]Short Trading: On the other hand, when the fast EMA has a higher value than the slow EMA, the indicator will turn red. This is a signal to enter a short trade. In other words, you may consider selling at this point, as a decline in price is anticipated due to rising volatility. With volatility on the rise, there is a greater risk of steeper price fluctuations.
It is important to remember that, as with any indicator, the Logarithmic Volatility Indicator does not guarantee 100% success. You should always use this indicator in combination with other analytical tools and good risk management. This tool provides you with an overview of market volatility and can help you identify trading opportunities in low volatility markets, but the final decision on when and how to trade should always be based on your own analysis and judgment.
In conclusion, the Logarithmic Volatility Indicator is an essential trading tool that every trader should have in their arsenal, especially when facing low volatility markets. With its accurate volatility calculation and easy-to-understand visualization, it will help you improve your trading decisions and maximize your profits even in situations where price movements are less pronounced. Try it today and take advantage of its efficiency in low volatility environments!
---------------------------------------------------------------------------------------------------
Presentamos el Indicador de Volatilidad Logarítmica , un innovador indicador de trading diseñado especialmente para operar en mercados con baja volatilidad. Este poderoso indicador está dirigido a traders de todos los niveles, desde principiantes hasta expertos, y se basa en conceptos fundamentales de matemáticas y estadísticas aplicadas al mercado financiero. Su objetivo principal es proporcionarte una mejor comprensión de los movimientos de precios y ayudarte a tomar decisiones de inversión más precisas, especialmente en entornos de baja volatilidad.
Con este indicador se pretende encontrar un estimador de la volatilidad que dependa de la diferencia entre el High y el Low, teniendo en cuenta que esta medida es directamente proporcional a la volatilidad. Un primer resultado fue obtenido por Parkinson (1980) que posteriormente fue mejorado por Garman y Klass (1980), que mejoraron el estimador obteniendo uno de varianza mínima. Es la versión simplificada (y recomendada por ellos mismos) del estimador de Garman y Klass la que se utiliza para calcular la volatilidad diaria del activo.
El Indicador de Volatilidad Logarítmica es un indicador de suavizado único que utiliza logaritmos y el cálculo de la volatilidad de los precios de apertura, máximo, mínimo y cierre. Combina estos elementos para obtener una representación precisa de la volatilidad del mercado en situaciones donde la volatilidad es baja.
Características
Este indicador cuenta con varias características sobresalientes diseñadas para mejorar tu análisis de trading en entornos de baja volatilidad:
• Cálculo de la volatilidad intradía: Esta función innovadora te permite ver los niveles de volatilidad del mercado en tiempo real, lo que brinda una visión clara de las fluctuaciones del mercado incluso cuando la volatilidad es baja.
• EMA (Exponential Moving Average) Multi Longitud: El indicador incorpora tres longitudes diferentes de EMA (Rápida, Media y Lenta). Esto te proporciona un análisis más profundo y detallado de la volatilidad del mercado, permitiéndote detectar cambios sutiles en la volatilidad y realizar predicciones más precisas.
• Cambio de color visual: El indicador utiliza un cambio de color entre verde y rojo para facilitar la interpretación rápida del mercado. El verde indica una disminución de la volatilidad, mientras que el rojo indica un aumento de la volatilidad. Esta característica te ayuda a identificar rápidamente cambios en la dinámica del mercado incluso en períodos de baja volatilidad.
• Visualización Histograma: Además de los colores, el indicador también se puede visualizar como un histograma. Esta representación intuitiva te permite observar de manera visual los cambios en la volatilidad a lo largo del tiempo y detectar patrones o tendencias emergentes en mercados con baja volatilidad.
Ajustes
El Indicador de Volatilidad Logarítmica te permite personalizar varios ajustes para adaptarlos a tus necesidades de trading específicas:
• Longitud de EMA lenta: Puedes seleccionar la longitud de la media móvil exponencial lenta según tus preferencias y estrategias de trading.
• Longitud de EMA rápida: De manera similar, puedes elegir la longitud de la media móvil exponencial rápida para ajustarla a tu estilo de trading.
• Longitud de EMA media: Además de las dos longitudes de EMA anteriores, este indicador ofrece una tercera longitud de EMA para un análisis aún más detallado. Esta característica adicional es especialmente útil cuando operas en mercados con baja volatilidad, ya que te permite capturar cambios sutiles en la dinámica del mercado.
Operativa
El Indicador de Volatilidad Logarítmica está diseñado no solo para brindarte información esencial sobre la volatilidad del mercado, sino también para ofrecerte indicaciones claras sobre cuándo operar. Aquí te explicamos cómo puedes utilizar los colores del indicador para guiar tus decisiones de trading:
• Operativa en Largo: Cuando la EMA rápida tiene un valor más pequeño que la EMA lenta, el indicador cambiará a color verde. Esta es una señal para entrar en una operación en largo. Es decir, puedes considerar comprar en este punto, ya que se anticipa un aumento en el precio debido a la disminución de la volatilidad. Con la volatilidad en descenso, existe una mayor probabilidad de que el precio continúe en la dirección actual en lugar de fluctuar erráticamente.
• Operativa en Corto: Por otro lado, cuando la EMA rápida tiene un valor mayor que la EMA lenta, el indicador se tornará rojo. Esta es una señal para entrar en una operación en corto. En otras palabras, puedes considerar vender en este punto, ya que se anticipa una disminución en el precio debido al aumento de la volatilidad. Con la volatilidad en ascenso, existe un mayor riesgo de fluctuaciones de precio más pronunciadas.
Es importante recordar que, como con cualquier indicador, el Indicador de Volatilidad Logarítmica no garantiza un éxito del 100%. Siempre debes usar este indicador en combinación con otras herramientas de análisis y una buena gestión de riesgos. Esta herramienta te proporciona una visión general de la volatilidad del mercado y puede ayudarte a identificar oportunidades de trading en mercados con baja volatilidad, pero la decisión final de cuándo y cómo operar siempre deberá basarse en tu propio análisis y juicio.
En conclusión, el Indicador de Volatilidad Logarítmica es una herramienta de trading esencial que todo trader debe tener en su arsenal, especialmente cuando se enfrenta a mercados con baja volatilidad. Con su cálculo preciso de la volatilidad y su visualización fácil de entender, te ayudará a mejorar tus decisiones de trading y a maximizar tus ganancias incluso en situaciones donde los movimientos de precios son menos pronunciados. ¡Pruébalo hoy mismo y aprovecha su eficiencia en entornos de baja volatilidad!

Mad_MATHLibrary "MAD_MATH"
This is a mathematical library where I store useful kernels, filters and selectors for the different types of computations.
This library also contains opensource code from other scripters.
Future extensions are very likely, there are some functions I would like to add, but I have to wait for approvals so i can include them.
Ehlers_EMA(_src, _length)
Calculates the Ehlers Exponential Moving Average (Ehlers_EMA)
Parameters:
_src (float) : The source series for calculation
_length (simple int) : The length for the Ehlers EMA
Returns: The Ehlers EMA value
Ehlers_Gaussian(_src, _length)
Calculates the Ehlers Gaussian Filter
Parameters:
_src (float) : The source series for calculation
_length (simple int) : The length for the Ehlers Gaussian Filter
Returns: The Ehlers Gaussian Filter value
Ehlers_supersmoother(_src, _length)
Calculates the Ehlers Supersmoother
Parameters:
_src (float) : The source series for calculation
_length (simple int) : The length for the Ehlers Supersmoother
Returns: The Ehlers Supersmoother value
Ehlers_SMA_fast(_src, _length)
Calculates the Ehlers Simple Moving Average (SMA) Fast
Parameters:
_src (float) : The source series for calculation
_length (simple int) : The length for the Ehlers SMA Fast
Returns: The Ehlers SMA Fast value
Ehlers_EMA_fast(_src, _length)
Calculates the Ehlers Exponential Moving Average (EMA) Fast
Parameters:
_src (float) : The source series for calculation
_length (simple int) : The length for the Ehlers EMA Fast
Returns: The Ehlers EMA Fast value
Ehlers_RSI_fast(_src, _length)
Calculates the Ehlers Relative Strength Index (RSI) Fast
Parameters:
_src (float) : The source series for calculation
_length (simple int) : The length for the Ehlers RSI Fast
Returns: The Ehlers RSI Fast value
Ehlers_Band_Pass_Filter(_src, _length)
Calculates the Ehlers BandPass Filter
Parameters:
_src (float) : The source series for calculation
_length (simple int) : The length for the Ehlers BandPass Filter
Returns: The Ehlers BandPass Filter value
Ehlers_Butterworth(_src, _length)
Calculates the Ehlers Butterworth Filter
Parameters:
_src (float) : The source series for calculation
_length (simple int) : The length for the Ehlers Butterworth Filter
Returns: The Ehlers Butterworth Filter value
Ehlers_Two_Pole_Gaussian_Filter(_src, _length)
Calculates the Ehlers Two-Pole Gaussian Filter
Parameters:
_src (float) : The source series for calculation
_length (simple int) : The length for the Ehlers Two-Pole Gaussian Filter
Returns: The Ehlers Two-Pole Gaussian Filter value
Ehlers_Two_Pole_Butterworth_Filter(_src, _length)
Calculates the Ehlers Two-Pole Butterworth Filter
Parameters:
_src (float) : The source series for calculation
_length (simple int) : The length for the Ehlers Two-Pole Butterworth Filter
Returns: The Ehlers Two-Pole Butterworth Filter value
Ehlers_Band_Stop_Filter(_src, _length)
Calculates the Ehlers Band Stop Filter
Parameters:
_src (float) : The source series for calculation
_length (simple int) : The length for the Ehlers Band Stop Filter
Returns: The Ehlers Band Stop Filter value
Ehlers_Smoother(_src)
Calculates the Ehlers Smoother
Parameters:
_src (float) : The source series for calculation
Returns: The Ehlers Smoother value
Ehlers_High_Pass_Filter(_src, _length)
Calculates the Ehlers High Pass Filter
Parameters:
_src (float) : The source series for calculation
_length (simple int) : The length for the Ehlers High Pass Filter
Returns: The Ehlers High Pass Filter value
Ehlers_2_Pole_High_Pass_Filter(_src, _length)
Calculates the Ehlers Two-Pole High Pass Filter
Parameters:
_src (float) : The source series for calculation
_length (simple int) : The length for the Ehlers Two-Pole High Pass Filter
Returns: The Ehlers Two-Pole High Pass Filter value
pr(_src, _length)
pr Calculates the percentage rank (PR) of a value within a range.
Parameters:
_src (float) : The source value for which the percentage rank is calculated. It represents the value to be ranked within the range.
_length (simple int) : The _length of the range over which the percentage rank is calculated. It determines the number of bars considered for the calculation.
Returns: The percentage rank (PR) of the source value within the range, adjusted by adding 50 to the result.
smma(_src, _length)
Calculates the SMMA (Smoothed Moving Average)
Parameters:
_src (float) : The source series for calculation
_length (simple int)
Returns: The SMMA value
hullma(_src, _length)
Calculates the Hull Moving Average (HullMA)
Parameters:
_src (float) : The source series for calculation
_length (simple int) : The _length of the HullMA
Returns: The HullMA value
tma(_src, _length)
Calculates the Triple Moving Average (TMA)
Parameters:
_src (float) : The source series for calculation
_length (simple int) : The _length of the TMA
Returns: The TMA value
dema(_src, _length)
Calculates the Double Exponential Moving Average (DEMA)
Parameters:
_src (float) : The source series for calculation
_length (simple int) : The _length of the DEMA
Returns: The DEMA value
tema(_src, _length)
Calculates the Triple Exponential Moving Average (TEMA)
Parameters:
_src (float) : The source series for calculation
_length (simple int) : The _length of the TEMA
Returns: The TEMA value
w2ma(_src, _length)
Calculates the Normalized Double Moving Average (N2MA)
Parameters:
_src (float) : The source series for calculation
_length (simple int) : The _length of the N2MA
Returns: The N2MA value
wma(_src, _length)
Calculates the Normalized Moving Average (NMA)
Parameters:
_src (float) : The source series for calculation
_length (simple int) : The _length of the NMA
Returns: The NMA value
nma(_open, _close, _length)
Calculates the Normalized Moving Average (NMA)
Parameters:
_open (float) : The open price series
_close (float) : The close price series
_length (simple int) : The _length for finding the highest and lowest values
Returns: The NMA value
lma(_src, _length)
Parameters:
_src (float)
_length (simple int)
zero_lag(_src, _length, gamma1, zl)
Calculates the Zero Lag Moving Average (ZeroLag)
Parameters:
_src (float) : The source series for calculation
_length (simple int) : The length for the moving average
gamma1 (simple int) : The coefficient for calculating 'd'
zl (simple bool) : Boolean flag for applying Zero Lag
Returns: An array containing the ZeroLag Moving Average and a boolean flag indicating if it's flat
copyright HPotter, thanks for that great function
chebyshevI(src, len, ripple)
Calculates the Chebyshev Type I Filter
Parameters:
src (float) : The source series for calculation
len (int) : The length of the filter
ripple (float) : The ripple factor for the filter
Returns: The output of the Chebyshev Type I Filter
math from Pafnuti Lwowitsch Tschebyschow (1821–1894)
Thanks peacefulLizard50262 for the find and translation
chebyshevII(src, len, ripple)
Calculates the Chebyshev Type II Filter
Parameters:
src (float) : The source series for calculation
len (int) : The length of the filter
ripple (float) : The ripple factor for the filter
Returns: The output of the Chebyshev Type II Filter
math from Pafnuti Lwowitsch Tschebyschow (1821–1894)
Thanks peacefulLizard50262 for the find
wavetrend(_src, _n1, _n2)
Calculates the WaveTrend indicator
Parameters:
_src (float) : The source series for calculation
_n1 (simple int) : The period for the first EMA calculation
_n2 (simple int) : The period for the second EMA calculation
Returns: The WaveTrend value
f_getma(_type, _src, _length, ripple)
Calculates various types of moving averages
Parameters:
_type (simple string) : The type of indicator to calculate
_src (float) : The source series for calculation
_length (simple int) : The length for the moving average or indicator
ripple (simple float)
Returns: The calculated moving average or indicator value
f_getfilter(_type, _src, _length)
Calculates various types of filters
Parameters:
_type (simple string) : The type of indicator to calculate
_src (float) : The source series for calculation
_length (simple int) : The length for the moving average or indicator
Returns: The filtered value
f_getoszillator(_type, _src, _length)
Calculates various types of Deviations and other indicators
Parameters:
_type (simple string) : The type of indicator to calculate
_src (float) : The source series for calculation
_length (simple int) : The length for the moving average or indicator
Returns: The calculated moving average or indicator value

Trend AngleIntroduction:
In today's post, we'll dive deep into the source code of a unique trading tool, the Trend Angle Indicator. The script is an indicator that calculates the trend angle for a given financial instrument. This powerful tool can help traders identify the strength and direction of a trend, allowing them to make informed decisions.
Overview of the Trend Angle Indicator:
The Trend Angle Indicator calculates the trend angle based on the slope of the price movement over a specified period. It uses an Exponential Moving Average (EMA) to smooth the data and an Epanechnikov kernel function for additional smoothing. The indicator provides a visual representation of the trend angle, making it easy to interpret for traders of all skill levels.
Let's break down the key components of the script:
Inputs:
Length: The number of periods to calculate the trend angle (default: 8)
Scale: A scaling factor for the ATR (Average True Range) calculation (default: 2)
Smoothing: The smoothing parameter for the Epanechnikov kernel function (default: 2)
Smoothing Factor: The radius of the Epanechnikov kernel function (default: 1)
Functions:
ema(): Exponential Moving Average calculation
atan2(): Arctangent function
degrees(): Conversion of radians to degrees
epanechnikov_kernel(): Epanechnikov kernel function for additional smoothing
Calculations:
atr: The EMA of the True Range
slope: The slope of the price movement over the given length
angle_rad: The angle of the slope in radians
degrees: The smoothed angle in degrees
Plotting:
Trend Angle: The trend angle, plotted as a line on the chart
Horizontal lines: 0, 90, and -90 degrees as reference points
How the Trend Angle Indicator Works:
The Trend Angle Indicator begins by calculating the Exponential Moving Average (EMA) of the True Range (TR) for a given financial instrument. This smooths the price data and provides a more accurate representation of the instrument's price movement.
Next, the indicator calculates the slope of the price movement over the specified length. This slope is then divided by the scaled ATR to normalize the trend angle based on the instrument's volatility. The angle is calculated using the atan2() function, which computes the arctangent of the slope.
The final step in the process is to smooth the trend angle using the Epanechnikov kernel function. This function provides additional smoothing to the trend angle, making it easier to interpret and reducing the impact of short-term price fluctuations.
Conclusion:
The Trend Angle Indicator is a powerful trading tool that allows traders to quickly and easily determine the strength and direction of a trend. By combining the Exponential Moving Average, ATR, and Epanechnikov kernel function, this indicator provides an accurate and easily interpretable representation of the trend angle. Whether you're an experienced trader or just starting, the Trend Angle Indicator can provide valuable insights into the market and help improve your trading decisions.

Radar RiderThe Radar Rider indicator is a powerful tool that combines multiple technical indicators into a single spider plot, providing traders with a comprehensive view of market conditions. This article will delve into the workings of each built-in indicator and their arrangement within the spider plot. To better understand the structure of the script, let's first examine some of the primary functions and how they are utilized in the script.
Normalize Function: normalize(close, len)
The normalize function takes the close price and a length as arguments and normalizes the price data by scaling it between 0 and 1, making it easier to compare different indicators.
Exponential Moving Average (EMA) Filter: bes(source, alpha)
The EMA filter is used to smooth out data using an exponential moving average, with the given alpha value defining the level of smoothing. This helps reduce noise and enhance the trend-following characteristics of the indicators.
Maximum and Minimum Functions: max(src) and min(src)
These functions find the maximum and minimum values of the input data over a certain period, respectively. These values are used in the normalization process and can help identify extreme conditions in the market.
Min-Max Function: min_max(src)
The min-max function scales the input data between 0 and 100 by dividing the difference between the data point and the minimum value by the range between the maximum and minimum values. This standardizes the data, making it easier to compare across different indicators.
Slope Function: slope(source, length, n_len, pre_smoothing = 0.15, post_smoothing = 0.7)
The slope function calculates the slope of a given data source over a specified length, and then normalizes it using the provided normalization length. Pre-smoothing and post-smoothing values can be adjusted to control the level of smoothing applied to the data before and after calculating the slope.
Percent Function: percent(x, y)
The percent function calculates the percentage difference between two values, x and y. This is useful for comparing the relative change in different indicators.
In the given code, there are multiple indicators included. Here, we will discuss each of them in detail.
EMA Diff:
The Exponential Moving Average (EMA) Diff is the difference between two EMA values of different lengths. The EMA is a type of moving average that gives more weight to recent data points. The EMA Diff helps traders identify trends and potential trend reversals. In the code, the EMA Diff is calculated using the ema_diff() function, which takes length, close, filter, and len_norm as parameters.
Percent Rank EMA Diff:
The Percent Rank EMA Diff is the percentage rank of the EMA Diff within a given range. It helps traders identify overbought or oversold conditions in the market. In the code, the Percent Rank EMA Diff is calculated using the percent_rank_ema_diff() function, which takes length, close, filter, and len_norm as parameters.
EMA Diff Longer:
The EMA Diff Longer is the difference between two EMA values of different lengths, similar to EMA Diff but with a longer period. In the code, the EMA Diff Longer is calculated using the ema_diff_longer() function, which takes length, close, filter, and len_norm as parameters.
RSI Filter:
The Relative Strength Index (RSI) is a momentum oscillator that measures the speed and change of price movements. The RSI Filter is the RSI value passed through a filter to smooth out the data. In the code, the RSI Filter is calculated using the rsi_filter() function, which takes length, close, and filter as parameters.
RSI Diff Normalized:
The RSI Diff Normalized is the normalized value of the derivative of the RSI. It helps traders identify potential trend reversals in the market. In the code, the RSI Diff Normalized is calculated using the rsi_diff_normalized() function, which takes length, close, filter, len_mad, and len_norm as parameters.
Z Score:
The Z Score is a statistical measurement that describes a value's relationship to the mean of a group of values. In the context of the code, the Z Score is calculated for the closing price of a security. The z_score() function takes length, close, filter, and len_norm as parameters.
EMA Normalized:
The EMA Normalized is the normalized value of the EMA, which helps traders identify trends and potential trend reversals in the market. In the code, the EMA Normalized is calculated using the ema_normalized() function, which takes length, close, filter, and len_norm as parameters.
WMA Volume Normalized:
The Weighted Moving Average (WMA) Volume Normalized is the normalized value of the WMA of the volume. It helps traders identify volume trends and potential trend reversals in the market. In the code, the WMA Volume Normalized is calculated using the wma_volume_normalized() function, which takes length, volume, filter, and len_norm as parameters.
EMA Close Diff Normalized:
The EMA Close Diff Normalized is the normalized value of the derivative of the EMA of the closing price. It helps traders identify potential trend reversals in the market. In the code, the EMA Close Diff Normalized is calculated using the ema_close_diff_normalized() function, which takes length, close, filter, len_mad, and len_norm as parameters.
Momentum Normalized:
The Momentum Normalized is the normalized value of the momentum, which measures the rate of change of a security's price. It helps traders identify trends and potential trend reversals in the market. In the code, the Momentum Normalized is calculated using the momentum_normalized() function, which takes length, close, filter, and len_norm as parameters.
Slope Normalized:
The Slope Normalized is the normalized value of the slope, which measures the rate of change of a security's price over a specified period. It helps traders identify trends and potential trend reversals in the market. In the code, the Slope Normalized is calculated using the slope_normalized() function, which takes length, close, filter, and len_norm as parameters.
Trend Intensity:
Trend Intensity is a measure of the strength of a security's price trend. It is based on the difference between the average of price increases and the average of price decreases over a given period. The trend_intensity() function in the code calculates the Trend Intensity by taking length, close, filter, and len_norm as parameters.
Volatility Ratio:
The Volatility Ratio is a measure of the volatility of a security's price, calculated as the ratio of the True Range (TR) to the Exponential Moving Average (EMA) of the TR. The volatility_ratio() function in the code calculates the Volatility Ratio by taking length, high, low, close, and filter as parameters.
Commodity Channel Index (CCI):
The Commodity Channel Index (CCI) is a momentum-based oscillator used to help determine when an investment vehicle is reaching a condition of being overbought or oversold. The CCI is calculated as the difference between the mean price of a security and its moving average, divided by the mean absolute deviation (MAD) of the mean price. In the code, the CCI is calculated using the cci() function, which takes length, high, low, close, and filter as parameters.
These indicators are combined in the code to create a comprehensive trading strategy that considers multiple factors such as trend strength, momentum, volatility, and overbought/oversold conditions. The combined analysis provided by these indicators can help traders make informed decisions and improve their chances of success in the market.
The Radar Rider indicator is a powerful tool that combines multiple technical indicators into a single, easy-to-read visualization. By understanding the inner workings of each built-in indicator and their arrangement within the spider plot, traders can better interpret market conditions and make informed trading decisions.
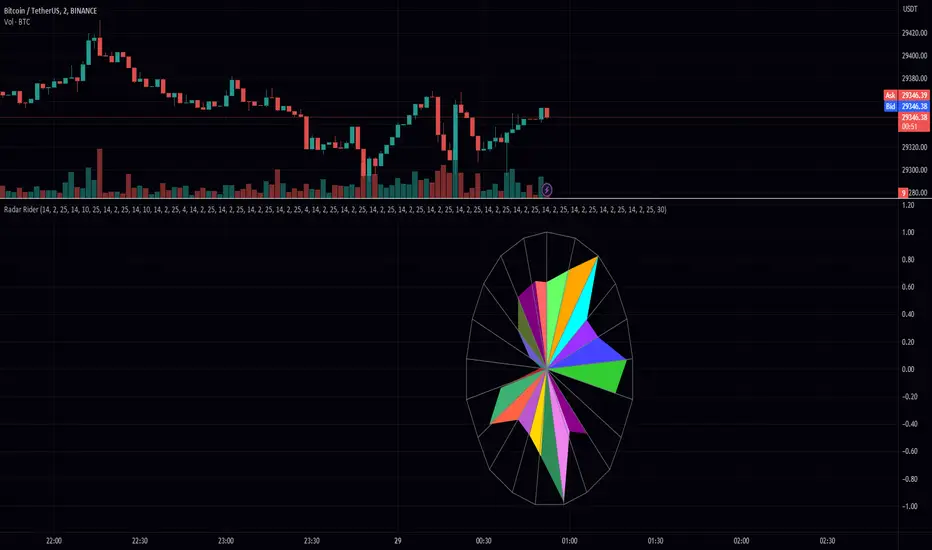
Ac Full Scalping 1.0These unified indicators are used for a 5-minute scalping strategy.
We regularly look for the RSI to be overbought and the price to be outside the bollinger bands as the main analysis.
This serves as a search protocol, to then analyze the price action by visually assisting us with 4 exponential moving averages to see wear or breakout of a move.
It also adds the distance from the price close to the 10-period exponential moving average, developed in two modes where you can mark a background color where the event occurs, or you can choose a shadow that is drawn from the exponential moving average to the closing price.
These two modes can be activated or deactivated so that each person can choose the most visually comfortable way to observe that distance, it is recommended to use one at a time and not both at the same time.
The distance indicator can also be used to change the distance percentage. The percentage as a minimum value admits 0.50%, but it is recommended to use it above 0.80% to make the analysis more effective.
People can also change colors of exponential moving averages, but it is not recommended, and the period cannot be changed to keep the analysis more specific.
The RSI indicator should be added separately, as it is used to see overbought values and divergences.
The other indicators are unified but can be turned on or off for better analysis.
As a summary, what is sought with this type of unified indicators is the attrition, break or retracement in 5-minute time frame to open only short trades.
Historical AverageHistorical Average is a script written in the Pine Script language and is used to calculate various types of moving averages. Moving averages are statistical measures that smooth out data over time, making it easier to identify trends and patterns. This script allows the user to select from several different types of moving averages, including Simple Moving Average (SMA), Linear Weighted Moving Average (LWMA), Exponential Moving Average (EMA), Double Exponential Moving Average (DEMA), Triple Exponential Moving Average (TEMA), and Quadruple Exponential Moving Average (QEMA). The script also allows the user to specify a data source for the moving averages to be calculated from.
To use this script, the user simply needs to specify the data source and select the desired moving average type from the list. The script will then calculate and plot the selected moving average on the chart. This can be useful for traders and investors who want to gain a better understanding of the trends and patterns in the data they are analyzing.